University of Connecticut
OpenCommons@UConn
Doctoral Dissertations University of Connecticut Graduate School
11-8-2018
Aiming for Success: Evaluating Statistical and
Machine Learning Methods to Predict High
School Student Performance and Improve Early
Warning Systems
David Alexandro
University of Connecticut - Storrs, [email protected]
Follow this and additional works at:https://opencommons.uconn.edu/dissertations
Recommended Citation
Alexandro, David, "Aiming for Success: Evaluating Statistical and Machine Learning Methods to Predict High School Student Performance and Improve Early Warning Systems" (2018).Doctoral Dissertations. 1982.
Aiming for Success: Evaluating Statistical and Machine Learning Methods to Predict High School Student Performance and Improve Early Warning Systems
David M. Alexandro University of Connecticut, 2018
In response to the high school dropout crisis, which comes with great economic and social costs, early warning systems (EWSs) have been developed to systematically predict and improve student outcomes. The purpose of this study is to evaluate different statistical and machine learning methods to predict high school student performance and improve EWSs. By improving education EWSs, this study aims to better identify those students in need of targeted support and inform on-the-ground practitioners who may intervene long before students may be dropping out.
The current study explores the aforementioned methods in the context of a cohort of 40,008 Connecticut students. The study utilized more than 100 predictors and developed models to predict each student’s probability of being on-track to graduate within four years using data collected prior to a student’s entry into 9th grade. Random forests, classification and regression
tree (CART, or decision tree), and regularized logistic regression—ridge, lasso, and elastic net— models were developed, and performance of the models was evaluated on a validation dataset by comparing classification accuracy measures.
The study revealed that random forests models developed using a training set balanced by oversampling did the best job of identifying which students are at risk. These models captured complex interactions among covariates and performed best when thresholds were optimized using Youden’s index rather than defaulted at a 0.5 cut-off. The variable importance rankings showed that standardized test scores, attendance, and course performance were the top-ranking
David M. Alexandro – University of Connecticut, 2018
to complement random forests results. In addition, incorporating detailed special education-related predictors served to improve classification accuracy, especially for students with disabilities.
This study is filling a practical void in education to support the development of more sophisticated predictive models. This will be usable by researchers as an approach to ensure future EWSs work optimally. It is also an opportunity for practitioners to leverage new
knowledge about students who are at-risk, and to test interventions at many levels in an attempt to improve graduation outcomes.
Aiming For Success: Evaluating Statistical and Machine Learning Methods to Predict High School Student Performance and Improve Early Warning Systems
David M. Alexandro
B.S., Providence College B.S., Columbia University M.Ed., University of Minnesota M.A., University of Connecticut
A Dissertation
Submitted in Partial Fulfillment of the Requirements for the Degree of
Doctor of Philosophy at the
University of Connecticut 2018
Copyright by David M. Alexandro
APPROVAL PAGE
Doctor of Philosophy Dissertation
Aiming For Success: Evaluating Statistical and Machine Learning Methods to Predict High School Student Performance and Improve Early Warning Systems
Presented by David M. Alexandro Major Advisor ______________________________________________________________ Christopher Rhoads Associate Advisor ___________________________________________________________ H. Jane Rogers Associate Advisor ___________________________________________________________ Hariharan Swaminathan Associate Advisor ___________________________________________________________ Suzanne M. Wilson Associate Advisor ___________________________________________________________ Charles Martie University of Connecticut
Acknowledgements
So many people have played a significant role in my development personally,
professionally, and academically. I am grateful for the lessons you have helped me learn and the friendships we have formed along the way.
First, I acknowledge my major advisor, Chris Rhoads. You have supported me from the beginning of my MEA journey, and have challenged me to be clear, to ask the right questions, and to be thoughtful and thorough in my research. You are dedicated to your family, and I am grateful for your understanding and encouragement as I navigated my doctoral studies as a husband and father. Thank you for your humility, selflessness, and kindness.
I acknowledge my associate advisor, Suzanne Wilson, who took me under her wing during my first year at UConn. You helped me to become a better writer and to think more broadly as a problem solver and scholar. You are a master teacher, and I am grateful for your friendship and generosity.
I acknowledge my associate advisor, Hariharan Swaminathan. Swami, whether you were teaching me Bayesian procedures or talking with me about sports analytics and wine, you drew me in and shared your brilliance with such ease. Most of all, you genuinely cared about
developing my ability to learn, understand, and apply difficult and essential statistical concepts. I acknowledge my associate advisor, Jane Rogers. From IRT to programming, you helped me to be more systematic in my approach to problem solving. I have been lucky to work with you and learn from you, and I am especially grateful for your supervision and support at CSDE.
I acknowledge my associate advisor, Charles Martie. Chuck, I am blessed to work with you each day, and I am grateful for all you have taught me. You have an uncanny ability to consider problems from different perspectives and to elevate those with whom you collaborate.
From EIT development to Wiffle Ball on the Connecticut River, I could not ask for a better teammate.
I acknowledge Eric Loken, who helped shape my study in its early stages and gave valuable feedback at my proposal defense. Thank you for all you taught me about modeling and for your willingness to share your time and talents. I always enjoy our conversations.
I acknowledge the UConn professors who were not directly involved with this study, but who were integral to my development. Betsy McCoach, thank you for welcoming me to the program, challenging me to go outside my comfort zone, and preparing me for the important work I am doing today. Thank you to Bianca Montrosse-Moorhead, Ron Beghetto, Ram Gopal, Noel Card, and Aarti Bellara for all you taught me.
I acknowledge my fellow doctoral students with whom I’ve spent countless hours and shared many laughs, and from whom I’ve learned so much. I am grateful for your friendships. William Estépar García, thank you for your endless support of me and my work. Kristen Juskiewicz, thank you for keeping us focused on the finish line. Dakota Cintron, thank you for always being up for anything—from a night at the Comedy Cellar to a midnight debugging session. Graham Rifenbark, thank you for ramping up my R skills and for the many chats over the years. Jeremy Landa, thank you for your encouragement and valuable feedback. Thanks also to Shirley Li, Amit Savkar, Katy Field, Chris Amspaugh, Xiaowen Liu, Jennifer Richardson, Danielle Bousquet, Kevin Agnello, Tanesia Beverly, Anthony Gambino, Dani Yomtov, Craig Waterman, Hui Hui Yu, Glen Davenport, Eleanor Maddock, Sarah Newton, and Janice Kooken.
I acknowledge my colleagues at the Performance Office at the Connecticut State
Department of Education, especially Pei-Hsuan Chiu, Ajit Gopalakrishnan, Gil Andrada, and the EdSight team. Pei, thank you for your friendship and encouragement always. Ajit, thank you for
your leadership and support. I am grateful to work with such a great group of people.
I acknowledge Francis X. Archambault, Jr., J. Raymond and Augusta Gerberich, Robert K. Gable, and the United States Department of Education for awarding me fellowships that provided me the financial support to focus on my doctoral studies full-time.
I acknowledge the students and players I have taught and coached over the years, as well as my fellow teachers and coaches. You have brought me joy and I am grateful.
I acknowledge my friends from Providence to Palo Alto. Special thanks to Chelsea, Matt, Frank, Nancy, Joe, Tom, Dennis, Keith, Ann, Dan, Lynn, Chandra, Basil, Emily, Bill, Trish, and Ellen. I will forever be grateful for the mentorship and love of Sr. Mary Jane Paolella, Kevin Basmadjian, and Dick Gagliardi, three dear friends who passed away during my time at UConn.
Lastly, I acknowledge my family. Mom and Dad, thank you for your love, generosity, and encouragement, and for the example you set for me as teachers, partners, parents, and friends. I owe everything to you. Rich, Ted, Trish, Amy, Lang, Madalyn, Lyndon, and Ryan: Thank you for being my biggest cheerleaders and for helping me through every challenge. Paul and Sonia, thank you for your love and the daily sacrifices you make for us.
I am most grateful and indebted to my wife for her unconditional love and endless patience. Jennifer, you are the best person I know. Thank you for your selflessness, courage, and strength, and for the sacrifices you made in returning to the classroom to support our family. You have so many gifts and talents, and the kids and I are blessed to have you in our lives. Thanks to Kieran, Peter, and Elena for understanding when I had to write a paper, and for making me laugh, cheering me on, and bringing so much joy to my life. Mommy and I are proud of you.
Thanks to all who have inspired me and helped me on this path. I could not have completed this project without you.
Table of Contents
List of Tables ... xi
List of Figures ... xiii
Chapter 1 Introduction ... 1
Chapter 2 Literature Review ... 11
2.1 High School Graduation Rates in the United States ... 11
2.1.1 Graduation rates for special populations. ... 12
2.2 Costs of Dropping Out ... 14
2.3 Early Warning Systems... 15
2.4 Predictive Factors... 17
2.4.1 The On-Track in 9th Grade Indicator. ... 19
2.5 Interventions ... 20
2.6 Modeling Cultures and Approaches ... 22
2.6.1 Logistic Regression ... 23
2.6.1.1 Regularization methods ... 23
Ridge regression... 24
Lasso regression. ... 25
Elastic net regression. ... 26
2.6.1.2 Applied logistic regression and regularization studies. ... 27
2.6.2 Machine Learning. ... 28
2.6.2.1 Classification and Regression Trees. ... 29
2.6.2.2 Random Forests. ... 29
2.6.3 Applied Research Using Supervised Learning. ... 30
2.6.4 Addressing Training Data Imbalance. ... 33
2.6.4.1 Data Preprocessing: Undersampling versus Oversampling. ... 34
2.6.4.2 Threshold Criteria. ... 35
2.7 Validating Early Warning Systems ... 36
2.8 The Impact and Potential of Early Warning Systems ... 37
2.9 The Early Indication Tool (EIT): Connecticut’s Early Warning System ... 38
Chapter 3 Methods ... 39
3.2.1 Study samples. ... 41
3.2.1.1 Sample 1: Longitudinal dataset. ... 42
3.2.1.2 Sample 2: Single-year snapshot dataset. ... 43
3.2.1.3 Missing and imputed data. ... 44
3.2.1.4 Summary Statistics... 45
3.2.2 Training and validation datasets. ... 45
3.2.2.1 Training and validation datasets for Sample 1. ... 46
3.2.2.2 Training and validation datasets for Sample 2. ... 47
3.2.2.3 Validation datasets. ... 48
3.3 Analysis... 49
3.3.1 Model development. ... 49
3.3.2 Classification accuracy measures. ... 51
3.3.2.1 Accuracy Equations. ... 52 3.3.2.2 Thresholds. ... 54 3.3.2.3 Data visualizations. ... 54 ROC curves. ... 54 3.3.3 Research Questions... 55 Chapter 4 Results ... 59 4.1 Part 1 Results ... 59
4.1.1 Accuracy comparisons for Part 1... 59
4.1.1.1 Accuracy comparisons for 0.5 threshold. ... 59
4.1.1.2 Accuracy comparisons for optimal thresholds. ... 62
4.1.2 ROC curve comparisons for Part 1. ... 65
4.1.2.1 ROC curve comparisons for Imbalanced Training Sample 1. ... 65
4.1.2.2 ROC curve comparisons for Balanced Training Sample 1. ... 66
4.1.3 Precision plot comparisons for Top K for Sample 1. ... 67
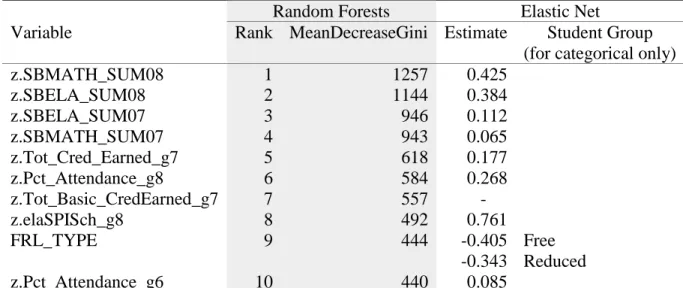
4.1.4 Variable importance rankings and values for Part 1. ... 68
4.1.5 Comparison of processing times for model training and testing using Sample 1. ... 69
4.2 Part 2 Longitudinal Results ... 70
4.3 Part 2 Snapshot Results ... 72
4.3.1 Accuracy comparisons for snapshot models. ... 73
4.3.1.1 Accuracy comparisons related to special education. ... 73
4.3.2 ROC curve comparisons for snapshot models. ... 76
4.3.3 Variable importance rankings to identify which variables predict being on-track to graduate. ... 78
4.3.3.1 Variable importance and elastic net coefficients for Primary Disability Code. ... 81
Chapter 5 Discussion ... 83
5.1 Purpose and Major Findings ... 83
5.1.1 Purpose. ... 83
5.1.2 Major Findings. ... 84
5.2 Unexpected Results ... 88
5.3 Implications of Results ... 89
5.4 Limitations and Future Studies ... 92
5.4.1 Limitations. ... 92
5.4.2 Future Studies. ... 92
5.5 Conclusion ... 94
References ... 95
Appendices ... 113
Appendix A: Data definitions ... 113
Appendix B: Correlation matrix, missing data, and summary statistics for Part 1 ... 118
Appendix C: Classification Accuracy Measures for Part 1... 125
Appendix D: R output for Ridge Grade 8 model trained using oversampled training Sample 1 ... 127
Appendix E: R output for Lasso Grade 8 model trained using oversampled training Sample 1 ... 133
Appendix F: R output for Elastic Net Grade 8 model trained using oversampled training Sample 1 ... 139
Appendix G: R output for CART Grade 8 model trained using oversampled training Sample 1 ... 145
Appendix H: R output for Random Forests Grade 8 model trained using oversampled training Sample 1 ... 156
Appendix I: ROC Curve Comparisons for Part 1 Undersampled ... 161
Appendix J: Correlation matrix and related plots for Part 2 ... 162
Appendix K: R output for elastic net and random forests models trained using Subsample 1 in Part 2 ... 164
Appendix L: R output for elastic net and random forests models trained using Subsample 2 in Part 2 ... 175 Appendix M: R output for elastic net and random forests models trained using Subsample 3 in Part 2 ... 185 Appendix N: R output for elastic net and random forests models trained using Subsample 4 in Part 2 ... 196 Appendix O: R output for elastic net and random forests models trained using Subsample 5 in Part 2 ... 208 Appendix P: R output for elastic net and random forests models trained using Subsample 6 in Part 2 ... 219
List of Tables
Table 1 Criteria for On-track in 9th grade indicator ... 3
Table 2 Graduation rates in Chicago Public Schools for students with disabilities ... 13
Table 3 Interventions that Demonstrably Raise the High School Graduation Rate ... 21
Table 4 Overview of Fields Considered in Creating Models to Predict Being On-Track in 9th Grade ... 41
Table 5 Student group proportions within full dataset and study samples ... 43
Table 6 Number of imputed SBAC scores by grade ... 44
Table 7 Student group proportions within full dataset and training samples ... 48
Table 8 Student group proportions within full dataset and validation samples ... 49
Table 9 R functions and parameters used in model development ... 50
Table 10 Classification accuracy measures for Grade 8 models for Imbalanced Training Sample 1 with 0.5 threshold... 61
Table 11 Classification accuracy measures for Grade 8 models trained with oversampled Training Sample 1 with optimal thresholds ... 63
Table 12 Variable importance rankings and coefficient estimates for Grade 8 models trained with Oversampled Training Sample 1 ... 68
Table 13 Processing times for model training and testing using Sample 1 ... 70
Table 14 Classification accuracy measures for Grade 8 and Grade 9 random forests models trained with Oversampled Sample 1 with optimal thresholds ... 70
Table 15 Variable importance rankings and coefficient estimates for Grade 9 models trained with Oversampled Training Sample 1 ... 71
Table 16 Training samples for the snapshot models ... 73
Table 17 Classification accuracy measures for special education-related subsamples for Grade 8 random forests snapshot models ... 74
Table 18 Classification accuracy measures for SWD records ... 75
Table 19 Classification accuracy measures for Alliance District-related subsamples for Grade 8 random forests snapshot models ... 75
Table 21 Variable importance rankings and values for random forests models trained with subsamples 1 and 2 ... 78 Table 22 Elastic net model estimates for all non-zero coefficients for the primary disability codes for subsample 3 ... 82 Table 23 Data definitions for fields considered to predict On-Track in Grade 9 for Connecticut students ... 113 Table 24 Missing data counts for full dataset ... 123 Table 25 Summary statistics for full dataset ... 123 Table 26 Classification accuracy measures for Grade 8 regularized logistic regression models for Sample 1 with 0.5 threshold... 125 Table 27 Classification accuracy measures for Grade 8 machine learning models for Sample 1 with 0.5 threshold... 125 Table 28 Classification accuracy measures for Grade 8 regularized logistic regression models for Sample 1 with optimal thresholds ... 126 Table 29 Classification accuracy measures for Grade 8 machine learning models for Sample 1 with optimal thresholds ... 126
List of Figures
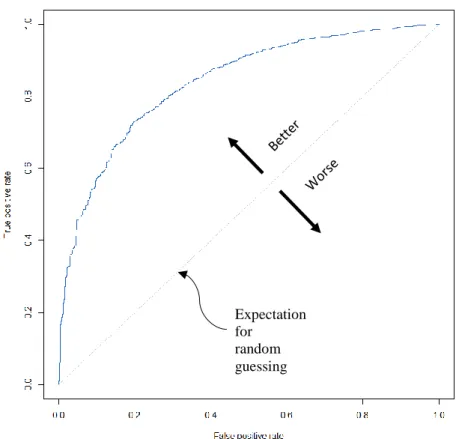
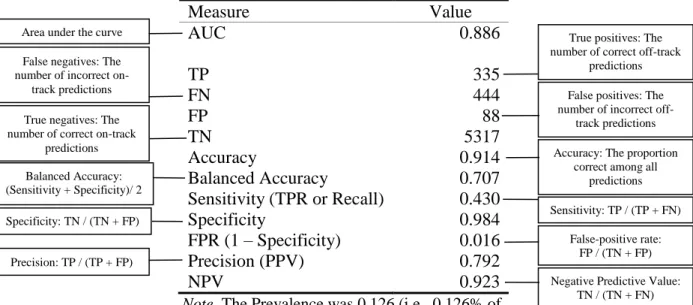
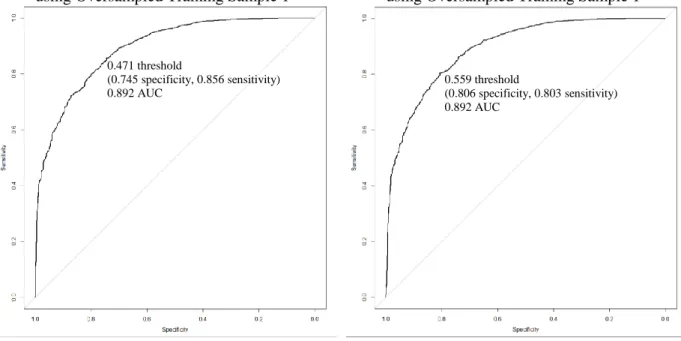
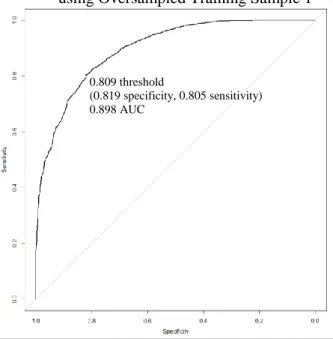
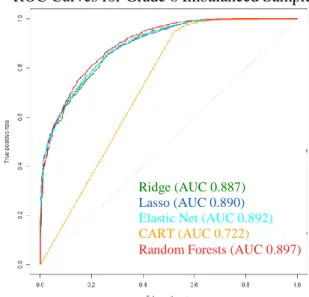
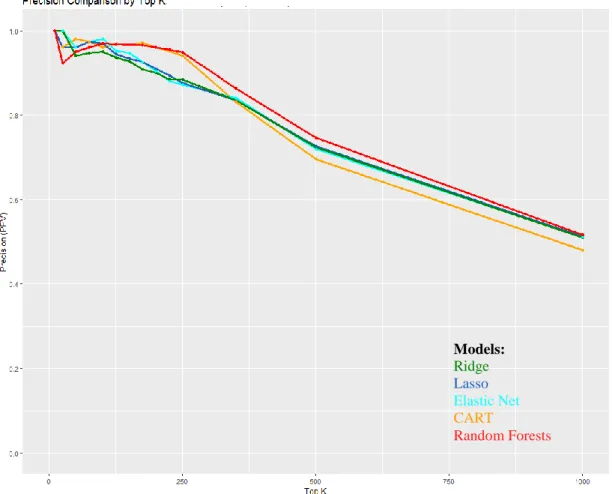
Figure 1. Flowchart to explain how training and validation samples were created ... 47 Figure 2. Contingency table ... 52 Figure 3. Sample ROC curve ... 55 Figure 4. Annotated table of classification accuracy measures for Grade 8 logistic regression model for Imbalanced Training Sample 1 with 0.5 threshold ... 60 Figure 5. Grade 8 ROC Curve (including AUC and optimal threshold) for Ridge model using Oversampled Training Sample 1 ... 64 Figure 6. Grade 8 ROC Curve (including AUC and optimal threshold) for Lasso model using Oversampled Training Sample 1 ... 64 Figure 7. Grade 8 ROC Curve (including AUCs and optimal thresholds) for Elastic Net model using Oversampled Training Sample 1 ... 64 Figure 8. Grade 8 ROC Curve (including AUCs and optimal thresholds) for CART model using Oversampled Training Sample 1 ... 64 Figure 9. Grade 8 ROC Curves (including AUCs and optimal thresholds) for Random Forest models ... 65 Figure 10. ROC Curve Comparison using Imbalanced Training Sample 1 ... 66 Figure 11. ROC Curve Comparison using Oversampled Training Sample 1 ... 66 Figure 12. Precision comparison by Top K for Grade 8 models with Sample 1 at optimal
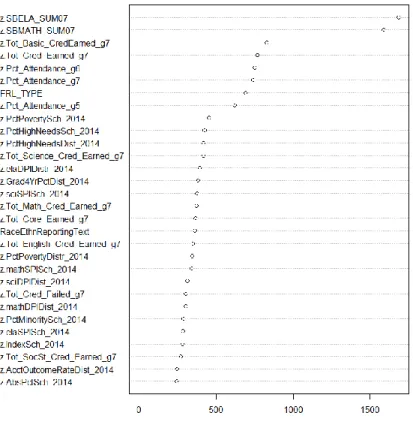
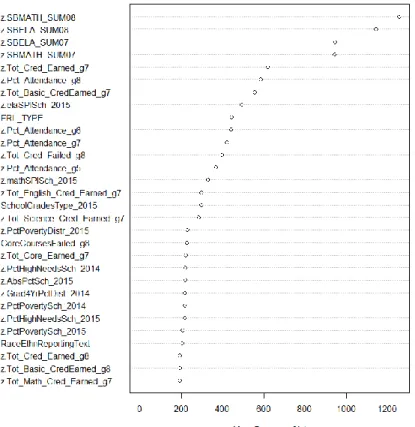
thresholds ... 67 Figure 13. Variable importance for Grade 8 random forests model trained with Oversampled Training Sample 1 ... 69 Figure 14. Variable importance for random forests, Grade 9, Oversampled Sample 1 ... 72 Figure 15. ROC curve comparison for grade 8 snapshot models using subsamples 1, 2, and 3: SWD records only ... 77 Figure 16. ROC curve comparison for grade 8 snapshot models using subsamples 1, 2, and 3: Alliance District records only ... 77 Figure 17. Variable importance for Grade 8 random forests subsample 1: All students; Detailed special education-related predictors ... 78 Figure 18. Variable importance for Grade 8 random forests subsample 2: All students; Binary
Figure 19. Variable importance for Grade 8 random forests subsample 3: SWD; Detailed special education-related predictors ... 79 Figure 20. Variable importance for Grade 8 random forests subsample 4: Students without identified disabilities; No special education-related predictors ... 80 Figure 21. Variable importance for Grade 8 random forests subsample 5: Students enrolled in Alliance Districts; Detailed special education-related predictors ... 80 Figure 22. Variable importance for Grade 8 random forests subsample 6: Students enrolled in non-Alliance Districts; Detailed special education-related predictors ... 81 Figure 23. Mosaic plot of support levels by chronic absentee status ... 90 Figure 24. Mosaic plot of support levels by suspensions ... 91 Figure 25. Correlation matrix for a subset of binary and continuous student-level variables for the full dataset. Values are color-coded on a continuum from green to red, with higher positive correlations in green, near-zero correlations in yellow, and higher negative correlations in red. ... 118 Figure 26. ROC Curve Comparison for models trained using undersampled training Sample 1161 Figure 27. Correlation and related plots for OnTrackFlag and SBAC scale scores for Sample 2 ... 162 Figure 28. Correlation matrix for Sample 2 ... 163
Chapter 1 Introduction
For decades, educational researchers have studied high school dropout in efforts to improve student outcomes, especially for students from low-income families, students of color, English learners (ELs), and students with disabilities (SWD) (e.g., DePaoli, Balfanz, Atwell, & Bridgeland, 2018; Ekstrom, Goertz, Pollack, & Rock, 1986; Rumberger, 2011). Although dropout rates have improved over that span, the national high school graduation rate is still below 85 percent, and researchers and policymakers have called the college and career readiness (CCR) of America’s high school students into question (DePaoli et al., 2018). While this issue has been at the center of educational research and reform efforts (e.g., Belfield, 2007; Belfield & Levin, 2007; Ferguson, 2007; Rebell, 2007; Rumberger, 2011), the relative lack of public
awareness of staggering dropout rates has prompted some experts to deem this problem a “silent epidemic” (Bridgeland, DiIulio, & Morison, 2006, p. 1). This study seeks to help policymakers target interventions in order to increase the number of students that are on-track to graduate from high school. Specifically, the purpose of this study is to evaluate different statistical and machine learning methods when used for predicting high school “on-track” status, and to improve early warning systems (EWSs) that use education data to systematically predict and improve student outcomes. Additionally, variable importance measures are presented to highlight which
predictors are most important in forecasting which students will be on-track to graduate high school in four years.
High school dropout is a complex issue. Rumberger (2011) describes dropout as a process and problem with four dimensions: nature, consequences, causes, and solutions. With more than 7,000 American students dropping out of high school each day (Rumberger, 2011),
the dropout crisis comes with great economic and social costs (Belfield & Levin, 2007). DePaoli, Balfanz, and Bridgeland (2016) declared:
Graduating high school is a critical life step…To reverse the downward trajectory that so many students who drop out find themselves on, we must…do whatever it takes to ensure students are earning a high-quality diploma…The health of our democracy depends on it. (p. 49)
Due to the gravity of the high school dropout issue, several studies have explored
predictive factors from elementary school through early high school to identify students who are at-risk of dropping out (e.g., Allensworth & Easton, 2005, 2007; DePaoli et al., 2016; Ekstrom et al., 1986). Researchers have found that the ABCs (attendance, behavior, and course
performance/credit accrual) are most predictive of high school dropout (Allensworth, 2013; Mac Iver & Messel, 2013). Studies have also shown that standardized test scores are predictive of other student outcomes of interest, but there is an on-going debate about the merits and
drawbacks of large-scale testing (Phelps, 2017). Furthermore, researchers have concluded that stressful life events trigger dropout, and these stressors include housing, money, criminal or legal issues, accidents or health problems, suspensions, pregnancy, and personal relationships (Dupéré et al., 2018). Armed with these findings, educators and policymakers have looked to target student interventions and support via EWSs.
Schools and districts have implemented many interventions to raise the high school graduation rate. Levin and Belfield (2007) have concluded that improvements can result from fine-tuning factors from kindergarten through 12th grade, including academic expectations, school and class sizes, personalization, counseling, parental engagement, instructional time, and personnel. Additionally, researchers have found that there is a correlation between school climate and graduation rates (e.g., Boyd, 2016; Freeman et al., 2015). Navigating the vast array of
intervention options is challenging, since a one-size-fits-all solution to the dropout problem does not exist.
Legislative and executive branch policy action aims to improve graduation outcomes. However, developers of early warning systems related to student outcomes use only a fraction of the sophistication available in the form of analytic forecasting models. This study is filling a practical void in the education marketplace to support the development of more sophisticated predictive models. This will be usable by researchers as an approach to ensure future EWSs work optimally. It is also an opportunity for practitioners to leverage new knowledge about students who are at-risk, and to test interventions at many levels (e.g., student, teacher, class, school, and district) in an attempt to improve graduation outcomes.
The University of Chicago Consortium on School Research (CCSR) made considerable efforts to study the transition into high school and its relationship with high school success (e.g., Allensworth & Easton, 2005, 2007). The CCSR concluded that a 9th grade on-track indicator combining information on credits and grades earned during freshman year is a stronger predictor of high school graduation than standardized tests. Following the CCSR’s lead, the Connecticut State Department of Education (CSDE) adopted the On-track in 9th grade indicator as a central component of its “Next Generation” Accountability System (CSDE, 2016, 2017, 2018). Table 1 summarizes the criteria for the On-track in 9th grade indicator.
Table 1
Criteria for On-track in 9th grade indicator
Number of semester F’s in core courses (1 semester course = 0.5 credit)
Number of credits accumulated during freshman year (1 full-year course = 1 credit) Less than 5.0 5.0 or more 2 or more Off-track Off-track
0 to 1 Off-track On-track
Note. Students who fail one full year (i.e., two semesters) of a core course and/or earn less than five total credits during 9th grade are deemed off-track. English, mathematics, science,
Predictive modeling is a core component of EWS development. Educational researchers have used student data to develop predictive models to identify students at risk of a host of troublesome outcomes, including dropping out (e.g., Allensworth, 2013). The current study used random forests, classification and regression tree (CART, or decision tree), and regularized (also known as penalized) logistic regression models to estimate predicted probabilities of being on-track to graduate; the students with the lowest probabilities were deemed most at-risk.
Previous studies have compared logistic regression with various machine learning techniques to solve prediction problems. The current study takes a novel approach by also applying regularized logistic regression techniques including ridge, lasso, and elastic net. These techniques provide protection against overfitting and are noteworthy for their ability to choose the best subset of predictors. Additionally, special education-related predictors including primary disability, hours of special education services, and percentage of school time with non-disabled peers (TWNDP) were incorporated into this study’s models; this extended the typical approach of using one binary special education flag (i.e., a 0-1 field that indicates whether a student receives special education services) as a predictor. Using longitudinal data for a state-wide cohort of students, this study evaluated these methods and presents findings to improve early warning systems by better identifying those students in need of targeted support and informing on-the-ground practitioners who may intervene long before students may be dropping out.
Recent changes in graduation requirements (Connecticut General Assembly, 2017), as well as Connecticut’s adoption of Next Generation Science Standards (NGSS), Smarter Balanced Assessment Consortium (SBAC) mathematics and English language arts (ELA) assessments, and the “Next Generation” Accountability System (CSDE, 2016, 2017, 2018), have created unique opportunities to develop and compare prediction models that incorporate new and relevant data.
Consequently, the sample in this study was drawn from the cohort of Connecticut public school students who were in grade 9 in 2016-17. This is the first student cohort for which the CSDE data warehouse contains the requisite data to train a prediction model that integrates course-, school- and district-level data and standardized assessments with other student-level variables to predict a high school outcome. Specifically, the data warehouse contains values for the On-Track in 9th Grade indicator and the following middle school data: course performance in grades 7 and 8; SBAC test scores in mathematics and English language arts (ELA) in grades 7 and 8; and school and district indices such as enrollment, percentage of minority students, percentage of students with high needs, percentage of students from low-income families, percentage of highly qualified teachers (HQT), chronic absence rate, promotion rate, and graduation rate. Integrating this predictive information with attendance, behavior, mobility, special education, and
demographic data dating back to grade 5 created a pool of over 100 predictors for each model to consider in predicting probabilities of being on-track to graduate.1
In Part 1 of the current study, ridge logistic regression, lasso logistic regression, elastic net logistic regression, classification and regression tree (CART), and random forests models were developed and tested for students entering 8th grade. Grade-level-specific predictors were limited to those from previous grades (i.e., data through the end of 7th grade was used to predict whether students entering 8th grade would make sufficient progress by the end of 9th grade to be on-track to graduate high school within four years). Additionally, the missingness of SBAC scale scores was treated as a predictor: Missing SBAC score values were imputed, a flag was retained to indicate whether each SBAC scale score was actual or imputed, and all of these SBAC
1 The On-Track in 9th Grade indicator was used as the outcome variable in this study; no grade 9 fields were used as
variables were included as covariates when training the models. This approach increased the number of student records on which the models were trained; more important, it has the potential to increase the number of students for whom the prediction models can be applied. Since
students with disabilities, students of color, and English learners are disproportionately
represented among those with missing scores, imputing SBAC values was a critically important technique to ensure the maximum possible number of records were retained for these important student groups.
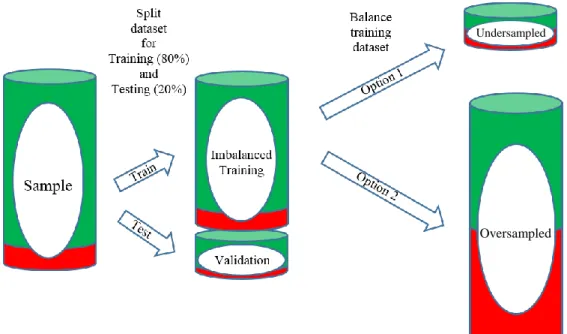
To address class imbalance in the outcome variable (i.e., more than 85 percent of students are on-track), models were developed using imbalanced and balanced training samples and the classification accuracy of prediction models was tested at different thresholds (also known as cut-offs or cut-points). Balanced training sets were created using undersampling and
oversampling techniques. In the undersampled training sets, all off-track records were retained and a random sample of cases was selected without replacement from the on-track (i.e., majority) class to perfectly balance the number of on-track and off-track records. In the oversampled training sets, all on-track records were retained and a bootstrap sample of cases was created with replacement from the track (i.e., minority) class to balance the number of on-track and off-track records.
In the social sciences, classification algorithms are often used with a single, default threshold to determine class membership. In contrast, this study examined classification accuracy across the full range of cut-offs to optimize results. Details regarding the data sample, model development and variable selection are presented in Chapter 3. Classification accuracy measures and associated data visualization techniques were used to compare and evaluate models. The random forests models developed with a training set balanced via oversampling produced the
best results. In addition, variable importance (also known as feature importance) was determined and a ranked list of features was created to compare variable importance across models and modeling approaches. All results pertaining to these topics are presented in Chapter 4.
Once the optimal data-handling and modeling approach was determined in Part 1, these methods were used in Part 2 to develop additional models so that further comparisons could be made. First, eighth grade data was added in the longitudinal training dataset to assess the impact of including an extra year of data (i.e., 5th through 8th grade instead of 5th through 7th grade) in predicting the On-track in 9th grade indicator. Since earlier predictions are more useful (i.e., they give the educational system more time to intervene to alter student outcomes), comparing the accuracy of predictions made after 7th grade to those made after 8th grade is of great policy relevance. Next, “snapshot” models were developed to assess the impact of different student-level variable combinations and training datasets using only one time point. Since students of color, students with disabilities, and English learners are the student groups that most often have incomplete records, a model fit to a single-year dataset invites a more equitable sampling of student records and requires fewer imputed values. In all cases, classification accuracy measures and variable importance results are presented to allow for a contextual analysis and comparison with models developed with different data constraints.
The purpose of developing a model with 5th through 8th grade data to predict the On-track in 9th grade indicator is to assess the impact of including an additional year of data in the
longitudinal dataset. Most important, this allows for the comparison of classification accuracy and variable importance measures when making predictions at the start of 8th grade versus the start of 9th grade.
The main purpose behind developing the snapshot models is to be more inclusive: Limiting time-related predictors to include only one year of data reduces the number of
covariates but allows these models to be trained using a larger sample of records and applied for more students (especially students of color, students with disabilities, and English learners), since many students do not have data in earlier grades for a variety of reasons (e.g., they recently moved to Connecticut and/or the charter school they attended is relatively new and
school/district indices are not yet available). While the longitudinal model handles missing SBAC scores through imputation, students without multiple years of attendance data and records without detailed school and/or district data are excluded from the analysis. The snapshot models reduce this restriction by only requiring 7th grade attendance. In place of school and district indices, which proved to be further restrictive, the snapshot models include a flag to indicate whether the student was enrolled in an Alliance District (i.e., one of Connecticut’s lowest-performing districts) in 7th grade. Regarding the Alliance District designation,
the education commissioner measures school districts’ performance using their score on the state’s accountability index which [uses a broad set of 12 indicators of district and school performance that incorporates student growth over time and allows for
comparison using] a single score….[Connecticut law] requires the commissioner to designate the 30 districts with the lowest index scores, plus keep on the list the three districts that were among the 30 lowest when the program started. (Moran, 2017, p. 1) This is of great practical importance, since students with disabilities and students from low-performing districts—the student groups who are central to the comparisons involved in the second and third purposes of the snapshot models—are disproportionately excluded from the longitudinal models.
The second purpose of the snapshot models is to compare models using different variable combinations and assess the impact of including detailed special education data instead of a
binary flag as the lone special education-related covariate. To achieve this, models were developed using two different combinations of predictor variables from the snapshot:
1. All predictorsincludingdetailed special education data;
2. All predictorsexcludingdetailed special education data (i.e., including only a special education flag to indicate whether a student received special education services) The third purpose of the snapshot models is to run separate models using training data from distinct student groups and answer the question: What is the impact on variable importance and classification accuracy when models are trained using records from only one student group?
To answer that question, two training sets were created using a student-level variable to separate records, and two additional training sets were created using a district-level variable to separate records. The special education flag (i.e., the binary field that indicates whether a student received special education services) was selected as the student-level variable; one training dataset was created with only records for students with disabilities (SWD), and a second training dataset was created with records for students without identified disabilities. The variable comparisons
mentioned in the second purpose were done across both datasets created based on the SWD flag. This comparison helped to determine whether, for students with disabilities, having more
detailed special education information helps predict being on-track.
For the district-level variable, the flag that indicates whether a school district is an Alliance District was selected; one training dataset contained records for only those students enrolled in Alliance Districts in 7th grade, and a second training dataset was created with records
from students who were not enrolled in one of Connecticut’s lowest-performing districts. The findings related to the snapshot models could be of particular interest to districts and states as they consider including detailed special education fields in their EWSs. In addition, the snapshot models could be especially helpful for deciding where to allocate resources and target
services. Lastly, the findings from the single-group models could provide additional guidance to those developing EWSs for populations involving disparate student groups. The study presents details regarding the data sample, model development and variable selection for the snapshot models in Chapter 3.
The five research questions this study sought to answer are:
1. Which methodology does the best job of identifying which students are at risk for not being on-track to graduate?
2. Which variables predict being on-track to graduate?
3. What are the missing data and classification accuracy impacts of including multiple years of covariate data versus a single year?
4. What is the impact on classification accuracy of including detailed special education-related predictors?
5. What is the impact on variable importance and classification accuracy when models are trained using records from only one student group?
Additional details regarding the research questions are presented in Chapter 3. The results are presented in Chapter 4 and the major findings, implications, limitations and future research are discussed in Chapter 5.
Chapter 2 Literature Review
The current study seeks to evaluate different statistical and machine learning methods to improve early warnings systems by better identifying those students in need of targeted support. In this chapter, previous studies that have particular relevance to high school dropout and/or early warning systems are highlighted, as well as the data-handling and modeling approaches applied therein.
2.1 High School Graduation Rates in the United States
Since 2009, researchers from Civic Enterprises and the Everyone Graduates Center at the School of Education at Johns Hopkins University have co-authored an annual report on the progress made and challenges faced in meeting a lofty national goal: 90 percent high school graduation rate by 2020 (Balfanz, Bridgeland, Bruce, & Fox, 2012a, 2012b, 2013; Balfanz, Bridgeland, Fox, & Moore, 2011; Balfanz, Bridgeland, et al., 2014; Balfanz, Bridgeland, Moore, & Fox, 2010; Balfanz, Fox, Bridgeland, & McNaught, 2009; DePaoli et al., 2016; DePaoli, Balfanz, Atwell, & Bridgeland, 2018; DePaoli, Balfanz, Bridgeland, Atwell, & Ingram, 2017; DePaoli et al., 2015). In their initial report, the authors reported troubling findings: the national graduation rate was between 68 and 75 percent, one-third of all public high school students and one-half of minority students did not graduate with their class, and “only 16 states [were] reporting graduation rates using accurate methods” (Balfanz et al., 2009, p. 18). The authors maintained an optimistic outlook by presenting their report as a research-based guidance tool: They encouraged readers to understand the issues, rally their communities, develop an effective plan, build partnerships, and take action.
published their initial report. By 2013, nearly all states reported a four-year adjusted cohort graduation rate (ACGR, a measure which uses detailed student-level data to determine the percentage of students who graduate within four years of beginning 9th grade) and the national high school graduation rate increased to 81.4 percent (DePaoli et al., 2015). In 2016, all states reported ACGRs, two states reached the 90 percent graduation rate goal, 25 other states reported a rate above 85 percent, and the national high school graduation rate reached a record high of 84.1 percent (DePaoli et al., 2018). Unfortunately, projecting this growth through end of the decade indicates that the United States is not likely to meet the 90 percent goal by 2020.
2.1.1Graduation rates for special populations. Although some states and districts have
shown incredible progress, there are still low-performing schools and disparities in graduation rates for students of color (76.4% for Black students and 79.3% for Hispanic students, compared with 88.3% for white students in 2016) and special populations, including students with
disabilities (65.5%), students from low-income families (77.6%), and students with limited English proficiency (66.9%) (DePaoli et al., 2018).
In Chicago, researchers examined the graduation rates for students with disabilities and English learners (Gwynne, Lesnick, Hart, & Allensworth, 2009; Gwynne, Pareja, Ehrlich, & Allensworth, 2012). The authors not only found that there was a graduation rate disparity between the major categories (i.e., SWD and non-SWD, ELs and non-ELs), but graduation rates also varied greatly across SWD categories. The 2009 study followed the cohort of students who were freshmen in 2001. Among all Chicago Public Schools (CPS) ninth graders at the time, 19.9 percent received special education services, and 67.8 percent of SWD were identified as having learning disabilities (Gwynne et al., 2009). The three other SWD categories with the largest representation were students with mild cognitive disabilities, students with emotional
disturbances, and students with speech/language disabilities. The authors specified two additional groups: (1) students who did not receive special education services but were two or more years below grade level when they entered high school; and (2) students with
physical/sensory disabilities, including students who have hearing, visual or other health impairments (Gwynne et al., 2009, p. 8). Table 2 summarizes the four-year and five-year graduation rates for these student groups, and shows that four-year graduation rates were below 50 percent for four of the six student groups: students two or more years below grade level in grade 9, students with learning disabilities, students with mild cognitive disabilities, and students with emotional disturbances.
Table 2
Graduation rates in Chicago Public Schools for students with disabilities
Student group Four-Year Graduation Rate (%) Five-Year Graduation Rate (%) Students without Identified Disabilities 67.1 69.6 Two+ Years below Grade Level 45.5 49.0
Learning Disability 47.8 52.7
Mild Cognitive Disability 41.7 47.2
Emotional Disturbance 18.7 23.5
Speech/Language Disabilities 58.1 63.5 Physical/Sensory Disabilities 75.0 77.5 Note. Adapted from Table 2 (Gwynne et al., 2009, p. 13).
Malin, Bragg, and Hackmann (2017) expressed concern that if graduating from high school and college and career readiness are “not recognized as important for all students, the nation risks perpetuating inequities among student groups that may have a lasting detrimental impact on society” (p. 813). Wilkins and Bost (2016) acknowledged that implementing early warning systems and other interventions has increased graduation rates of SWD, but cautioned educational leaders to review data regularly, and revise and review school policies accordingly. Balfanz and Legters (2004) asserted the importance of targeting a relatively small number of
failing high schools:
High schools with weak promoting power are the engines driving the low national graduation rate for minority students…These high schools must be specifically targeted for reform…Transforming the nation’s dropout factories into high schools that prepare all their students for post-secondary schooling or training and successful adulthood should thus be an urgent national priority. (p. 23)
The Every Student Succeeds Act (ESSA) has marshalled in a “new environment of
accountability” in which federal funding to states requires evidence of improved outcomes for all students (Hanover Research, 2018, p. 6).
2.2 Costs of Dropping Out
The economic and social costs of dropping out of high school include higher
unemployment, lower wages, reduced tax contributions, increased demand for social services, increased crime, reduced political participation, reduced intergenerational mobility, and poorer levels of health (Belfield & Levin, 2007; Levin, 1972; Rouse, 2007). Bailey (2007) noted that “current gaps in educational attainment based on income, race, and ethnicity” (p. 92) make it difficult for the United States to compete in the global economy and meet the increasing need for highly skilled workers. Muennig (2007) concluded, “Each additional high school graduate represents a health-related gain to the government of at least $39,000 in discounted lifetime medical expenditures. Monetized gains in health and longevity amount to an additional
$183,000” (p. 125). Regarding a reduction in criminal activity, Moretti (2007) asserts, “A one-percent increase in the high school completion rate of all men ages 20–60 would save the United States as much as $1.4 billion per year in reduced costs from crime incurred by victims and by society at large” (p. 158). Waldfogel, Garfinkel, and Kelly (2007) explain the connection
between lack of education and reliance on the “three major programs of the safety-net portion of the welfare state—cash assistance, food assistance, and housing assistance” (p. 160). The authors
estimate that “the potential savings in public assistance costs that might be produced through improved education…ranges from $7.9 billion to $10.8 billion” (p. 173).
2.3 Early Warning Systems
Early warning systems employ models that depend on available data to predict everything from bioterrorism (Berkowitz, 2013) to landslides (Battistini et al., 2017). The key to any EWS is the intervention and/or support that follows the prediction. Early and accurate predictions have helped across a range of societal and medical problems, including: recidivism (Duwe & Kim, 2017); child maltreatment (Atabaki et al., 2013); Alzheimer’s disease (Casanova, Hsu, & Espeland, 2012); breast cancer (Edeki, 2012; Edeki & Pandya, 2012); intracranial pressure episodes in traumatic brain injury (Güiza et al., 2017); West Nile Virus (Eidson, Kramer, Hagiwara, Schmit, & Stone, 2001); and other disease outbreaks (Chen et al., 2005). In industry, business EWS models have led to improvements in semiconductor manufacturing (Hsu, Chien, & Chen, 2012). In communities worldwide, life-saving measures have been taken as the result of EWSs predicting coastal earthquakes (Cervone, Kafatos, Napoletani, & Singh, 2006) and global drought (Heim & Brewer, 2012). Support is at the heart of every early warning system.
Balfanz (2009, 2011, 2014, 2016) is a leader in the development and dissemination of EWS research in education. “Early warning and intervention systems provide the necessary means to unify, focus, and target efforts to improve attendance, behavior, and course
performance. Their fundamental purpose is to get the right intervention to the right student at the right time” (Balfanz, 2009, p. 10). Balfanz and his colleagues have written extensively about their findings, and they have highlighted the importance of students being engaged and being at school (e.g., Balfanz & Byrnes, 2012; Balfanz, Byrnes, & Fox, 2014; Balfanz, Herzog, & Mac
Iver, 2007; Bridgeland, DiIulio, & Balfanz, 2009; Bruce, Bridgeland, Fox, & Balfanz, 2011; Legters & Balfanz, 2010).
While she does not dispute that interventions must be on-time and on-target, Scala (2015) cautions educators and policymakers against making causal claims: “Early warning indicators are used only for prediction—they do not cause students to drop out. Rather, they should be
treated as symptoms of the dropout process that is in progress” (p. 8, emphasis in original). Since these symptoms exhibit themselves at different times, researchers have made efforts to study indicators and outcomes from pre-kindergarten to the end of the student life cycle. Some studies, such as Jenkins and O’Connor’s (2002) exploration of early identification and intervention for young children with reading/learning disabilities, focus on a specific population during the early years. Other studies and early warning systems, such as Alabama’s Graduation Tracking System (GTS) (Alabama Department of Education, 2013), look at students across the span from
kindergarten through grade 12. Additionally, applied researchers have conducted studies using smaller samples to predict post-secondary outcomes, including dropping out of nursing courses (Moseley & Mead, 2008) and dropping out of university in Taiwan (Lin, 2015) and Tennessee (Baghernejad, 2016).
Many researchers have conducted studies using large datasets at the city and state levels to develop EWSs to improve student outcomes. Early warning indicators in Baltimore City Schools (Baltimore Education Research Consortium [BERC], 2011), Denver Public Schools (Dolan & Perez-Oquendo, 2009), Milwaukee Public Schools (Carl, Richardson, Cheng, Kim, & Meyer, 2013; Meyer, Carl, & Cheng, 2010), and the School District of Philadelphia (SDP) (Balfanz et al., 2007; Crofton & Neild, 2018) extended the strong foundation laid by the University of Chicago Consortium on School Research (CCSR) (Allensworth, 2013;
Allensworth & Easton, 2001a, 2001b, 2005, 2007; Allensworth, Gwynne, Moore, & de la Torre, 2014a, 2014b, 2014c; Bryk, Sebring, Allensworth, Luppescu, & Easton, 2010; Roderick, 1993). There are on-going efforts to address high school dropout in high-poverty urban communities (Corrin, Sepanik, Rosen, & Shane, 2016; Gewertz, 2009a, 2009b). As of 2013, more than 30 state departments of education had early warning systems (Data Quality Campaign, 2013). The Every Student Succeeds Act (2015) expanded state responsibility over schools, and this
legislation is driving all states to develop EWSs and other accountability systems to support local education agencies (Civic Impulse, 2017). Frazelle and Nagel (2015) produced a guide that “summarizes what is known about early warning system implementation and describes how states, districts, and schools can draw on the research to inform their work locally” (p. i).
2.4 Predictive Factors
Since dropping out is a process that results in negative consequences for individuals and society (Rumberger & Lim, 2008), several studies have explored predictive factors from
elementary school through early high school to identify students who are at-risk of dropping out. Rumberger and his colleagues identified a host of factors that are predictive of dropout,
including student (demographics, achievement, attitudes, behaviors); family (parental education, family socioeconomic status [SES], family structure, parental employment, family size,
parenting practices, parenting expectations, sibling dropout); school (school composition, school size, resources, academic climate, disciplinary climate, teaching quality); and community
(unemployment rates) variables (Rumberger, 1983, 1987, 1995, 2011; Rumberger & Larson, 1998; Rumberger & Lim, 2008; Rumberger & Palardy, 2005; Rumberger & Thomas, 2000).
In a longitudinal study, Alexander, Entwisle, and Horsey (1997) tracked the educational progress of a sample of Baltimore students for nearly 14 years starting in first grade and
identified predictors of dropout involving family context measures, children’s personal
resources, and school experiences beyond traditional sociodemographic variables. The authors deemed dropout to be a “culmination of a long-term process of academic disengagement” (Alexander et al., 1997, p. 87). Twenty-five years earlier, Stroup and Robins (1972) conducted a study that focused on black males in St. Louis and determined that mobility, retention, truancy, early drinking activity, and parental social status were the elementary school factors most clearly associated with high school dropout. Other researchers have confirmed the relationship between mobility and dropout, particularly for students from low SES backgrounds (Suh, Suh, &
Houston, 2007) and students with emotional and behavioral disorders (Osher, Morrison, & Bailey, 2003).
Researchers have examined predictive factors beyond the ABCs (attendance, behavior, and course performance/credit accrual) and mobility with an eye toward intervention. Ekstrom et al. (1986) found that a student’s home environment has a “critical, although indirect, impact on the decision to leave school” (p. 67). In an earlier study of post-secondary outcomes, Astin (1975) concluded that strong family support is highly correlated with school persistence. Analyses of the commitment and involvement of students, parents, and educators have shown that there is a strong relationship between school engagement and student outcomes (Fredricks, Blumenfeld, & Paris, 2004). Fredricks and her colleagues reviewed current conceptualizations of engagement, and concluded that additional research on behavioral, emotional, and cognitive engagement could prove fruitful in developing refined interventions (Fredricks et al., 2004).
2.4.1The On-Track in 9th Grade Indicator. The CCSR made considerable efforts to study the transition into high school and its relationship with high school success (Allensworth, 2013; Allensworth & Easton, 2005, 2007; Allensworth et al., 2014a, 2014b, 2014c). The CCSR concluded that a 9th grade on-track indicator combining information on credits and grades earned
during freshman year is a stronger predictor of high school graduation than standardized tests. Specifically, a student is on-track at the end of 9th grade if s/he earns at least five full-year credits (10 semester credits) and no more than one semester failing grade in a core course (English, mathematics, science, or social studies) during her/his freshman year.
Allensworth and Easton (2005) explained that this relatively simple checklist system based on student grades and course-taking resulted from more than a decade of research. Moreover, it captured critical elements of the all-important transition to high school “to gauge whether students [have made] sufficient progress in their first year of high school to be on-track to graduate within four years” (Allensworth & Easton, 2005, p. 1). The on-track indicator is called a checklist or rule-based system because it sets the indicator value (i.e., on-track or off-track) after checking its criteria.
Among checklist-based systems, the On-track in 9th grade indicator is the “most accurate
and most usable dropout indicator” (Bowers et al., 2013, p. 95). Consequently, several large districts and states have added a CCSR-inspired 9th grade on-track indicator to their early warning and accountability systems, including Philadelphia, Connecticut, Illinois, Ohio, and Texas (Abbott & Fisher, 2012; Allensworth, 2013; Allensworth & Easton, 2005, 2007; CSDE, 2018; Crofton & Neild, 2018; Hartman, Wilkins, Gregory, Gould, & D’Souza, 2011; Norbury et al., 2012; Stuit et al., 2016). Similarly, the Strategic Data Project (2012) introduced its own Strategic Performance Indicators (SPIs) to “understand the extent to which students are able to
recover from being off track” (p. 1) in Albuquerque, Boston, Fort Worth, Los Angeles, and Philadelphia.
Early warning system development relies heavily on predictive modeling. Researchers have developed models to identify students at risk of problematic outcomes, including poor performance in reading (Koon & Petscher, 2015; Koon, Petscher, & Foorman, 2014), not graduating on time (Aguiar, 2015; Aguiar et al., 2015, Lakkaraju et al., 2015; Pharris-Ciurej, Hirschman, & Willhoft, 2012), and dropping out (Allensworth, 2013; Allensworth & Easton, 2005, 2007; BERC, 2011; Knowles, 2015; Knowles & White, 2015). Once EWSs identify at-risk students, educators can initiate interventions.
2.5 Interventions
Schools and districts have implemented many interventions to raise high school
graduation rates. One key finding is that school climate matters. In fact, researchers have found that there is a strong relationship between the implementation of school-wide positive behavior interventions and supports (SWPBIS) and increased graduation rates (Boyd, 2016; Freeman & Simonsen, 2015; Freeman et al., 2015). Moreover, “attending a high school with better
disciplinary order and stronger school attachment for the students is associated with a decreased likelihood of dropping out, above and beyond individual characteristics” (Kotok, Ikoma, & Bodovski, 2016, p. 569).
In Chicago, educational leaders have used the on-track indicator as the foundation for high school interventions. In 2009, the on-track rate was 64 percent for ninth graders in Chicago. That year, CPS started issuing monthly data reports for each high school to identify and assist freshmen at-risk of going off-track (Roderick, Kelley-Kemple, Johnson, & Beechum, 2014). By 2013, the on-track rate had increased to 82 percent (Roderick et al., 2014). Moreover,
“improvements in ninth grade on-track…were followed by a large increase in graduation rates” (Roderick et al., 2014, p. 4). The implementation of systems around the on-track indicator has improved outcomes throughout CPS.
Ekstrom et al. (1986) studied data from more than thirty thousand high school students to analyze the characteristics of the dropout population. To meet the needs of potential dropouts, the authors asserted:
Three major types of programs are needed [in secondary schools]: (1) programs to help pregnant teenagers remain in schools; (2) programs to help youth with economic needs combine work and education; and (3) programs directed toward students who perform poorly because they are dissatisfied with the school environment. (p. 67)
Levin and Belfield (2007) conducted a systematic program evaluation and singled out “the five interventions whose effectiveness is supported by research studies…two of the interventions take place in preschool, one takes place in elementary school, one takes place in high school, and one is implemented across the K–12 years” (p. 178). Table 3 summarizes these interventions.
Table 3
Interventions that Demonstrably Raise the High School Graduation Rate
Intervention Details
Extra high school graduates if intervention
is given to 100 students Perry Preschool
Program (PPP)
1.8 years of a center-based program for 2.5 hours per weekday, child:teacher ratio of 5:1; home visits; group meetings of parents.
19
First Things First (FTF)
Comprehensive school reform based on small learning communities with dedicated teachers, family advocates, and instructional improvement efforts.
16
Chicago Child-Parent Center program (CPC)
Center-based preschool program: parental involvement, outreach and health/nutrition services. Based in public schools.
11
Project STAR: class size reduction (CSR)
4 years of schooling (grades K–3) with class size reduced from 25 to 15.
11 Teacher salary
increase (TSI)
10 percent increase in teacher salaries for all years, K–12.
5
Beyond the five interventions that they verified via systemic evaluations, Levin and Belfield (2007) made a more general claim:
We see convergence of agreement on a common set of features that lead to increased high school graduation rates and educational success. These features are (1) small school size, (2) high levels of personalization, (3) high academic expectations, (4) strong
counseling, (5) parental engagement, (6) extended time school sessions, and (7) competent and appropriate personnel. (p. 181)
Prevatt and Kelly (2003) concluded, “There is no one particular best practice or beneficial treatment currently available to address the problem of school dropout even though a number of intervention programs appear to hold promise” (p. 377). Given the importance of prediction models for efforts to identify at-risk students via EWSs and inform practitioners who may
intervene, it is necessary to understand the approaches to statistical modeling that undergird these models.
2.6 Modeling Cultures and Approaches
Breiman (2001b) and Veltri (2017) have written about two cultures that exist in modeling: the data modeling culture, which “assumes that the data are generated by a given stochastic data model” (Breiman, 2001b, p. 199); and the algorithmic modeling culture, which seeks to “find an algorithm that operates on x to predict the responses y” (Veltri, 2017, p. 2).
Kuhn and Johnson (2013) suggest the following scheme for finalizing model type: “Start with several models that are least interpretable and most flexible, [then] investigate simpler
models…[and] consider using the simplest model that reasonably approximates the performance of the more complex methods” (p. 79). Hastie and his colleagues use the term statistical learning
to capture the process of extracting patterns and trends in the data and understanding the underlying data story (Hastie, Tibshirani, & Friedman, 2009; James, Witten, Hastie, & Tibshirani, 2013).
2.6.1 Logistic Regression. Early warning systems for high school dropout or being on-track to graduate include the prediction of a binary outcome from quantitative and categorical independent variables. When creating a model of this type, a logistic regression model is often used (Cizek & Fitzgerald, 1999; Hosmer, Lemeshow, & Sturdivant, 2013; Woods, 2013). In fact, “the use of logistic regression has become the method of choice for studying many issues in the social sciences with dichotomous outcomes” (Cizek & Fitzgerald, 1999, p. 239). This approach is “very popular due to its simplicity and ability to make inferential statements about model terms” (Kuhn & Johnson, 2013, p. 286).
The logistic regression model links the predictor variables to probabilities through the equation
𝑝 = 𝑓(𝛽0+ 𝛽1𝑥1+ 𝛽2𝑥2 + ⋯ + 𝛽𝑘𝑥𝑘 ) = 𝑒( 𝛽0+ 𝛽1𝑥1+ 𝛽2𝑥2+⋯ +𝛽𝑘𝑥𝑘 )
1 + 𝑒(𝛽0+ 𝛽1𝑥1+ 𝛽2𝑥2+⋯ +𝛽𝑘𝑥𝑘 ) (1) With 𝑝 representing the probability of success (or P(y = 1)) and 1 – 𝑝(sometimes
denoted as Q) representing the probability of failure, the quotient 𝑝/ (1 − 𝑝) is called the odds of success. The quantity log [𝑝 / (1 − 𝑝)] is referred to as the logit (logistic unit) of 𝑝 and represents the log odds of success. The equation for the logit of 𝑝 is
log ( 𝑝
1 − 𝑝) = 𝛽0+ 𝛽1𝑥1+ 𝛽2𝑥2+ ⋯ + 𝛽𝑘𝑥𝑘 (2)
“The logistic regression model specifies a linear model for the log odds of success…[and] is the most popular model for a binary outcome variable” (Ledolter, 2013, p. 85).
2.6.1.1 Regularization methods. Unstable parameter estimates due to overfitting and
collinearity are concerns in logistic regression (Kuhn & Johnson, 2013). Overfitting occurs when the estimated model performs well with the original data, but poorly when applied to other datasets. Collinearity (or multicollinearity) occurs when two (or more) predictors are highly
correlated. Regularization methods address these concerns by adding a penalty to control
properties of the regression coefficients (Le Cessie & van Houwelingen, 1992; Tibshirani, 1996). The most popular regularization techniques are ridge, lasso, and elastic net (James et al., 2013). “Ridge regression is a continuous process that shrinks coefficients…[and] lasso, ‘for least absolute shrinkage and selection operator’…shrinks some coefficients and sets others to 0” (Tibshirani, 1996). Elastic net, developed by Zou and Hastie (2005) to improve on the ridge and lasso techniques, “simultaneously does automatic variable selection and continuous shrinkage, and it can select groups of correlated variables” (p. 302). Because these methods shrink regression coefficients, they are also known as shrinkage methods (Hastie et al., 2009). Ridge, lasso, and elastic net regression present “a proper way to get sparse models in those fields with large datasets…[and] high correlations” (Garcia-Magariños, Antoniadis, Cao, & González-Manteiga, 2010, p. 1).
Ridge regression. Hoerl and Kennard (1970) conceived ridge regression to solve a problem in linear regression solutions: estimates are sometimes too large in absolute value and occasionally have the wrong sign. “It has been demonstrated that when X'X [the correlation matrix of independent variables] has non-uniform eigenvalue spectrum, estimates of β in Y = Xβ+ε depending on the minimum residual sum of squares criterion may have high potential for being removed far from β” (Duzan & Shariff, 2015, p. 397). By adding a small ℓ2 penalty to each
diagonal element in the system, the authors improved the mean square error of estimation and highlighted troublesome intercorrelations among the predictors. The ridge regression solution has been extended to logistic regression models (e.g., Kibria, Månsson, & Shukur, 2012; Saleh & Kibria, 2013; Schaefer, Roi, & Wolfe, 1984). Asar, Arashi and Wu (2017) presented alternate notation to Equation (1) for the probability of success of 𝑦𝑖 in the logistic regression model
𝜋𝑖 = 𝑃𝑟(𝑦𝑖 = 1) = 𝑒𝑥𝑖′𝛽
1+ 𝑒𝑥𝑖′𝛽, i = 1, 2, …, n
(3)
with β = (β0, β1, . . . , βp)′ showing the unknown (p + 1)-vector of regression coefficients, and xi =
(1, x1i, x2i, . . . , xpi)′ presenting the ith row of X, the n × (p + 1) data matrix. Equation (3) uses
notation consistent with Schaefer et al. (1984), who defined the ridge estimator in the logistic regression model given by
𝛽̂(𝑘) = 𝐶𝑘−1𝑋′𝑊̂ 𝑍 (4)
where k > 0 is the biasing parameter; Z = (Z1, . . . , Zn)' , with Zi = log(𝜋̂i) +
𝑦𝑖−𝜋̂𝑖
𝜋̂𝑖(1−𝜋̂𝑖); 𝑊
̂ =
Diag(𝜋̂i(1− 𝜋̂i)); 𝜋̂ is an (n × 1) vector of 𝜋̂i = f(𝑥𝑖′, 𝛽̂); Ck = C + kIp such that Ip is the identity
matrix of order p, and 𝐶 = 𝑋′𝑊̂ 𝑍.
Lasso regression. Tibshirani (1996) drew on the work of Hoerl and Kennard (1970) and Breiman (1995) to consider other regularization options. He developed the lasso method to maintain the stability of ridge regression while producing more easily interpretable models by placing a different constraint that reduces some coefficients to zero. Like Hoerl and
Kennard (1970), Tibshirani developed his solution for linear regression models. Lasso regression applies an ℓ1 penalty to achieve a sparse solution. Researchers have demonstrated that the lasso
algorithm can be generalized to logistic regression models (e.g., Garcia-Magariños et al., 2010; Roth, 2004). Garcia-Magariños et al. (2010) presented the following related equations:
Minus the log-linear likelihood function is
𝐿(𝛽) = ∑ ln [1 + 𝑒−𝑦𝑖x𝑖′𝛽]
𝑛
𝑖=1
(5)
The lasso like logistic estimator 𝛽̂ with specific penalizations for each covariate is then given by the minimizer of the function