A NON-PLACEMENT AUTHENTIC SIMULATED
WORK INTEGRATED LEARNING PROJECT
FOR FINAL YEAR STUDENTS
Margaret Jollands
Presenting Author: Margaret Jollands ([email protected])
Science Health and Engineering Education Research (SHEER) Centre, RMIT University, Melbourne, Vic, 3000, Australia
KEYWORDS:
WIL, employability, journalABSTRACT
Work experience is generally considered to be the best way to develop employability, but currently there are too few work placements to meet demand of engineering undergraduates. Non-placement authentic work integrated learning (WIL) is an alternative but there is very little research to show if learning outcomes are equivalent to real work experience. This paper describes an innovative approach to WIL for final year chemical engineering undergraduates. The perceptions of students who have undertaken a work placement are compared with those who participated in an on-campus authentic simulated work placement.
The WIL module used a real project from a local STEM company, with rich complex resources. Students were co-supervised on their project work by the author and an engineer from the company. The students also participated in a series of bespoke workshops to develop critical employability skills. Initially the WIL students rated themselves significantly lower on a work readiness, but the deficit was overcome after completing the WIL module.
This paper suggests that a non-placement authentic simulated WIL project is as effective as work experience in increasing students’ confidence in their work readiness. Further, it discusses the impact of reflection on perceptions of work readiness of work experience students.
Proceedings of the Australian Conference on Science and Mathematics Education, The University of Queensland, Sept 28th to 30th, 2016, page 170-175, ISBN Number 978-0-9871834-5-3.
INTRODUCTION
Employability is a contested concept, but under a common definition it encompasses the discipline knowledge, skills and personal attributes that give an individual graduate the ability to gain or maintain work or employment (Hillage & Pollard, 1998). There is broad consensus that work experience in the discipline field (paid or unpaid) is the best way to develop employability (Orrell, 2011; Smith, Ferns, Russell and Cretchley, 2014). However, even though the Australian economy fared relatively well after the global financial crisis of 2008, provision of work placements has been insufficient for the one million students in Australian universities (Australian Education Network 2014, Australian Workforce and Productivity Agency, 2013). An alternative to work placement is to bring authentic projects into the classroom in the guise of WIL (Orrell, 2011) or providing access via online or blended methods (Herrington, Reeves and Oliver 2014). Non-placement WIL is an on-campus or online offering
designed to simulate a real work placement. On-campus WIL can also help students to integrate their learning in the different settings (Billet, 2010). However, there are few reports on the effectiveness of non-placement WIL compared to work experience.
There is no consensus on how to measure employability, or if indeed, it can be measured. In a recent major study on impact of WIL on work-readiness, Smith and co-workers developed a survey of students’ perceived sense of employability (Smith et al., 2014). The survey was developed to
distinguish the quality of work placements. Self-reporting tools tend to have self-interest bias, but this survey was validated by cross-checking with employer studies and alumni interviews. The study rated the quality of work placements, then compared outcomes with ‘simulated’ (non-placement) WIL. It was reported that above average placements were better than simulation, but lower than average placements were not (Smith et al., 2014; Ferns, Russell and Smith, 2015). One study has reported using this survey as a tool to assess work readiness of final year STEM students. Results were compared for one cohort who had undertaken a placement with another that undertook a
non-placement authentic simulated work non-placement (Jollands, 2015). Initially there was a significant gap in perceived work-readiness between the two cohorts, but after students completed the non-placement WIL module, there was no longer a gap.
At RMIT, final year chemical engineering students comprise two cohorts: those who have completed an engineering work placement, usually the summer preceding graduation, and those who have not. Students’ work experience is accredited against the requirements of Engineers Australia Competency 1 standards (Engineers Australia, n,d,g). A non-placement authentic WIL program was developed for the cohort of students who were unable to do an engineering work placement. Authentic learning opportunities use realistic activities to challenge learners to think like professionals working in a real-world context (Herrington, Reeves & Oliver, 2014).
This paper discusses the design of the non-placement WIL module for final year chemical engineering students and compares student learning outcomes from placement with non-placement WIL. The work readiness survey developed by Smith and coworkers (2014) is discussed as a tool to assess employability of students. Impact of an on-line reflective journal on work experience is also evaluated.
NATURE OF THE CURRICULUM INNOVATION
The curriculum innovation was development and evaluation of a WIL module based on a
non-placement authentic simulated work non-placement project. It is essential to design non-non-placement WIL in collaboration with employers to achieve a high quality learning experience (Smith et al., 2014). The author worked with a senior engineer from a local engineering company to choose a suitable basis for the module from their completed projects. The original project scope was modified to be challenging but achievable in 6 weeks. Scenarios were drawn up so that students could work in groups of five, as though they were part of the original project team. The original project had a large quantity of data in the form of photos, drawings, diagrams and schematics, and this was made available to the students. In addition to scoping the project, the student groups were jointly supervised and assessed by the author and a company engineer. The engineer met the students every fortnight for consultation and responded to emails in the interim. The assessments’ templates were modelled on the company’s reports and presentations to clients.
At the beginning and end of the module, the students completed a survey of their work readiness. The results for the two cohorts –placement and non-placement - were compared. The comparison
revealed deficits in the work-readiness of the students who had not completed a placement. The deficits included confidence, workplace performance standards and ability to seek opportunities for further learning to develop employability. The deficits provided the focus for a series of workshops designed, developed and facilitated by the author in 2015 (Jollands, 2015). In addition, the students wrote individual reflections on a fortnightly basis. Reflection has been identified as the key to learning from experience (Moore, 1999).
An enhancement introduced during the second year of running the program was that students on placement were required to write weekly reflections. Engagement during the placement between university supervisor and student is recommended to enhance the quality of learning (Eyler, 2001).
AIMS
The aims of the study were:
• to assess whether a non-placement authentic simulated WIL module could overcome the work readiness deficit in students who had failed to find a work placement;
• to assess the impact of writing reflections on the work readiness of students who participated in work placements.
IMPLEMENTATION
The WIL module was run in 2015 with 29 students, and in 2016 with 25 students. The number of students who had completed work placements was around 40 students in both years.
The project scope was to double the capacity of an existing fuel oil system at a remote plant in the north of Australia, used in both 2015 and 2016. The students had to use their fundamental chemical engineering knowledge to identify a feasible low cost design for the higher capacity system.
The work readiness survey was taken by all the final year students in the first week of semester. The WIL module students then repeated it in the final class of the last (12th) week of semester.
Workshops were run each week on various employability topics, such as applying for graduate positions, career planning, communication, team work, project planning, critical analysis, and are you work ready? The workshop on applying for graduate positions included a mock interview with industry
engineers. The workshop topics were chosen from the skills ranked most highly by Australian engineering employers (GCA 2015), or to address significant deficits identified by the work readiness survey.
All assessments were pass/fail hurdles. This approach was taken to reflect the common industry standard for communications, reports and presentations: it’s either good enough or not good enough. Attendance at project meetings and workshops was ‘required’ and monitored, as in a workplace: students who were absent were followed up by email.
EVALUATION METHODS
SURVEYThe survey measures students’ self-reported perceived sense of employability against a range of employability dimensions, based on the survey developed by Smith and coworkers (2014) to assess the quality of students’ placement experiences. The survey had 35 individual questions, grouped against six employability dimensions (Collaboration, Informed decision making, Commencement readiness, Lifelong Learning, Professional Practice & Standards, and Integration of theory & practice). Each question is evaluated against a 5 point Likert scale. More details of the survey are given
elsewhere (Smith et al., 2014, Appendix B).
A quasi-experimental pre-test and post-test design was used, as is common in education research (Dugard & Todman, 1995). Significant differences between the placement and non-placement cohorts were identified using a T test. The T test parameters were two tailed, unequal variance, type 3
(unmatched sample) for the placement versus non-placement cohorts. The pre- and post- results for matched non-placement participants were compared using one-tailed, equal variance, and type 1 (matched sample) parameters. The survey validity is acceptable as the participation rate was high (>50%), and the sample size was adequate (>15 is adequate if student perceptions are normally distributed about the mean).
OTHER QUANTITATIVE DATA
Every course at RMIT is surveyed every semester, administered by a central university group. Many courses have a teaching team, so students are asked to fill out the same survey for each staff
member. The course described in this study has a teaching team of around 14 staff members. Survey fatigue is evident in the very low participation rates in these surveys (6% In 2015; 2016 data not available yet), hence the limited data are not reliable.
Employment outcome data will be collected when available: unfortunately, there is a significant time lag between graduation and publication of employment outcomes data (~ 18 months). It is expected that the employment outcomes will increase relative to national trends for the discipline. Data from the national Graduate Destination Survey, administered by Graduate Careers Australia, show that RMIT chemical engineering graduates have employment outcomes generally well below national average for the decade 2005 - 2014.
RESULTS AND DISCUSSION
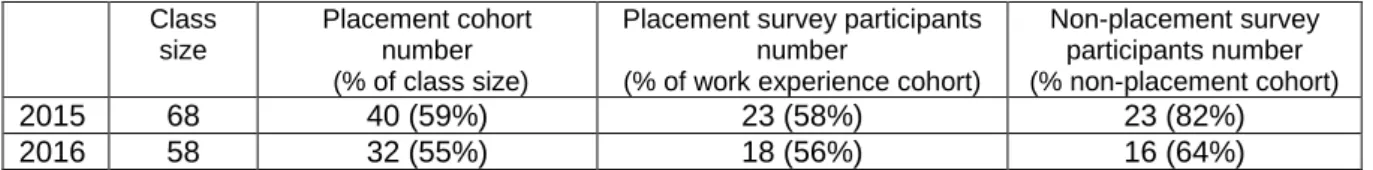
DEMOGRAPHICSThe number of students enrolled in the final year course PROC2114 Research project was 68 in 2015 and 58 in 2016. Of the total number enrolled in the course, 55 to 60% completed engineering work placements. Around 60% of the placement cohort, and around 70% of the non-placement cohort, completed the work readiness survey.
Table 1: Survey Participant data Class size Placement cohort number (% of class size)
Placement survey participants number
(% of work experience cohort)
Non-placement survey participants number (% non-placement cohort) 2015 68 40 (59%) 23 (58%) 23 (82%) 2016 58 32 (55%) 18 (56%) 16 (64%) SURVEY OUTCOMES Broad outcomes
Overall, pleasingly, there was a significant increase in the self-reported perceptions of employability of the non-placement cohort. Comparing “pre” and “post” non-placement participant ratings, there was a significant increase in the average skills rating (2015: Δμ=0.07, p = 0.05; 2016: Δμ=0.16, p=0.00). This confidence in their ability to look for suitable roles, be successful in obtaining work, and to contribute positively in the workplace, is the ideal initial outcome of the WIL program.
The outcomes for the non-placement participants were equally good in the two consecutive years the course has been offered. The non-placement participants average ratings of their skills “post” the WIL
module were not significantly different (Δμ=0.02, p=0.59).
The gap in self-reported work readiness between the non-placement and placement participants was overcome. In 2015 the non-placement participants rated themselves equally highly as the work
experience participants after the WIL module (2015: μ=4.08, p=0.99). In 2016 the non-placement
participants even rated themselves significantly higher (2016 μ=4.06, p=0.04) than the placement participants (2016: μ=3.95). This was attributed to the 2015 placement cohort rating themselves
significantly higher than the 2016 placement cohort. This interesting change will be discussed in more detail below.
Individual outcomes
Looking at individual questions, the non-placement participants rated themselves lower than the placement participants in their ability to find work and improve their workplace skills, attributed to the lack of success for students who had struggled and failed to find placements. In 2015 the differences between non-placement and placement participants was significant (p<0.05), less so in 2016 (p<0.5):
• Overall I am confident I am work ready (2015: Δμ=0.70, p=0.04; 2016, Δμ=0.29, p= 0.39)
• I am able to obtain work relevant to studies (2015: Δμ=1.17,p=0.00; 2016: Δμ=0.49, p=0.17)
• I seek out opportunities for further learning to develop my workplace or professional skills and/or
knowledge (2015; Δμ=0.57, p=0.04; 2016; Δμ=0.50, p=0.13)
The 2016 non-placement participants rated themselves significantly lower than 2016 placement participants on the more nuanced question:
• I judge the applicability of the knowledge gained in my studies to the workplace (2015:
Δμ=0.22, p=0.31; 2016: Δμ=0.59, p=0.02)
The non-placement cohort had much higher confidence in their work readiness after completing the WIL module. There was no longer a significant deficit in the rating of placement and non-placement participants to the question “Overall I am confident I am work ready”:
• Placement (2015: μ=3.83; 2016, μ=3.37)
• Non-placement “post” (2015: μ=3.74, p=0.77; 2016, μ=3.79, p=0.47)
Interestingly, in both years, both “pre” and “post”, non-placement participants rated themselves significantly higher in ethics compared to placement participants:
• I develop a personal code of values and ethics (2015: “pre”, p=0.01; “post”, p=0.03; 2016: “pre”, p=0.03, “post”, p=0.00)
This unexpected result will be explored further in future studies. It may be that students’ personal ethics is challenged and possibly undermined by the realities of ethics in the workplace, hence the lower rating by placement participants on this skill.
Overall, the data strongly suggests that student confidence in their work-ready skills is enhanced after undertaking this WIL module.
Outcomes for work experience students in successive years
Students undertaking engineering work placements in the summer of 2015-2016 were required to complete a logbook, that comprised a weekly reflection on a work issue. The reflection was emailed to their university supervisor, who responded with comments. The supervisor commented on the quality of their reflection as well as the substance. If the student was unable to identify a suitable strategy to deal with their issue, the supervisor suggested one or two. The supervisor (the author) has been identified in personal leadership 360º surveys as an excellent coach. A number of the placement students spontaneously acknowledged that the feedback was helpful, that they tried the strategies, and were successful.
It was expected that the 2016 work experience cohort would rate themselves higher on work readiness, after spending a summer being coached by the author. However, they rated themselves
significantly lower than the 2015 work experience cohort (2015: μ=4.08; 2016: μ=3.95, p=0.00). Two
perceived abilities were rated significantly lower in 2016 than 2015:
• I appraise the quality of information I obtain e.g. from the web, from books or from other
people (2015: μ=4.13; 2016: μ=3.50, p=0.00)
• I recognize ethical practice in the workplace (2015: μ=4.61; 2016: μ=3.89, p=0.00)
This unexpected result will be explored further in future studies. It may be that students’ who are coached in the workplace have a more realistic, hence lower, estimate of their abilities. Smith and coworkers (2014) reported that students who had not completed a placement tended to over-estimate their abilities. It is possible that students who are coached when they are new to the workplace may learn faster to accurately estimate their (lesser) abilities than if they are not mentored or coached. Hence in addition to data from work readiness surveys, data from a variety of sources (such as employment outcomes) are needed to conclude with confidence if this WIL (or any) module is a success.
CONCLUSIONS
An authentic non-placement simulated WIL module can enhance the confidence of non-placement students in their work readiness. The students’ perceptions of their work readiness (employability) can be assessed with a survey instrument. The survey can be used to identify work ready skill deficits, then workshops can be run to help students develop these skills. Undertaking an authentic simulated work placement project, designed and co-supervisored by industry engineers, enhanced
non-placement students’ perceptions of work readiness to a level equivalent to students who had work experience placements.
In addition to self-reported perceptions of work readiness, other data are needed to conclude if WIL modules are successful in enhancing students’ employability. Unfortunately there is a considerable lag in collecting employment outcome data, so in the interim other data must be collected and used to gauge success of WIL innovations and identify areas for improvement.
REFERENCES
Australian Education Network. (2014). Student numbers at Australian universities.. Retrieved from http://www.australianuniversities.com.au/directory/student-numbers/
Australian Workforce and Productivity Agency. (2013). Future focus: 2013 National Workforce Development Strategy,. Retrieved from http://www.awpa.gov.au/our-work/Workforce%20development/national-workforce-development-strategy/Pages/default.aspx
Billet, S. (2011). Curriculum and pedagogical bases for effectively integrating practice-based experiences. Strawberry Hills, NSW: Australian Learning and Teaching Council.
Dugard, P & Todman, J. (1995). Analysis of pre‐test‐post‐test control group designs in educational research. Educational Psychology, 15(2), 181–198.
Eyler, J. (2001). Creating your reflection map. New directions for higher education, 114, 35-43. Engineers Australia (n.d.g.) Stage 1 competency standards for professional engineers. Retrieved from
https://www.engineersaustralia.org.au/
Ferns, S, Russell, L & Smith, C. (2015). Designing work integrated learning to optimise student employment readiness. In T. Thomas, E. Levin, P. Dawson, K. Fraser & R. Hadgraft (Eds.) Proceedings of the Higher Education Research and Development Society of Australia Conference, Hammondville NSW:HERDSA.
GCA. (2015). Graduate Outlook 2014: The Report of the Graduate Outlook Survey: Employers’ Perspectives on Graduate Recruitment. Melbourne, Vic: Graduate Careers Australia.
Herrington, J, Reeves, T & Oliver, R. (2014) ‘Authentic learning environments’, in J. M. Spector, M. D. Merrill, J. Elen, M. & J. Bishop (Eds.), Handbook of research on educational communications and technology, (4th ed., pp. 401–412), New York, NY: Springer.
Hillage, J & Pollard, E. (1998) Employability: developing a framework for policy analysis. Suffolk: Department for Education and Employment.
Jollands, M. (2015). Effectiveness of placement and non-placement work integrated learning in developing students' perceived sense of employability. In A.Oo, A.Patel, T.Hilditch & S.Chandran (Eds.) Proceedings of the 26th Annual International Conference of the Australasian Association of Engineering Education, AAEE2015, Geelong, Vic: School of Engineering, Deakin University.
Moore, D.T. (1999). Behind the Wizard’s Curtain: A Challenge to the True Believer. NSEE Quarterly, 25, 23–27. Oliver, B. (2011). Assuring Graduate Outcomes, Strawberry Hills, NSW: Australian Learning and Teaching Council. Orrell, J. (2011). Good practice report: work integrated learning. Strawberry Hills, NSW: Australian Learning and Teaching
Council.
Smith, C, Ferns, S, Russell, L & Cretchley, P. (2014). The impact of work integrated learning on student work-readiness. Strawberry Hills, NSW: Office for Learning and Teaching.
Sipser, M. (2012) Introduction to the theory of computation. Cengage Learning.