Quality of Service Predictions Service: QoS Support for
Proactive Mobile Applications and Services
1Katarzyna Wac, Melanie Hilario, Bert-Jan van Beijnum, Richard Bults, Dimitri Konstantas
Abstract. Emerging mobile applications rely their delivery on the serviceability of the underlying wireless networks. However, this serviceability, expressed in terms of quality of service (QoS) provided by a network available to a service user at a given geographical location and time, is a priori unknown. In turn, it influences the application-level QoS provided to a mobile service user. As a solution we research the QoS-predictions service, providing predictions for QoS of networks available at a given user’s geographical location and time. In a case study we prove the feasibility of deriving predictions from historical data collected by a mobile service user. This mobile user is a patient, using his health telemonitoring service in his daily environments for a period of one month. We consider the QoS-predictions service as a novel support for mobile services operational in 4G heterogeneous network environments..
1 Introduction
The emergence of new wireless broadband networks and diverse miniaturized and personalized networked multimedia devices has given a rise to a variety of new interactive mobile applications and services [25]. These new services allow the mobile users to not only access information anywhere-anytime-anyhow, but also are able to adapt their functionality based on different context information. This information can range from user-related context, like the user profile, role and activity and his geographical location and time, to device-related context, like available network interfaces or screen size and resolution, and up to the network-related context, like network signal strength and its current load. By having access to rich context information, these mobile applications are able to adapt themselves and increase the quality of the user‘s experience (defined as QoE by [33]. Although user and device related context information is to a great extend available to the applications, network related context information, i.e., its quality of service (QoS by [30, 35]) provisions, is only roughly and approximately available [12].
Current trends are that mobile applications become highly interactive, and their user become highly mobile, using different underlying networks as available in his environment [48]. Hence, the success of application delivery depends upon QoS provided by these underlying networks, which tend to be highly heterogeneous [12]. In this situation, we consider that one of the most critical elements contributing to an improvement of the functionality of mobile applications and services is precise information about the QoS provided by these underlying
1
A revised version of this work is published as a book chapter in Wireless Network Traffic and Quality of Service Support: Trends and Standards, Lagkas, T., Angelidis, P. and Georgiadis, L. (Eds.), IGI Global Publisher
networks. This information can be used for the application’s QoS management and assurance of user satisfaction.
Today’s wireless network operators provide coarse-grained, marketing-based, static QoS information about their networks (e.g. network nominal capacity), refusing to give to mobile users any detailed information, mainly due to marketing reasons [22]. As a result, mobile applications base their QoS management and adaptation on best-case scenarios for networks’ QoS, as derived from the network’s nominal capacity. Moreover, some mobile applications are using the signal strength to estimate the networks QoS; still this does not provide any information on, e.g. actual network congestion. Taking into consideration that the mobile users are by definition moving in space and time, the task of managing of QoS by figuring out and trying to anticipate the QoS of the underlying wireless network on a continuous basis becomes impossible, leading to worst case scenario assumptions and lowering the QoE of the user provided applications and services.
On the other hand, mobile users are no longer passive information and content consumers but are now able (and willing) to create themselves new geo-referenced information and content and make it available to other mobile users. Many mobile collaborative applications (i.e. so-called mobile web 2.0 applications [38, 47] are available on the market today allowing mobile users to exchange geo-information like points of interest, virtual geo-tags or geographical locations of traffic radars and so on [69]. Based on the need of the emerging applications to have access to a high quality fine-grained QoS information, and on the ability of the users to create and share geo-referenced information, we conclude that nowadays it is possible for mobile users to create and share any QoS information in a fully collaborative way, and particularly information regarding fine-grained QoS provided by wireless networks at given geographical locations and times, as observed when using particular application. This information can be further used for predicting the QoS, which in turn could be used by demanding mobile applications to choose most suitable network and adapt themselves to provide services to the users on a higher QoE level. As for precise geographical location-determination techniques, many of them are currently available, and even more are emerging [27].
Towards this direction, we research on a platform for a QoS-predictions service, which, based on Mobile Web 2.0 paradigm, supports collection of reliable, user- and application-transparent information about networks’ provided QoS, and based on this information, the service provides QoS-predictions back to mobile users. Particularly, this information is collected from devices of mobile users and it is stored in the form of a geo-spatial information grid; for different geographical locations, times and for different networks. Based on these collected historical data and with the use of machine learning algorithms, we are able to predict the anticipated QoS at a certain geographical location and time, for a given network.
In this chapter we present a case study of QoS-predictions feasibility assessment as derived from historical data collected from a MobiHealth [63] system service user, i.e., a patient, using his health telemonitoring service in his daily environments, along one month. We consider the QoS-predictions service as a novel support for mobile service users in wireless heterogeneous networks and in particular in 4G environments.
2 Related Work Areas
2.1 Quality of Service Management
Internet was since its beginning, providing a ‘best-effort’ QoS level. In the late 90’s, first solutions for QoS provisions of Internet-based service providers have been proposed, particularly for providers of real-time multimedia services [28, 56]. From the technical perspective, these solutions were based on use of rigorous and complex QoS management frameworks, including functions like QoS negotiation and resource reservation [3, 72]. In this situation, many service providers ignored the proposed solutions and learned to manage ‘best-effort’ QoS level provided by Internet to assure meeting the QoS requirements (and the expected QoE) of their service users. They particularly relied on estimations of QoS provided by the Internet. This approach was feasible due to at least two factors: firstly, QoS provided by Internet exhibits regularities and long-term estimations for e.g. months can be derived relatively accurately [13]. Secondly, if necessary, service providers could easily acquire information on provided QoS via dedicated QoS measurements and all that without any degradation in the quality of the provided services [40].
With the dawn of the mobile era, history is repeating itself. Provisions of QoS by mobile service providers have been identified as critical to the business viability of mobile service providers already in the late 90’s [12], when only basic voice and data services existed. The most critical factor in QoS provision is related to the user’s mobility: a mobile user relies on the availability of different wireless network providers and wireless technologies at different geographical locations and times along his trajectory [16]. To deal with this, providers of mobile services are (again) advised to employ complex QoS management frameworks or other solutions. For example [24, 57] propose to employ in mobile service delivery predictions of user mobility path acquired from a wireless network provider, or to employ a QoS broker for the reservation of network resources on behalf of mobile users [45]. Simultaneously, mobile network operators (MNOs) propose new concepts like Universal Mobile Access, Generic Access Network or IP-Multimedia-System [14], aiming at technical as well as business solutions for mobile service providers. Such solutions contradict the ‘mobile’ nature of services, because they limit mobile service providers’ customer base and service-usage area to the MNOs customer base and its coverage area.
The mobile service providers not following the network provider-centric business models emerge on a growing scale [61]. Naming few, Skype is a VoIP provider [49], MobiHealth.com is a mobile healthcare service provider [43], while Digital Chocolate is a mobile gaming service provider [18]. They all struggle to assure meeting their mobile users’ QoS requirements over unpredictable ‘best-effort’ QoS provided by wireless technologies [10]. Dedicated QoS measurements are not feasible due to the dynamic nature of QoS provided by wireless network technologies [20] and the limited resources (e.g. battery) of mobile devices.
At the same time, new wireless network providers appear and new long-range wireless technologies (e.g. HSPA) are deployed by the existing providers. These are steps towards the vision of 4G, where wireless communication infrastructures
are going to be plentifully available for mobile service users [15, 16, 48, 60]. In 4G environment a mobile service user can access any network anytime-anywhere. Yet, any new network provider or wireless technology when launched provides only a ‘best-effort’ QoS level [22] and uses ‘drive-tests’ as performance tests. Therefore, despite the 4G vision, still the question remains: how a mobile service user chooses a network best matching his user’s QoS requirements and QoE-expectations at a given geographical location and time. Our solution aims at prediction the QoS provided by networks to a mobile service user. To the best of our knowledge, the kind of solution we propose has not yet been proposed in the literature. To justify this, in the following section we present state of the art approaches for QoS-predictions.
2.2 Quality of Service Predictions
There exists limited research on predictions of QoS, usually done for a given mobile service being used in a fixed lab environment in a limited interval. It is important to notice that much of research, in which authors claim they aim to provide predictions, we categorize as research on inference. After machine learning literature [1] we define inference as prediction provided only for a given moment of time (i.e. now), and not for the future.
For example [6] aim to infer when a significant deviation of RTT between client and web-server will occur. They use Hidden Markov Models (HMM), using predictors that have exponential or polynomial decay of history. They prove that for some servers, the recent history (i.e. 2 minutes) is enough to predict such RTT degradation. [21] Proposes to select web-services based on artificial neural networks (ANN), which, based on service availability, reliability, data rate and a time of a service request (i.e., a time of the day), would predict its availability and delay (if the service is available). Similarly, [73] aim to predict web-services delay, based on a time of a service request, data rate and a state of service (e.g. number of other users). They predict this delay based on recent history (i.e. hours) modeled via a semi-Markov model. Their experimentation shows that predictions can be done with up to 90% of accuracy. [54, 55], using only the recent history (i.e. minutes) model delay, loss function for Internet paths using the Hidden Markov Model. Moreover, [29] model UDP application-traffic (that can represent e.g. a video stream) using Input-Output HMM – nodes. They particularly model delay or loss QoS measures. In their model they assume a Gamma distribution for delay; however they admit that this assumption has not been proven for data exchange with use of wireless access networks.
[2] aim to infer a) data rate available for user; and b) utilization of a channel, for the purpose of dynamic reconfiguration of real-time systems. As an input they assume a reconfiguration specification and data rate specification for a given service. They do not use any historical data. The simulations of scenarios show possible advantage of their approach. [44] research towards dynamic use of frequency spectrum; they aim to learn which frequencies are free and possible to be used without interference to others. So far, they have conducted only limited simulations, without real-user scenarios.
[26], based on simple statistical methods (means and standard deviation) aim to predict FTP downloads for mobile users. Namely they aim to predict RTT, data loss and data rates in different geographical locations, times and using different access networks. The prediction accuracy was low due to a major flaw in the experiments; it could not be distinguished when and where the mobile device was using which technology: in particular UMTS or GPRS. Similarly, in [41], the authors aim to predict the (TCP-level) data rates for arbitrary file sizes exchanged between two nodes on the Internet. They aim to predict this data rate from the measured delay and loss. They use Support Vector Machines (SVM) techniques. [59], based on measured data rate, aim to predict HSPA-based access network’s channel utility and accuracy and dependability using NN.
3 Feasibility Assessment: Preparation
3.1 Motivation, Context and Approach
The goal of our explorative case study is to asses a feasibility of deriving QoS-predictions for an operational mobile service being used by its representative user in his daily environments. As a mobile service, we have chosen the MobiHealth health telemonitoring service that enables ambulatory patient’s vital signs monitoring [63]. In the study we focus on a typical MobiHealth service user. Namely, this service is used by a Chronic Obstructive Pulmonary Disease (COPD) patient living in Geneva city (Switzerland). The mobile patient follows his daily routine of work and home activities, while having his health state being continuously monitored. His service is operational in mobile environments with 802.11-WLAN and 2.5G-GPRS wireless network providers available throughout the city.
The approach towards the QoS-predictions feasibility study is as follows. Having the MobiHealth system at hand, we focus on collection of QoS data by means of system measurements, rather than by means simulation or modeling. Particularly, we focus on (end-to-end) delay as a QoS measure of importance for the operational MobiHealth services. Hence, after instrumentation of the MobiHealth system for delay measurements, we collect delay measurement data for a patient continuously using two systems (thus emulating two different users being in same geographical location and time) along one-month interval. As there are two systems, two different wireless networks could be used at a geographical location. Moreover, having two systems, we attempt to test the hypothesis if based on data collected by one of them; we can obtain accurate predictions for the other one.
Based on the collected data, we analyze feasibility of delay predictions for a set of prediction algorithms. Namely we use 48 different data mining methods (assuming different set of parameters). Particularly, we assess the predictions feasibility in terms of prediction accuracy, its learning and prediction times and model’s complexity. Based on these results, we derive conclusions upon delay-predictions feasibility for an operational health telemonitoring service.
3.2 Background Information and Methodology for Predictions Study
Classification and prediction are two forms of data analysis that can be used to extract models describing important data classes or to predict future data trends [1, 23]. Effective and scalable methods have been developed for decision trees induction, Naive Bayesian classification, Bayesian belief network, rule-based classifier, back-propagation, Support Vector Machine (SVM), associative classification, nearest neighbor classifiers, and case-based reasoning, and other classification methods such as genetic algorithms, rough set and fuzzy set approaches [1]. Statistical significance tests are necessary for model selection. Issues such as model accuracy, training time, robustness, interpretability, and scalability must be considered in a model selection and these can involve trade-offs, which needs to be considered given a classification task at hand [71].
Classification predicts categorical class labels (discrete or nominal). It classifies data (constructs a model) based on the training set and the values (class labels) in a classifying attribute and use it in classifying new data. Prediction models continuous-valued functions, i.e., predicts model construction describing a set of predetermined classes. For prediction, each tuple/sample is assumed to belong to a predefined class, as determined by the class label attribute. The set of tuples used for model construction is training set. The model is represented as classification rules, decision trees, or mathematical formulae. Model is used for classifying future or unknown objects. To estimate accuracy of the model we compare the known label of test sample with the classified result from the model. The accuracy rate is the percentage of test set samples that are correctly classified by the model. Test set needs to be independent of training set, otherwise over-fitting will occur. If the accuracy of the model is acceptable, we can use the model to classify data tuples whose class labels are not known.
Classification is a supervised learning. Supervision is based on the fact that the training data (observations, measurements, etc.) are accompanied by labels indicating the class of the observations. The new data is classified based on the training set. In contrary, clustering is an unsupervised learning. The class labels of training data are unknown. Given a set of measurements, observations, etc. the aim is to establish the existence of classes or clusters in the data.
The QoS predictions problem addressed in this chapter is based on classification of delay (i.e. a QoS measure) observed in health telemonitoring service provided by the MobiHealth system. The classification of delay is done along one of nine schemas defined along the delay requirements posed on the MobiHealth system by its end user i.e. healthcare practitioner.
3.3 System Overview
The MobiHealth system is a distributed system for telemonitoring of a patient’s health condition [43, 63]. A patient is wearing a Body Area Network (BAN) [9, 62] consisting of a sensor-set and a Mobile Base Unit (MBU, i.e., central controlling unit of a BAN worn by a patient). The sensor-set usually consists of specialized sensors monitoring the patient’s vital signs, a geographical location sensor (e.g. a GPS receiver [27]) for his location determination and an event-notification sensor.
The sensor-set is specific for a patient’s health condition, e.g. Chronic Obstructive Pulmonary Disease (COPD, Figure 1), cardiac condition, epilepsy or chronic pain.
Fig.1. MobiHealth system overview: COPD care example
The MBU is the central unit of a BAN, usually in the form of a mobile phone or PDA. The MBU has three functionalities: collecting sensor-set data, processing it (e.g. filtering, shaping, correlating) and sending (processed) data to a remote application server - backend-system (BEsys, i.e., security, control, management, and data storage sub-system) located in a healthcare centre. It is specific for the MobiHealth system is that all these tasks are performed in real time. Once the sensor-set data has been send to the BEsys, it is made available (in a near real-time) to other applications, e.g. for storage, display for a medical decision support systems.
A patient’s health hazardous event can be defined differently for each patient, based on his health condition. The event notification can be determined by a) patient’s activating the event-notification sensor or b) based on the patient’s vital signs analysis done i) at the patient’s BAN or ii) at the BEsys.
3.4 Compliance with JINI Surrogate Architecture
A MobiHealth health telemonitoring service is implemented in Java and conforms to the JINI Surrogate Architecture specifications as presented in [19, 64].
Patient’s mobile device, i.e. MBU is a service provider. It continuously transmits BAN data from the MBU to the BEsys in a healthcare centre. According to the JINI Surrogate Architecture, a service provided by a device with limited resources (e.g. like MBU), called Device Service (DS), is represented on the Internet by its Surrogate Object (SO) deployed on a Surrogate Host (SH). The co-called JINI network consists of a SH (hosting SOs), service registry via which service users can find the required services, and service users themselves. Therefore the SO acts as service provider on behalf of the DS and shields service users (in the MobiHealth case: healthcare practitioners’ viewer application) from the specific means to communicate with the device. At the health telemonitoring application level, this yields that the DS, representing health telemonitoring service provider is deployed at the MBU. Moreover, a healthcare practitioners’ viewer application at a healthcare centre transparently retrieves BAN data from the SO at
the BEsys (hosting a SH). It is important to notice that there can be multiple DSs deployed on one mobile device and made available to service users.
The SO rely on the SH for a service life cycle management. Device specific communication between the SH and the DS is implemented by the MobiHealth Interconnect Protocol (MHIP). It is an application protocol and its previous version has been presented in [64]. The protocol component at MBU is called MHIP-IO. This component is responsible for a DS-SO communication, even in case if there is a Network Address Translator (NAT) between the mobile device and the fixed server (which is very often a case especially in GPRS wireless access networks). Summarizing, the MobiHealth health telemonitoring service consists of two components (Figure 2):
• health telemonitoring Device Service on the mobile device
• health telemonitoring Surrogate Object hosted by the Surrogate Host in the fixed network, i.e., on the BEsys in a healthcare centre.
Fig.2. MobiHealth health telemonitoring service components
The surrogate architecture specification requires the MHIP to support at least three mechanisms: device services discovery, surrogate object upload, and keep-alive. The purpose of the discovery mechanism is to make a SH aware of the DS existence and vice versa. Particularly, it is MHIP-IO component that discovers SH. After the SH discovery, DS provides SH with the SO that will act in the JINI network on the behalf of this device. After a SO has been instantiated and activated by the SH, the device must maintain its availability to provide its DS.
Consequently, the MHIP must implement a Keep-Alive mechanism, which implies that the DS needs to send at the fixed frequency so-called Keep-Alive messages to inform the SH that the service is (still) available. As soon as the device cannot confirm its availability, i.e. a Keep-Alive message is not received by SH within and expected time interval, the SH can deactivate the corresponding SO. The Keep-Alive message size is negligible comparing to the total volume of application-data being sent [51, 66].
The MobiHealth system adapts its volume of data being sent by DS to its SO based on the QoS provided by underlying end-to-end communication path. Namely, there exists an application-level buffer at the MBU, via which data is being sent by the MHIP-IO to the SO. The DS measures the state of the buffer. When the QoS provided by the path, and especially its speed is not sufficient to support volume of data being sent, the buffer fills. Based on the buffer fill level, the DS adapts application flow by excluding some sensor-set data and hence reducing volume of data being sent [8].
3.5 End-to-end Communication Path
In our case study we focus on the MobiHealth service for telemonitoring of a patient’s health condition. Particularly, the BAN uses the extra-BAN communication network, like WLAN or 2.5/3/3.5G (i.e. GPRS/UMTS/HSxPA) for exchange of the application and control data between the DS at the MBU and the SO at the BEsys. Patient’s vital signs data, i.e. telemonitoring application-data is sent continuously from the DS at the MBU to the SO at the BEsys (i.e. in an ‘uplink’ direction). The extra-BAN end-to-end data communication path is heterogeneous as it consists of wireless (e.g. 2.5/3/3.5G) and wired network technologies (Figure 3).
Fig.3. MobiHealth extra-BAN end-to-end communication path
The QoS provided by this path influences the QoS provided by the MobiHealth application to the patient. Particularly, the QoS is influenced by the choice of the Wireless Network Provider (WNP) and wireless access network technology used. If the MBU would have a choice of WNP, it would choose one resulting in providing best-of best-effort service to MobiHealth system, rather than an arbitrary WNP.
3.6 Application-level QoS
End-users of health telemonitoring application are healthcare professionals and their patients. However, only the healthcare professionals can define the application QoS requirements posed on the application [7]. These requirements encompass reliable, error-free data exchange between the MBU and BEsys without losses and at a minimum delay. The use of TCP/IP protocol in combination with MBU data storage ensures the application data recovery in case of data losses due to poor networks performance. This paper focuses on a minimum data delay requirement posed on the MobiHealth system; we focus on the extra-BAN communication network delay, having a major contribution to the application-data delay [68]. The MobiHealth system performance is managed based on the Keep-Alive message Round Trip Time (KA-RTT). It is the time it takes for a Keep-Keep-Alive control message originated at the DS at the MBU [50, 59], to be received by the SO at the BEsys and returned (without processing) to the DS at the MBU.
The KA-RTT reflects the delay induced by the underlying networks and the processing delays in the protocol stacks at the MBU and the BEsys. The (wireless) access network uplink (i.e. MBU to the BEsys) and downlink (i.e. BEsys to the MBU) contribute significantly to the KA-RTT [10, 68].
3.7 MobiHealth System Measurements
In this paper we focus on health telemonitoring application provided by MobiHealth system to COPD patients. We have collected KA-RTT measurement data for one patient living in Geneva (Switzerland), using the application along one month (17.11.07 - 15.12.07), while following his daily routines. He has spent 69.8% of time in two top geographical locations: home and office.
Application Flow
The BAN samples patient’s pulse rate, oxygen saturation, plethysmogram and alarm button activity at a frequency of 128 Hz. A sample consists of 5 Bytes of application-data. An application aggregates a unit of 1 s of data, i.e., 640 Bytes, and compresses it (lossless) before sending it to BEsys. The reduction in size relative to the uncompressed size is 80–85 %; it decreases as variability of the values of the measured vital signs. The MHIP adds 10 Bytes of protocol overhead per a compressed data unit. The overall data rate sent by the DS at the MBU to the SO at the BEsys is around 1.5 kbps.
MBU and BEsys Platforms
As a MBU we have used Qtek 9090 with Intel® PXA263 400 MHz processor, 128 MB RAM, running Windows Mobile 2003 SE PocketPC OS. The device has been dedicated for the executed measurements. The Qtek used GPRS (class 10) interface for extra-BAN communication; Sunrise operator and WLAN by University of Geneva provided GPRS network. The BEsys was a standard high performance server dedicated to MobiHealth telemonitoring services. The server was placed at University of Twente.
Measurements Instrumentation
The KA-RTT values (in milliseconds) were measured every 10 seconds continuously during the telemonitoring application execution. Moreover, the geographical location, time, network received signal strength indication, remaining battery level and data-rate sent by the DS at the MBU to the SO at the BEsys (in B/s) have been logged every second.
3.8 Predictions Tasks Definition
The goal of the research reported in this chapter is to assess the feasibility of predicting the KA-RTT values based on classification models build from the measurements data. We aimed to answer the following question: “Having collected 5 days of history of KA-RTT values as observed at different geographical locations, times, with use of different wireless networks and technologies, can we predict KA-RTT values for one of the next days?” For the purpose of this task we have taken Monday-Friday 26-30 November 2007 data as training (i.e. learning) dataset, and Monday 3 December 2007 data as testing (i.e. prediction) dataset.
Moreover, we have asked a question if data collected by one system (emulating user 1 or 2 and denoted as U1 or U2) can be equally used for deriving predictions for this system or for the other system (cases denoted U1-2 if data collected by system 1 is used for predictions for system 2; U2-1 would be the other way
around). Furthermore we asked a question if joined set of data collected by both system 1 and 2 can be used for predictions provided to any of them (cases denoted U1,1-1 if predictions are made for U1 and U1,2-2 if for U2).
From our preliminary research we concluded that predicting the KA-RTT numerical value is practically impossible. Therefore, as the purpose of this study is explorative, we transformed KA-RTT numeric values (in milliseconds) into categorical values along nine different schemas (and not only along one schema, as it is done in many other studies). A categorization schema was derived twofold. Firstly it was imposed by us based on healthcare practitioner’s (i.e. MobiHealth user’s) delay requirements posed for a vital sign data delivery. Secondly, it was derived from by the KA-RTT numeric values distribution. Therefore we defined nine different KA-RTT classification tasks. For those tasks the KA-RTT value was classified in:
• Task 1: two intervals (‘1’, ‘0’): corresponding to KA-RTT values of [0, 750) and [750, ∞); task 1 is denoted further as c1-750,
• Task 2: two intervals (‘1’, ‘0’): corresponding to KA-RTT values of [0, 1000) and [1000, ∞); task 2 is denoted further as c1-1000,
• Task 3: two intervals (‘1’, ‘0’): corresponding to KA-RTT values of [0, 1500) and [1500, ∞); task 3 is denoted further as c1-1500,
• Task 4: two intervals (‘1’, ‘0’): corresponding to KA-RTT values of [0, 2500) and [2500, ∞); task 4 is denoted further as c1-2500,
• Task 5: two intervals (‘1’, ‘0’): corresponding to KA-RTT values of [0, 3000) and [3000, ∞); task 5 is denoted further as c1-3000,
• Task 6: four intervals derived from KA-RTT distribution (‘1’, ‘2’, ‘3’, ‘4’): corresponding to KA-RTT values of [0, 1811), [1811, 2221), [2221, 2609), and [2609, ∞); task 6 is denoted further as c2
• Task 7: five intervals (‘1’, ‘2’, ‘3’, ‘4’, ‘5’): corresponding to KA-RTT values of [0, 500), [500, 1000), [1000, 1500), [1500, 2000) and [2000, ∞); task 7 is denoted further as c3-500,
• Task 8: five intervals (‘1’, ‘2’, ‘3’, ‘4’, ‘5’): corresponding to KA-RTT values of [0, 750), [750, 1500), [1500, 2250), [2250, 3000), [3000, ∞); task 8 is denoted further as c3-750,
• Task 9: five intervals (‘1’, ‘2’, ‘3’, ‘4’, ‘5’): corresponding to KA-RTT values of [0, 1000), [1000, 2000), [2000, 3000), [3000, 4000), [4000,∞); task 9 is denoted further as c3-1000.
Tasks 1-5 can be also called ‘binary’, as they aim to predict one of two possible values of the KA-RTT class.
3.9 Collected Data Summary
In the collected data, we distinguish nine fixed user’s geographical locations and six trajectories (traversed while patient was mobile). We distinguish Sunrise-GPRS as wireless network provider - wireless technology 1 (provider-Tech1) combination and University of Geneva - WLAN as wireless provider 2 - technology 2 combination (provider-Tech2). We have collected in total 2’509’250 KA-RTT measurement seconds for two systems; 1’228’780 instances for U1 and 1’280’470 instances for U2.
Data Representation
Measurement of each KA-RTT instance has been associated with measurement of the MBU and BEsys platform parameters. These parameters we use now as discriminators for KA-RTT classification. These parameters are also called features [71] and KA-RTT itself is called a target feature.
Day of a week (DoW) represents a day of the week (1-7; 1 is Monday) and hour (hr) represented as an hour of a day (0-23). DoW and hr are the two features indicating time. We have collected data in time span of one month; if we would collect data for consecutive months and years, the month and year would be candidate features as well.
Geographical location (loc) represents the patient’s geographical location, where 1 is home, 2 - office, 3 - shopping centre, etc. Network operator (op) represents the wireless network provider and wireless network technology used, where 1 is wireless network provider-Tech 1 (Sunrise-GPRS) and 2 is wireless network provider-Tech2 (UniGe-WLAN). Hr, DoW, loc and op are categorical data. The network received signal strength indication (RSSI) at the MBU (sig) has been quantized into four values from 1 (none or a weak signal) to 4 (a maximum signal). Similarly, the MBU remaining battery level (bat) has value from 1 (none or a small fraction of battery left) to 4 (maximum battery level). The variables sig and bat are to be considered as ordinal data with a Likert scale, i.e. one cannot assume the intervals between values are the same but just that the values are ordered [17]. It results the inherent way these values are derived from the MBU OS; they are not measured continuously, but in steps. Health telemonitoring data-rate (in Bytes/second) sent by the MBU to the BEsys is denoted as MBU-Rout and is a regular numerical value.
3.10 Training and Testing Accuracy
Accuracy of classification models build from the measurements data for a given classification task is derived in two phases: learning, called training phase and predictions called testing phase.
For a given model, its accuracy it is a percentage of correctly classified instances in training or testing phase and therefore called respectively training accuracy or testing accuracy. Accuracy has a value in range of 0…100%, where 0% means that none of instances were correctly classified, and 100% means all of them were classified correctly.
In a training phase, prediction models are derived (i.e. learned) by given data mining algorithm (with given parameters), based on the given training dataset. In a testing phase the derived models are tested on the given testing dataset. Training and testing datasets are non-overlapping subsets derived from the overall set of measurements data available for our research.
As a training procedure we choose 10 folds cross-validation (CV) executed on a training dataset [71]. In each CV we obtain 10 models for an algorithm. The CV is repeated 10 times to obtain statistically sound training results, i.e. all 100 individual models are then used to estimate mean and variance of accuracy for the given algorithm on the given training dataset.
Testing procedure encompasses evaluation of the accuracy of the derived models on the testing dataset. The testing dataset is sometimes also denoted as a ‘hold-out’ data set, as it is held-out from the overall set of measurements data available for a given research. According to guidelines in data mining field, the accuracy obtained by an algorithm in a testing phase aims to represent a future (i.e., any) predictions accuracy of this algorithm [42, 71].
Accuracy of each classification model build from the training dataset for given classification task is to be compared with the task’s baseline accuracy. Given our nine prediction tasks, where target feature is to be classified in one of two, four or five distinct categories, baseline accuracy we define based on a mode class (i.e. most probable class, which is more suitable than a mean class value) for this task [71]. For a given task, firstly, the mode class is learned from the task’s training dataset; then the task baseline accuracy is a probability of this mode class derived from task’s training dataset.
A prediction algorithm, which uses the above logic and predicts the mode class value, we call an ‘educated guess’ data mining method. It is implemented in WEKA software package as ZeroR (ZR) rule [71].
4 Feasibility Assessment: Results
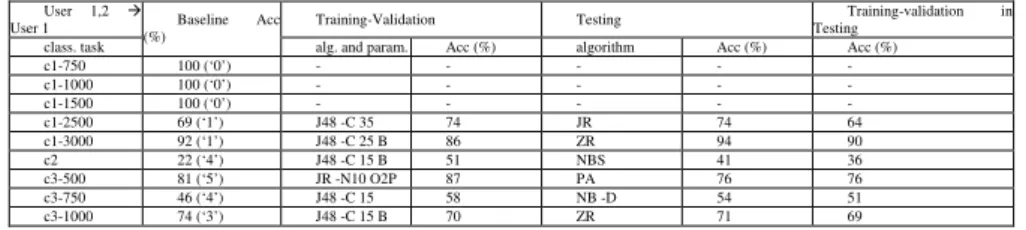
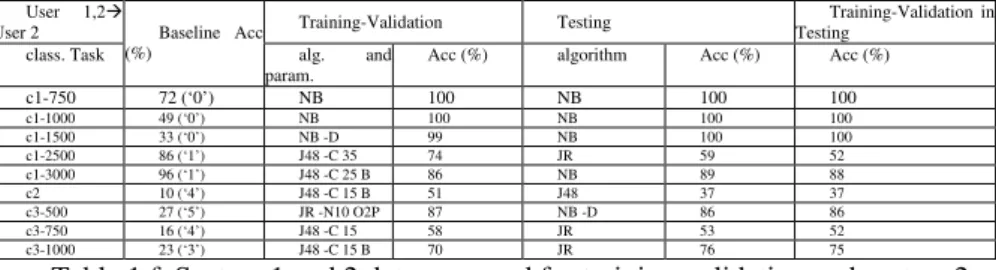
In our predictions case study, we analyzed performance of diverse machine learning techniques including Bayesian networks, rules and trees. The results are presented in six separate tables 1a-f, each table corresponds to a defined system case (U1, U2, U1-U2, U2-U1, U1,2-U1 and U1,2-U2) and rows correspond to nine classification tasks (c1-750, etc.). The table columns represent a) a user-case and its classification task; b) task’s baseline accuracy in percentage; c) a result for a training phase: the most accurate algorithm and its parameters and its accuracy in percentage; d) a result for the testing phase: the most accurate algorithm and its accuracy in percentage; and e) the testing accuracy of the most accurate algorithm from a training phase (i.e. algorithm with parameters as given in the column c).
The names of the algorithms are abbreviated as follows: J48 for J48, PA for PART, JR for JRip, NB for Naïve Bayes, RF for Random Forest and ZR for ZeroR rule (i.e. performing along the task’s baseline accuracy). For some tasks, no values exist in the tables (“-“). For these tasks, we assume that due to the distribution of target feature in the training and testing datasets at the level of 99-100%, the baseline accuracy is the only performance measure. For these tasks, there is no advantage gained from data mining, which require training and testing phase hence would mean wasting of the computational resources.
For all algorithms, the training and testing times were in the order of one second or below.
Table 1 a-f. Predictions accuracy for the predictions experiment. Each row represents results for one prediction task and it gives its baseline accuracy, with an indication in brackets which is the majority class for a given task; the most accurate algorithm with its parameter setting and its accuracy found a training-validation phase; the most accurate algorithm and its accuracy found in testing
phase; and the accuracy of the most accurate algorithm from a training-validation phase, in its testing phase.
U1 Training-Validation Testing Testing Training-Validation in class. task
Baseline Acc (%)
alg. and param. Acc (%) algorithm Acc (%) Acc (%) c1-750 100 (‘0’) - - - - - c1-1000 100 (‘0’) - - - - - c1-1500 100 (‘0’) - - - - - c1-2500 69 (‘1’) J48 -C 15 B 70 JR 69 57 c1-3000 92 (‘1’) J48 -C 15 B 79 ZR 92 88 c2 22 (‘4’) J48 -C 15 51 NB 37 33 c3-500 81 (‘5’) JR -N10 O2P 90 JR 81 81 c3-750 46 (‘4’) J48 -C 15 B 54 NB 50 46 c3-1000 74 (‘3’) J48 -C 15 B 68 JR 74 72
Table 1 a. System 1 data only used for training-validation and testing U2 Training-Validation Testing Testing Training-Validation in class. task
Baseline Acc (%)
alg. and param. Acc (%) algorithm Acc (%) Acc (%) c1-750 72 (‘0’) J48 -C 15 B 82 JR 73 70 c1-1000 49 (‘0’) PA -C 25 B 89 JR 82 82 c1-1500 33 (‘0’) PA -C 15 98 NB 98 97 c1-2500 86 (‘1’) J48 -C 15 B 86 JR 87 86 c1-3000 96 (‘1’) PA -C 35 B 95 JR 96 96 c2 69 (‘1’) J48 -C 15 B 74 J48 80 79 c3-500 27 (‘5’) J48 -C 15 B 78 JR 74 73 c3-750 40 (‘2’) J48 -C 15 B 62 JR 56 53 c3-1000 51 (‘1’) J48 -C 15 B 75 JR 75 73
Table 1 b. System 2 data only was used for training-validation and testing User 1 2 Training-Validation Testing Testing Training-Validation in class. task
Baseline Acc (%)
alg. and param. Acc (%) algorithm Acc (%) Acc (%) c1-750 100 (‘0’) - - - - - c1-1000 100 (‘0’) - - - - - c1-1500 100 (‘0’) - - - - - c1-2500 58 (‘1’) PA -C 35 B 76 JR 59 45 c1-3000 89 (‘1’) JR -N2 O2 79 JR 89 75 c2 33 (‘4’) J48 -C 15 B 52 J48 36 36 c3-500 86 (‘5’) JR -N10 O2P 90 NB 80 86 c3-750 53 (‘4’) J48 -C 15 B 53 JR 53 41 c3-1000 76 (‘3’) J48 -C 15 B 68 J48 76 75
Table 1 c. System 1 data used for training-validation and syst. 2 data for testing User 2 1 Training-Validation Testing Testing Training-Validation in class. task
Baseline Acc (%)
alg. and param. Acc (%) algorithm Acc (%) Acc (%) c1-750 100 (‘0’) - - - - - c1-1000 100 (‘0’) - - - - - c1-1500 100 (‘0’) - - - - - c1-2500 74 (‘1’) JR -N10 O5 76 JR 75 73 c1-3000 94 (‘1’) PA -C 35 B 91 ZR 94 89 c2 17 (‘4’) J48 -C 15 B 53 J48 41 41 c3-500 76 (‘5’) NB -D 85 NB -D 76 76 c3-750 41 (‘4’) J48 -C 15 B 64 J48 53 53 c3-1000 71 (‘3’) J48 -C 15 B 72 ZR 71 70
Table 1 d. System 2 data used for training-validation and syst. 1 data for testing User 1,2
User 1 Training-Validation Testing
Training-validation in Testing
class. task
Baseline Acc (%)
alg. and param. Acc (%) algorithm Acc (%) Acc (%) c1-750 100 (‘0’) - - - - - c1-1000 100 (‘0’) - - - - - c1-1500 100 (‘0’) - - - - - c1-2500 69 (‘1’) J48 -C 35 74 JR 74 64 c1-3000 92 (‘1’) J48 -C 25 B 86 ZR 94 90 c2 22 (‘4’) J48 -C 15 B 51 NBS 41 36 c3-500 81 (‘5’) JR -N10 O2P 87 PA 76 76 c3-750 46 (‘4’) J48 -C 15 58 NB -D 54 51 c3-1000 74 (‘3’) J48 -C 15 B 70 ZR 71 69
Table 1 e. System 1 and 2 data used for training-validation and syst. 1 data for testing
User 1,2
User 2 Training-Validation Testing
Training-Validation in Testing class. Task Baseline Acc (%) alg. and param.
Acc (%) algorithm Acc (%) Acc (%)
c1-750 72 (‘0’) NB 100 NB 100 100 c1-1000 49 (‘0’) NB 100 NB 100 100 c1-1500 33 (‘0’) NB -D 99 NB 100 100 c1-2500 86 (‘1’) J48 -C 35 74 JR 59 52 c1-3000 96 (‘1’) J48 -C 25 B 86 NB 89 88 c2 10 (‘4’) J48 -C 15 B 51 J48 37 37 c3-500 27 (‘5’) JR -N10 O2P 87 NB -D 86 86 c3-750 16 (‘4’) J48 -C 15 58 JR 53 52 c3-1000 23 (‘3’) J48 -C 15 B 70 JR 76 75
Table 1 f. System 1 and 2 data was used for training-validation and system 2 data for testing
Analyzing the results, we conclude that the advantage gained from data mining leaves no room for doubt. All results throughout all the six cases show large advantage of algorithms over the baseline accuracy (i.e. accuracy of models is higher of up to 64% over the baseline accuracy). This is especially visible for tasks when delay was classified in 2 categories (i.e., tasks c1), where predictions accuracy reaches 80-100 %. For tasks when delay was classified in 4-5 categories (i.e., tasks c2, c3), the predictions accuracy increased up to even 4 times over the one of the baseline. This has been observed consistently for task c2.
The highest accuracy is mainly obtained by algorithms that test features sequentially (trees and rules: J48, Part and JRip). When examining the models produced by these algorithms, we observe that the geographical location, operator and time are the most predictive features, followed by application data-rate and device’s signal and battery. NB models were in many tasks least accurate. This clear performance dichotomy between sequential (e.g. J48) and parallel (NB) algorithms suggests a weak interaction among all the seven features used for delay predictions.
However, in some tasks, NB models were most accurate. When examining the models produced by NB algorithms, we observed that the accuracy of these models was not related to strong interaction among all the seven features used for delay predictions, but it was related to the highly unbalanced distribution of delay (i.e. 90% probability of mode class).
We also analyzed the accuracy of best algorithms in a training phase, i.e., algorithms with the highest accuracy in the training phase, against the accuracy of best algorithms in the testing phase. Without looking at results after applying the statistical significance tests, the difference between these accuracies ranges from 1-14% (c.f. column ‘training’ vs. ‘training in testing (Tr in Te)’). Based on this observation alone we conclude that algorithms accuracy observed at training resulted not from over-fitting to training dataset, but from an effective generalization made by algorithms, which kept same level of accuracy on testing datasets. Moreover, after applying the Bonferroni adjustment for multiple comparisons and McNemar statistical significance tests, we saw that all differences vanish among the best models in testing. That means that best training algorithms, were also amongst the best testing algorithms, i.e. they could be used further for deriving accurate predictions.
Overall, from prediction results we conclude that it is feasible to provide accurate predictions for a user based on own or the other user (i.e. system) data. It
is equally feasible to provide predictions for a user based on own and other user data. In these cases (i.e., U1,2-U1 and U1,2-U2) however the improvement (or loss) in accuracy is small (-5 to 7%) U1, and does not motivate the effort of including other user’s training datasets. In other words, the data collected by U2 does not improve accuracy of predictions provided to user U1. For U2, this improvement is highly variable (-42 to 30%), and again, does not motivate the effort of including other user’s training datasets. It is not clear why using first and second user datasets for the first user, provides more advantage than for the other user. For this experiment, we conclude that data collected by one user does not improve accuracy of predictions provided to other user.
Analyzing the overall results, we conclude that the advantage gained from data mining leaves no room for doubt. We show however that accuracy of different algorithms varied, depending on what has been predicted. Best prediction results we obtained via tree-based data mining methods, which can learn tree-structured dependencies (like a random tree or a rule). This we explain by the structure of data, which has been organized in a hierarchical way along user geographical location, network provider wireless technology and time variables. Similar conclusion has been already reported by [46] for user’s geographical location and time-based activity prediction tasks. Therefore it is not surprising that when examining prediction models derived by trees and rules algorithms, we observe that user geographical location, network provider wireless technology and time (day of the week and hours) were most predictive variables. The mobile device received signal strength indication and battery fill level were not predictive, but we conclude it could be that because their distributions were very monotonic, i.e., strength indication as well as battery fill level were almost all the time having a maximum value.
5 Future Research Directions
There are many possible scenarios, in which QoS-predictions service can evolve. Perhaps the biggest remaining challenge is that of bringing more discriminatory information to bear on the prediction tasks. Integrating more domain-specific information concerning e.g. cell-ID for a GPRS network or précising geographical location of the user further (i.e. to the meter of accuracy while using one of the techniques as proposed by [27]), or the current state of mobile device (e.g. memory, CPU usage) more accurately, is a feasible solution in the short term. We may also consider including domain-independent features (e.g. statistical measures like median) to the discriminatory power of the machine learning techniques. We may ultimately have to mine the mobile computing literature to gather fresh insights on the part of delay values, currently defying classification.
Another possible future work direction is a research on a scalable solution for QoS-predictions service - limiting its scope of operation to a particular city, region or country, limiting the scope of wireless network providers or technologies for which predictions can be provided. Scoping can be dictated by the need of limiting the QoS information to be processed for deriving the QoS-predictions, or the need for higher accuracy of QoS-predictions provided for a restricted geographical
location-area. Furthermore, the service can be limited in terms of network providers and wireless technologies for which the QoS-predictions service acquires QoS information.
A research direction for a long term includes a technical feasibility of the QoS-predictions service (i.e. delay-QoS-predictions service) to be evaluated in an operational MobiHealth system. So far we have proposed architecture of such a solution, which we name QoS information system (QoSIS [65]. From implementation point of view we would like to research feasibility of deriving predictions on mobile device itself, without passing through the QoS-predictions provider on the Internet. We believe that it is duable given the current computing and storage capabilities of mobile devices. However, the efficiency and effectiveness of this solution needs to be compared to the one based on the QoS-predictions server on the Internet.
In our research we have already analyzed a business viability of an enterprise that based on a collaborative-sharing of the QoS information collected by mobile service users (Mobile Web 2.0 community), provides its QoS-predictions service back to these users. We name this enterprise QoSIS.net and we present our research outcomes in [67].
We also need research on the following issue. If all mobile users will get prediction for an excellent QoS level provided by network X in geographical location A and will switch to this network at the same time, most probably they will experience low QoS (or even that they will be inhibited from using the network by the network admission control system). QoS-predictions service provider in form of a new historical data will then log this low QoS. Based on this new historical data, future prediction for network X will not indicate its excellent QoS level. We believe that in a long term, system will find equilibrium based on what are the QoS required by the users and the QoS provided by networks. However, we admit that the load balancing in the network and QoS-predictions service usage is a future work area.
Future research directions aiming at QoS support for mobile users in 4G environments would include research of solutions that build upon best-effort networks to fulfill QoS requirements for any mobile application used by its user anywhere-anytime. We envision that QoS-predictions service will be used by other applications in e.g. entertainment (gaming), communication (voice) and infotainment (TV, web browsing) domains. Many of these applications are provided nowadays over fixed Internet infrastructures and soon they will be available ‘on the move’. These applications provide strict QoS requirements. Namely, for example games of type first person shooter (Quake, Doom, Half-life, Counter Strike, American Army), where the fast step first person action counts, are so far most popular multiplayer games and as it has been proven, they have strict QoS requirements [39] like the RTT value of 100 ms [4], very low delay jitter and no [52]. VoIP applications require RTT of 150 ms to maximum 400 ms, jitter of up to 50 ms and loss of 3 % maximum [32, 33]. Internet Protocol Television (IPTV) services require a constant network capacity of around 2 Mbps in order to deliver its services to users at the satisfactory level [34]. Moreover, for web browsing [36], proved that service delay quality ratings show a drop-off at around 8 to 10 seconds; users required that the most important content on the web would be displayed to them with delay of maximum 2 s. These (and many others) applications provide
strict QoS requirements; hence they will need a support to fulfill these requirements for a mobile user being anywhere-anytime. Using QoS-predictions service would be an option.
6 Conclusive Remarks
The overall conclusive remarks drawn upon the results obtained in our study on QoS-predictions feasibility assessments indicate that that previously believed fact that is not feasible to predict QoS provided by a network provider in a ‘best-effort’ networking environment can be refuted. Namely, we show that it is feasible and sometimes straightforward to predict accurately value of QoS performance measure for given mobile service used at given geographical location-network provider-technology-time. The prediction accuracy is driven by amount of available historical data. On one hand, we claim that mobile services need no longer be condemned to ‘best-effort’ service provided by the underlying heterogeneous networking environment; a mobile service can use QoS-predictions to proactively obtain ‘best of best-effort’ service for the end-to-end communication path. On the other hand, we envision that in order to fulfil the dream of providing mobile services meeting users’ QoS requirements and QoE-expectations in plentiful 4G networking environments, mobile service providers need to take a necessary risk and employ novel technological solutions for the QoS support in their service delivery processes. QoS-predictions service is just an example of such a novel support.
References
[1] Alpaydin, E. (2004). Introduction to machine learning: MIT press.
[2] Amirijoo, M., Tesanovic, A., Andersson, T., Hansson, J., & Son, S. H. (2006). Finite Horizon QoS Prediction of Reconfigurable Firm Real-Time Systems. Paper presented at the 12th IEEE Intl Conference on Embedded and Real-Time Computing Systems and Applications.
[3] Andersen, D., Bansal, D., Curtis, D., Seshan, S., & Balakrishnan, H. (2000). System Support for Bandwidth Management and Content Adaptation in Internet Applications. Paper presented at the 4th Symposium on Operating Systems Design and
Implementation (OSDI), San Diego, CA, USA.
[4] Beigbeder, T., Coughlan, R., Lusher, C., Plunkett, J., & Agu, E. (2004). The Effect of Loss and Latency on User Performance in Unreal Tournament 2003®. Paper presented at the SIGCOMM’04 Workshops, Portland, Oregon, USA.
[5] Bellavista, P., Küpper, A., & Helal, S. (2008). Location-Based Services: Back to the Future. IEEE PERVASIVE COMPUTING, 7(2), 85-89.
[6] Bremler-Barr, A., Cohen, E., Kaplan, H., & Mansour, Y. (2003). Predicting and bypassing end-to-end Internet service degradations. IEEE Journal on Selected Areas in Communications, 21(6), 961-978.
[7] Broens, T., Huis in't Veld, R., Vollenbroek-Hutten, M., Hermens, H., van Halteren, A., & Nieuwenhuis, B. (2007). Determinants for successful telemedicine implementations: a literature study. Journal for Telemedicine and Telecare, 13(6), 303-309.
[8] Bults, R., Pawar, P., & van Halteren, A. (2005a). Context Aware Nomadic Mobile Service - A Case Study on M-Health Signal Processing: University of Twente, the Netherlands.
[9] Bults, R., Wac, K., van Halteren, A., Konstantas, D., Jones, V., & Widya, I. (2004). Body Area Networks for Ambulant Patient Monitoring Over Next Generation Public Wireless Networks. Paper presented at the 13th IST Mobile and Wireless
Communications Summit, Lyon, France.
[10]Bults, R., Wac, K., van Halteren, A., Konstantas, D., & Nicola, V. (2005b). Goodput Analysis of 3G wireless networks supporting m-health services. Paper presented at the 8th International Conference on Telecommunications (ConTEL05), Zagreb, Croatia. [11]Chalmers, D., & Sloman, M. (1999a). QoS and Context Awareness for Mobile
Computing. Paper presented at the 1st Intl. Symposium on Handheld and Ubiquitous Computing (HUC99), Karlsruhe, Germany.
[12]Chalmers, D., & Sloman, M. (1999b). A survey of Quality of Service in mobile computing environments. IEEE Communications Surveys and Tutorials, 2(2), 2-10. [13]claffy, k., Miller, G., & Thompson, K. (1998). The nature of the beast: recent traffic
measurements from an Internet backbone. Paper presented at the International Networking Conference (INET98), Geneva, Switzerland.
[14]Cuevas, A., Moreno, J. I., Vidales, P., & Einsiedler, H. (2006). The IMS Platform: A Solution for Next Generation Network Operators to Be More Than Bit Pipes. IEEE Commun. Mag., Advances in Service Platform Technologies, 44(8), 75-81.
[15]De Vriendt, J., Laine, P., Lerouge, C., & Xu, X. (2002). Mobile Network Evolution: A Revolution on the Move. IEEE Commun. Mag., 40(4), 104-111.
[16]Dekleva, S., Shim, J. P., Varshney, U., & Knoerzer, G. (2007). Evolution and emerging issues in mobile wireless networks. Commun. ACM, 50(6), 38-43.
[17]DeVellis, R. F. (2003). Scale development: theory and applications: SAGE. [18]Digital Chocolate. (2008). Seize the Minute. Retrieved Sep 05, 2008, from
www.digitalchocolate.com
[19]Dokovsky, N., van Halteren, A., & Widya, I. (2004). BANip: Enabling Remote Healthcare Monitoring with Body Area Networks. Paper presented at the Intl Workshop on Scientific Engineering of Distributed Java Applications (FIJI03), Luxembourg.
[20]Dood, A. (2005). The Essential Guide to Telecommunications. US: Prentice Hall PTR. [21]Gao, Z., & Wu, G. (2005). Combining QoS-based service selection with performance
prediction. Paper presented at the IEEE Intl Conf on e-Business Engineering (ICEBE05).
[22]Gomez, G., & Sanchez, R. (2005). End-to-End Quality of Service over Cellular Networks: Data Services Performance Optimization in 2G/3G: John Wiley & Sons, Ltd.
[23]Han, J., & Kamber, M. (2006). Data mining: concepts and techniques: Morgan Kaufmann.
[24]Han, Q., & Venkatasubramanian, N. (2006). Information Collection Services for QoS-aware Mobile Applications. IEEE Transactions on Mobile Computing, 5(5), 518-535.
[25]Hansmann, U., Merk, L., Nicklous, M., & Stober, T. (2003). Pervasive Computing: The Mobile World: Springer.
[26]Hegge, S. (2007). Predicting end-to-end network characteristics on mobile devices. Unpublished MSc, University of Twente, Enschede, the Netherlands.
[27]Hightower, J., & Borriello, G. (2001). Location systems for ubiquitous computing. Computer, 34(8), 57-66.
[28]Hutchison, D., Mauthe, A., & Yeadon, N. (1997). Quality-of-service architecture: Monitoring and control of multimedia communications. Electronics & Communication Engineering Journal, 9(3), 100.
[29]Iannello, G., Palmieri, F., Pescapè, A., & Salvo Rossi, P. (2005). End-to-End Packet-Channel Bayesian Model applied to Heterogeneous Wireless Networks. Paper presented at the IEEE Globecom 2005, St. Louis (MO, USA).
[30]ITU-T. (1993). General aspects of Quality of Service and Network Performance in Digital Networks, including ISDNs (Vol. I.350): ITU.
[31]ITU-T. (2006). Framework for achieving end-to-end IP performance objectives (Vol. Y.1542): ITU.
[32]ITU-T. (2007a). Mean Opinion Score (MOS) terminology (Vol. P.800): ITU. [33]ITU-T. (2007b). Vocabulary for performance and quality of service: Appendix I –
Definition of Quality of Experience (QoE) (Vol. P.10/G.100): ITU-T.
[34]ITU-T. (2007c). Working document: Quality of Experience Requirements for IPTV (Vol. FG IPTV-36): ITU.
[35]ITU-T. (2008). Definitions of terms related to quality of service (Vol. E.800): ITU. [36]King, A. (2008). Website Optimization: Speed, Search Engine & Conversion Rate
Secrets: O'Reilly Media, Inc.
[37]LaMarca, A., Chawathe, Y., Consolva, S., Hightower, J., Smith, I., Scott, J., et al. (2005). Place Lab: Device Positioning Using Radio Beacons in the Wild. Paper presented at the Pervasive Computing 2005, Munchen, Germany.
[38]Lin, K. J. (2007). Building Web 2.0. IEEE COMPUTER, 40(5), 101-102. [39]Matsumoto, C. (2004). Online Games Pose Carrier Conundrum. Light Reading -
Networking the Telecom Industry.
[40]Michaut, F., & Lepage, F. (2005). Application-oriented network metrology: Metrics and active measurement tools. IEEE Communications Surveys & Tutorials, 7(2), 2-24. [41]Mirza, M., Sommers, J., Barford, P., & Zhu, X. (2007). A machine learning approach
to TCP throughput prediction. Paper presented at the ACM SIGMETRICS07. [42]Mitchell, T. (1999). Machine Learning and Data Mining. Communications of the
ACM, 42(11), 30-36.
[43]MobiHealth. (2007). Putting care in motion. Retrieved Sep 05, 2008, from www.mobihealth.com
[44]Mody, A. N., Blatt, S. R., Mills, D. G., McElwain, T. P., Thammakhoune, N. B., Niedzwiecki, J. D., et al. (2007). Recent advances in cognitive communications. IEEE Communications Magazine, 45(10), 54-61.
[45]Nahrstedt, K., Xu, D., Wichadakul, D., & Li, B. (2001). QoS-aware middleware for ubiquitous and heterogeneous environments. IEEE Communication Magazine, 39(11), 140-148.
[46]Nurmi, P., Hassinen, M., & Lee, K. C. (2007). A Comparative Analysis of
Personalization Techniques for a Mobile Application. Paper presented at the Intl Conf on Advanced Information Networking and Applications Workshops (AINAW07). [47]O'Reilly, T. (2005). What is Web 2.0? Retrieved Sep 05, 2008, from
www.oreillynet.com/pub/a/oreilly/tim/news/2005/09/30/what-is-web-20.html [48]Ortiz, S. (2007). 4G Wireless Begins to Take Shape. IEEE Computer, 40(11), 18-21. [49]Osterwalder, A., Ondrus, J., & Pigneur, Y. (2005). Skype's Disruptive Potential in the
Telecom Market: A Systematic Comparison of Business Models. Lausanne, CH: University of Lausanne.
[50]Pawar, P., van Beijnum, B. J., Peddemors, A., & van Halteren, A. (2007). Context-Aware Middleware Support for the Nomadic Mobile Services on Multi-homed Handheld Mobile Devices. Paper presented at the 12th IEEE Symposium on Computers and Communications (ISCC07), Aveiro, Portugal.
[51]Pawar, P., Wac, K., van Beijnum, B. J., Maret, P., van Halteren, A., & Hermens, H. (2008). Context-Aware Middleware Architecture for Vertical Handover Support to Multi-homed Nomadic Mobile Services. Paper presented at the 23rd Annual ACM Symposium on Applied Computing (ACMSAC08), Ceará, Brazil.
[52]Quax, P., Monsieurs, P., Lamotte, W., De Vleeschauwer, D., & Degrande, N. (2004). Objective and Subjective Evaluation of the Influence of Small Amounts of Delay and Jitter on a First Person Shooter Game. Paper presented at the NetGames04, Portland, USA.
[53]Quinlan, R. (1993). C4.5: Programs for Machine Learning. San Meteo, CA, USA: Morgan Kaufmann.
[54]Salvo Rossi, P., Romano, G., Palmieri, F., & Iannello, G. (2003a). Bayesian Modelling for Packet Channels. Paper presented at the Italian Workshop on Neural Nets (WIRN). [55]Salvo Rossi, P., Romano, G., Palmieri, F., & Iannello, G. (2003b). A Hidden Markov
Model for Internet Channels. Paper presented at the IEEE Intl Symposium on Signal Processing and Information Technology (ISSPIT), Darmstadt, Germany.
[56]Shepherd, D., Scott, A., & Rodden, T. (1996). Quality-of-Service Support for Multimedia Applications. IEEE MultiMedia, 03(3), 78-82.
[57]Soh, W. S., & Kim, H. S. (2003). QoS Provisioning in Cellular Networks Based on Mobility Prediction Techniques. IEEE Commun. Mag., 41(1), 86-92.
[58]SUN. (2001). The Jini™Technology Surrogate Architecture Overview: SUN Microsystems Inc.
[59]Sun, Y., Tsang, K. F., Tung, H. Y., Lam, K. L., & Ko, K. T. (2008). QoS Prediction for High Speed Packet Access Networks. Paper presented at the 5th IEEE Consumer Communications and Networking Conference (CCNC08).
[60]Tachikawa, K. (2003). A Perspective on the Evolution of Mobile Communications. IEEE Commun. Mag., 41(10), 66-73.
[61]Tan, S. (2004). Evolution of mobile technology and business models (technical report): Center for Information and Communication Technologies, Lyngby, DK.
[62]van Halteren, A., Bults, R., Wac, K., Dokovsky, N., Koprinkov, G., Widya, I., et al. (2004a). Wireless Body Area Networks for Healthcare: the MobiHealth Project. In G. Demiris (Ed.), Studies in Health Technology and Informatics (Vol. 108, pp. 181-193). Amsterdam, the Netherlands: IOS Press.
[63]van Halteren, A., Bults, R., Wac, K., Konstantas, D., Widya, I., Dokovsky, N., et al. (2004b). Mobile Patient Monitoring: The MobiHealth System. The Journal on Information Technology in Healthcare, 2(5), 365-373.
[64]van Halteren, A., & Pawar, P. (2006). Mobile Service Platform: A Middleware for Nomadic Mobile Service Provisioning. Paper presented at the 2nd Intl. IEEE Conference on Wireless and Mobile Computing, Networking and Communications (WiMob06), Montreal, Canada.
[65]Wac, K. (2009). Collaborative Sharing of Quality of Service-Information for Mobile Service Users. Unpublished doctoral dissertation, University of Geneva, Geneva, CH. [66]Wac, K., Bargh, M., van Beijnum, B. J., Bults, R., Pawar, P., & Peddemors, A.
(2009a). Power- and Delay-Awareness of Health Telemonitoring Services: the MobiHealth System Case Study. IEEE JSAC, Special Issue on Wireless and Pervasive Communications in Healthcare, 27(4), 1-12.
[67]Wac, K., Bults, R., Konstantas, D., Chen, H., & van Beijnum, B. J. (2009b). Toward Mobile Web 2.0-based business methods: Collaborative QoS-information Sharing for Mobile Service Users. In M. Head, (Eds.) (Ed.), Mobile and Ubiquitous Commerce: Advanced E-Business Methods (Vol. 4, pp. xx-xx): IGI Global.
[68]Wac, K., Bults, R., van Halteren, A., Konstantas, D., & Nicola, V. (2005).
Measurements-based performance evaluation of 3G wireless networks supporting m-health services. Paper presented at the 12th Multimedia Computing and Networking (MMCN05), San Jose, CA, USA.
[69]Want, R., Fishkin, K. P., Gujar, A., & Harrison, L. B. (1999). Bridging physical and virtual worlds with electronic tags, Intl Conference on Human Factors in Computing Systems (SIGCHI). Pittsburgh, PA, United States: ACM.
[70]Weiss, S. M., & Kulikowski, C. A. (1991). Computer systems that learn: classification and prediction methods from statistics, neural nets, machine learning, and expert systems: Morgan Kaufmann Publishers Inc. San Francisco, CA, USA.
[71]Witten, I., & Frank, E. (2005). Data Mining: Practical Machine Learning Tools and Techniques: Morgan Kaufmann.
[72]Xiao, X., & Ni, L. M. (1999). Internet QoS: a big picture. IEEE Network, 13(2), 8-18. [73]Yang, L., Dai, Y., & Zhang, B. (2008). Reliability Oriented QoS Driven Composite
Service Selection Based on Performance Prediction. Paper presented at the Intl Conference on Software Engineering Knowledge Engineering (SEKE'08), San Francisco, CA, USA, July 1-3, 2008.