MSI_1407
Patents as quality signals?
The implications for financing
constraints on R&D
Patents as Quality Signals?
The Implications for Financing Constraints on R&D*
Dirk Czarnitzki
a,b,c, Bronwyn H. Hall
d,eand Hanna Hottenrott
f,a,caKU Leuven, Dept. of Managerial Economics, Strategy and Innovation, Leuven, Belgium bCenter for R&D Monitoring (ECOOM) at KU Leuven, Belgium
cCentre for European Economic Research (ZEW), Mannheim, Germany dUC Berkeley and NBER, United States
eMaastricht University, The Netherlands
fDüsseldorf Institute for Competition Economics (DICE), Germany
February 2014
Abstract
Information about the success of a new technology is usually held asymmetrically between the research and development (R&D)-performing firm and potential lenders and investors. This raises the cost of capital for financing R&D externally, resulting in financing constraints on R&D especially for firms with limited internal resources. Previous literature provided evidence for start-up firms on the role of patents as signals to investors, in particular to Venture Capitalists. This study adds to previous insights by studying the effects of firms’ patenting activity on the degree of financing constraints on R&D for a panel of established firms. The results show that patents do indeed attenuate financing constraints for small firms where information asymmetries may be particularly high and collateral value is low. Larger firms are not only less subject to financing constraints, but also do not seem to benefit from a patent quality signal.
Keywords: Patents, Quality Signal, Research and Development, Financial
Constraints, Innovation Policy
JEL-Classification: O31, O32, O38
Corresponding author:
Hanna Hottenrott, Düsseldorf Institute for Competition Economics (DICE), Heinrich Heine University, Universitätsstrasse 1, 40225 Düsseldorf. Email: [email protected]; Tel : +49 211 81-10266 | Fax: + 49 211 81-15499
*The authors thank Thorsten Doherr for help with retrieving the patent data and participants at the CONCORDi 2013 (Seville, Spain) for helpful comments. Hottenrott appreciated research funding from the Flemish Science Foundation (FWO).
1
1
Introduction
A view widely held by economists and entrepreneurs is that investments in research and development (R&D) are discouraged by imperfections in capital markets. The main reason is that information about the success of a new technology is usually held asymmetrically between the R&D performer and potential lenders and investors, making it difficult for these outsiders to judge the R&D-performing firms’ quality (Arrow 1962). This raises the cost of external capital and makes it in some cases impossible to obtain financing for projects that would have a positive expected net present value if normal interest rates or even the cost of internal funds were used to estimate it. In the light of this phenomenon, an increasing number of academic studies have attempted to understand, identify, and explain the occurrence of financing constraints for R&D and innovation.1 Drawing on the concept of job market signals (Spence 1973), several studies have suggested that patents provide signals to external investors that mitigate such financing constraints. As lenders may be able to derive probabilities for the success of R&D-active firms across certain industries, but usually have difficulties assessing the value of R&D activities of individual firms, the role of quality signals thus lies in their potential to reduce information asymmetries by providing a “sorting mechanism”. Signals thus help outsiders to derive expectations about the quality of the firm that cannot be directly observed. Due to the inherent characteristics of the R&D process, when evaluating R&D-intensive firms, external lenders and investors therefore usually have to rely on observable firm characteristics which are presumably correlated with the not easily observable properties like those directly related to the R&D project(s) and their success. Long (2002) was among the first to argue that patents are an effective instrument for reducing information asymmetries between the patenting firm and outside investors. Patents have properties that may make them ideal candidates as proxies for the quality assessment of R&D-active firms: they are costly to obtain, easily observable and verifiable by outsiders. If lenders believe that patents correlate with other, less easily observable firm characteristics which are not necessarily
1 See Hubbard (1998), Hall and Lerner (2010) and Czarnitzki and Hottenrott (2010) for surveys of the
2
directly related to the inventions, patent counts may work as signals for otherwise unobservable or difficult-to-measure attributes, such as knowledge capital or the productivity of R&D spending. Moreover, the patenting process may help to reveal information about technological discoveries and their potential value that otherwise would be more difficult to convey to lenders and investors. The ability to convey information credibly to outsiders at relatively low cost may therefore be a highly valuable function of patents (Long, 2002, Arora et al. 2001).
Previous research that has studied the signaling value of patents has focused mainly on start-up firms in high-tech industries. This literature usually finds a positive relationship between patents and Venture Capital (VC) financing (e.g. McMillan 1985; Baum and Silverman 2004; Mann and Sager 2007, Hsu and Ziedonis 2007, Haeussler et al. 2009; Conti et al. 2013). While the evidence for patents as a quality signal for attracting VC financing concludes that they do indeed function that way, the evidence for the impact of patents on obtaining later stage financing, such as for the success of initial public offerings (IPOs), is rather mixed (Deeds et al. 1997; Stuart et al. 1999; Heeley et al. 2007).
This paper contributes to the existing literature by providing panel data evidence for a large sample of established, R&D-active firms. To our knowledge, it is the first to look at established firms rather than start-ups. Moreover, it is among the first papers to study the relationship using patents filed at the European Patent Office rather than the US Patent and Trademark Office. We employ a methodology that allows studying financing constraints in the market for bank finance as bank loans constitute the major external financing source for firms in most European countries.
More precisely, the study adds to previous research on the topic by investigating a large sample of R&D-active firms from the Flemish part of the OECD R&D survey in a broad range of industries comprising both small and large firms. We estimate panel data models for the period 2000 to 2009 that allow us to control for unobserved firm-specific effects. The results show that patents indeed attenuate financing constraints. This holds for the patent stock of the firms as well as for recently filed patents. As patents may be particularly useful in reducing information asymmetries between firms and lenders when
3
information asymmetries are large and when alternative ways of achieving credibility are limited, we expect small firms to benefit more from patent signals than larger ones. In line with these expectations, we find the effects to hold only for small firms with less than 50 employees. Larger firms are not only less subject to financing constraints in the first place, but also do not seem to benefit from a patent quality signal.
This article proceeds as follows. Section 2 outlines the motivation for this research and briefly summarizes related research. Section 3 sets out the conceptual framework of our analysis and section 4 describes the data. The econometric set-up, our model specifications and the results are described in section 5. Section 6 concludes.
2
Capital Market Imperfections and the Signaling Value of Patents
2.1 The role of internal finance for R&D
Generally a firm is considered to be financially constrained if it cannot carry out its R&D activities at desired scale and scope due to a lack of financing availability or a very high cost of financing. Unlike most investment in tangible goods, R&D projects are characterized by high and usually firm specific investments, on the one hand, and low collateral value, on the other hand. Before willing to grant a loan, banks usually require some degree of collateral value. Especially small, R&D-active firms may fail to provide sufficient collateral value to lenders that would back potential loans. Additionally, information asymmetries between the R&D-active firm and lenders adversely affect financing conditions. Information asymmetries may be particularly severe in case of small firms for which credibly conveying information regarding their technological capabilities and overall creditworthiness is hard. As argued by Berger and Udell (1998), “unlike large firms, small firms do not enter into contracts that are publicly visible or widely reported in the press – contracts with their labor force, their suppliers, and their customers are generally kept private”. Moreover, small firms usually do not issue traded securities that are continuously priced in public markets and often do not have audited financial statements that are available to providers of outside finance.
Consequently, it is relatively more expensive for lenders to collect information on small firms, who usually apply for loans of relatively small amounts, where cost is measured by
4
screening costs per borrowed or invested Euro. Likewise, small firms face a relatively high cost of providing information to lenders as doing so requires scarce human, financial and time resources. As a result, small firms may have larger difficulties to credibly convey their quality to outsiders than larger firms.
If instead of detailed assessment, lenders consider average project quality in the market to assess a firm’s R&D quality, this may result in a “lemon’s premium” for above-average projects increasing financing costs even for the most promising firms (Leland and Pyle, 1977). Constrained firms therefore (have to) rely to a larger extent on internal resources when financing their R&D than firms that mainly invest in capital goods (Hall 1992; Himmelberg and Peterson 1994; Harhoff 1998; Bougheas et al. 2003; Levitas and McFayden 2009; Czarnitzki and Hottenrott 2011a) constraining R&D projects especially for firms whose internal financial sources are limited and whose innovation potential is high (Brown et al. 2012; Borisova and Brown 2013; Czarnitzki and Hottenrott 2011b, Hottenrott and Peters 2012). Not surprisingly, earlier empirical evidence supported the view that small firms in particular encounter difficulties financing R&D leading to delayed, canceled or postponed projects (Carpenter and Petersen 2006; Schneider and Veugelers 2010; Czarnitzki and Hottenrott 2011a).2 In line with these previous insights we thus hypothesize that
Hypothesis 1: Small R&D-active firms are more likely to be financially constrained in their R&D investment than larger R&D-active firms. Thus, small firms’ R&D investments should be more sensitive to internal liquidity those of larger firms.
2 One might think that this lack of access to debt would lead to firms issuing equity. However, small firms
may be particularly reluctant to issue equity, even if this excludes them from certain projects. In Belgium, as in many other European countries, raising equity for financing investment projects generally appears to be disfavored and only relatively few firms are listed at stock exchanges. Particularly small, family owned firms view issuing of new equity as not particularly desirable as it dilutes their ownership position. For example, Deloof and Jegers (1999) point out there were no public issues of a straight bond by a Belgian company between 1990 and 1995. Borrowing from banks is the most common form of raising funds for investment besides internal sources such as intra-group loans (see for example Deloof 1998).
5
2.2 The role of patents
If firms engaged in complex R&D projects that require a high degree of specialized skills to understand the technological details seek access to external financing, lenders and investors usually have to rely on observable firm characteristics which are presumably correlated with not easily observable properties like those directly related to the firms’ R&D project(s). Because it can be costly and difficult for potential lenders to assess the value and thus the creditworthiness of a firm, quality signals may be used intentionally or unintentionally to reduce cost and effort devoted to quality assessment of the firms. Signals may provide a “sorting mechanism” based on an easily observable attribute that allows deriving expectations about qualities of the firm that are not immediately observable.
Long (2002) argued that patents are effective for reducing information asymmetries between the patenting firm and outside investors. She distinguished “the simple view of intellectual property rights” that regards patents as an exchange of information for compensation in the form of protection, from a broader view that considers patents also as a tool to credibly convey information about the underlying innovation. The argument is based on the fact that patents have properties that may make them good and readily available proxies for the quality assessment of R&D-active firms. First, patents are costly to obtain (not so much in terms of fees, but rather in the R&D needed to come up with a patentable invention), and are easily observable and verifiable for outsiders. Myers and Majluf (1984) stressed the importance of supplying a “verifiable detail” to convey information. Patents are publicly available documents that minimize information costs for potential lenders and investors and since penalties for intentionally misrepresenting information in a patent application are severe, outsiders know that the information contained in a patent has some credibility (Long 2002).
Second, if lenders assume that patents correlate with difficult-to-measure firm characteristics which do not necessarily have to be directly related to the firms’ patented inventions, patents may signal otherwise unobservable or difficult-to-measure attributes. For instance, patents provide information about the firms’ ability to perform valuable research as patents measure the outcome of past R&D and thus “advertise” the firms’ innovative capabilities. For an invention to be patentable at the European Patent Office, it must be new, industrially applicable and involve an inventive step. These requirements and the fact that
6
patent applications need to be approved by the patent office through a certification process, suggest that possessing a patent is the result of successful previous R&D, hence signaling the general R&D competencies of the firm (Stuart et al. 1999).3 Henderson and Cockburn (1994), for example, used patent counts to measure the research competencies of firms in the pharmaceutical industry and Harhoff (2009) argues that patents may signal the quality of the firms’ R&D staff and its ability to handle intellectual property rights. Moreover, market value studies typically find that both R&D expenditures and patent stocks correlate positively with firms’ market value, and that patent stocks add information on the value of firms’ knowledge assets beyond R&D stocks (Hall 2000; Czarnitzki et al. 2006). Thus, lenders may use patent counts to extrapolate the future value of the firm. In addition, firms owning a patent experience a larger growth rate than firms not owning a patent and this relationship has been shown to be stronger for small patentees in the UK (Helmers and Rogers 2011).
Levitas and McFayden (2009) note that patents raise the prospects of future cash flows and as patents protect firms - at least to some extent - against competition, they may be expected to earn higher profit margins in the future. Moreover, since patents facilitate the licensing of technology, patents may signal additional returns to the patented technologies (e.g. Kulatilaka and Lihui 2006).
Almost more important than the profitability of the firm for lenders is the survival of the firm. The high risk of bankruptcy is one reason why small and young firms face difficulties in raising external financing. Cockburn and Wagner (2007) show that possessing patents is positively correlated with the survival of the firm and Mann and Sager (2007) also find a positive relationship between patenting activity and several success measures among which survival.
3 The threshold for patentability in the United States is considered by some observers to be low, especially
in IT-related sectors (Jaffe and Lerner, 2004), which casts doubts on the signaling value of patents. The threshold is considered to be higher in Europe (van Pottelsberghe de la Potterie 2011). In addition, Haeussler et al. (2009) argue that European patents are approximately 5 to 10 times more expensive than U.S. patents. However this is a controversial area, and there exist dissenters (Christie et al. 2013). Hall et al. (2007) find that the valuation of US and EPO patents in US and European firms is fairly similar.
7
From the perspective of the firm, a reluctance to disclose innovation-related information to outsiders because of fear of imitation by competitors may exist (Bhattacharya and Ritter 1983; Anton and Yao, 1998), so that one would expect rational firms to seek patent protection only if the expected returns from the patent outweigh the costs of disclosing the information. If patents, however, have some signaling value, firms may be willing to disclose the information on their inventions in patent applications not only in exchange for being able to exclude others from using the information in certain ways, but also in order to reduce informational asymmetries between themselves and outsiders. Being aware of such a signaling value, firms may apply for patents to signal information about themselves and their R&D that would be more expensive or even impossible, or less credible when revealed in other contexts. This may explain why firms (and especially small and young companies) patent even when the need to exclude others is not important because of high cost of imitation. Moreover, because of the comparatively higher burden of obtaining a patent for small firms, it provides an even stronger patent signal to external parties. Finally, patents may also signal some salvage value that will be available if the firm goes bankrupt. However, it can be argued that the true collateral value is very difficult to assess and that therefore the signal stems more from the fact that patents make research output “as tangible as it gets”.
Based on these arguments, we hypothesize that patents have some signaling value that helps the firm obtain finance:
Hypothesis 2: Firms’ past patenting activities alleviate financing constraints.
We will measure the presence of these constraints via the sensitivity of firms’ R&D investment to the availability of internal finds. Additionally, the previous considerations lead us to hypothesize that small firms benefit more from the existence of patent signals than larger firms. Thus, we further hypothesize the following:
Hypothesis 3: Firms’ past patenting activities are more important for alleviating financing constraints for small firms’ than for larger firms.
A crucial feature of a patent is that it signals hidden attributes of the firm that lenders assume will increase the value of the firm or may make it likely that the firms will repay its debt, even if the value gain is not directly related to the patent. For example, having a
8
patent may constitute a competitive advantage through being a first-mover in the industry (Bessen and Maskin 2009). According to Long (2002) this might explain why industries in which competitive advantage in product markets is often derived from being a first mover, such as semiconductors and information technology, are also among the industries in which patenting is most active (Hall and Ziedonis 2001). Further, it might explain why small firms, which usually face greater informational asymmetries in capital markets than large firms, tend to patent relatively more intensely than large firms, even though they tend to enforce their patents less (Griliches et al. 1987; Mansfield 1986).4 Importantly, Lemley (2000) argues that venture capitalists use patent applications as evidence that the company is well managed, is at a certain stage in development, and has defined and carved out a market niche, rather than attributing a certain value to the patent itself. Similarly, patents may simply indicate the firm’s confidence in its research which may not be necessarily related to the relevance of the technology for future inventions. Thus, if patents constitute a quality signal, we expect that
Hypothesis 4: The signaling value is related to the existence of the patent (application), but unrelated to the technology’s ex-post value.
2.3 Empirical evidence
Since the work of McMillan (1985) patents have been recognized as a relevant selection criterion for Venture Capital (VC) investors. A considerable number of studies has since supported the hypothesis of a positive relationship between the patent stock of high-tech start-ups and the amount of VC funding received.
Hall and Ziedonis (2001) interview executives in the U.S. semiconductor industry and find that they consider patent rights to be of significant importance in attracting VC funding. Similarly, Baum and Silverman (2004) show a positive relationship between patent applications at the US Patent Office and VC financing. However, they conclude that the importance of patents in this regard varies across industries. Mann and Sager
4 This argument applies to small producing firms. There is other evidence that small non-producing firms
9
(2007) analyze the relationship between patenting of software start-up firms and the progress of those firms through the VC cycle and find significant and robust positive correlations between patenting and the number of financing rounds, total investment, as well as the receipt of late stage financing. Interestingly, they find that the effect of patents depends less on the size of the patent portfolio than on the firm’s receipt of at least one patent. Hsu and Ziedonis (2007) argue that patents can increase the perception about the value of start-ups. They find that start-ups active in technology-intensive industries that have a higher patent application stock are more likely to attract initial funding from a prominent venture capitalist. In other words, their results suggest that signaling quality via patenting may benefit start-ups most in early stages of development when technological uncertainty is high and financial constraints are most binding.
Using a sample of German and British biotechnology companies, Haeussler et al. (2009) find that VC funding happens earlier when patent applications are present. Levitas and McFayden (2009) suggest that patents signal the firms’ invention and innovation competencies and facilitate access to external financing as they observe that patent owning firms seem to rely less on accumulating large cash holdings to fund their (future) R&D projects. Most recently, Conti, Thursby and Rothaermel (2013) find for a sample of start-up firms in the incubator of the Georgia Institute of Technology that those with patents obtain more external financing and conclude that patents serve as a signal for venture capitalists. Likewise, Conti, Thursby and Thursby (2013) conclude that patents serve to attract new investors and are intended for that purpose by Israeli start-up firms. This signal, however, is only effective for venture capitalists, but not for private investors. While previous research usually found a positive relationship between patents and VC financing, evidence for later stage financing is rather ambiguous. Examining the IPO performance of biotechnology start-ups, Deeds et al. (1997) find no effects of patents on the amounts raised in an IPO and conclude that patents may only be “noisy” signals that do not really affect the expectations of public investors. Stuart et al. (1999) observe that biotechnology start-ups advertise their patent filings when aiming at initial public offerings (IPOs) although these authors also find that patents have minimal effect on market value of new biotechnology listings. Likewise, Heeley et al. (2007) find contradictory results concluding that patents can serve as signaling devices in sectors
10
such as biopharmaceuticals and chemicals, while they find no such evidence for information technology (IT) firms.
The motivation for the following study is thus based on two aspects that have not been addressed by previous research. First, this study is the first to use panel data evidence for a large sample of established, R&D-active firms. A substantial body of previous research on financing constraints for R&D reported evidence for such constraints not only for young, start-up firms, but also for more established firms. However, no study examines the role of patents for mitigating financing constraints for these firms. Second, the following study is among the first to look at this question using patents filed at the European Patent Office.
3
Conceptual Framework
Following on the seminal work of Fazzari et al. (1988), many econometric studies have approached the detection of financing constraints by comparing different groups of firms in terms of their investments’ sensitivity to internal financing. While this approach was initially applied for any type of investment, later studies have adopted the methodology analogously to investment in R&D (e.g., Hall 1992; Himmelberg and Peterson, 1994). For the group of supposedly unconstrained firms, R&D spending should not be as sensitive to the availability of internal funds as the R&D of constrained firms, as the former group is able to raise financing externally. Recent research further stressed the importance of R&D smoothing through cash holdings especially for firms that are most likely to face financing frictions (Brown and Peterson 2011; Brown et al. 2012). In line with this methodology5, we set up an empirical model that allows us to distinguish
5 It should be noted that like it would have been desirable to estimate dynamic panel data models since
theoretical investment models are typically based on the inter-temporal optimization problem considering the size of investment and the level of (R&D) capital stock (see Brown and Peterson 2011; Brown et al. 2012). An application of such method would, however, require four consecutive observations per firm in order to conduct meaningful panel regressions. Our panel data is, however, not only unbalanced but has also gaps in the time-series structure because firms did not necessarily respond to the surveys in adjacent years. Therefore, we found it impossible to estimate dynamic models as additional concerns arise with respect of the validity of such methods when used for unbalanced panels.
11
differences in R&D investments’ sensitivity to internal liquidity due to heterogeneity in firm size. We measure internal liquidity by the firms’ working capital which includes cash holdings. In particular, we distinguish between large and small firms where “small” is defined using the European Commission definition, namely that the firm has fewer than 50 employees. We estimate separate equations for small and large firms’ investment to identify differences in the reliance of firms on internal funds, on the one hand, and difference in the effects of firms patenting activity on access to external financing, on the other. We expect a positive relationship between firms’ liquidity and the firms’ expenditures in R&D. For small firms, however, we would expect financial constraints to be binding in the sense of a stronger sensitivity of investment to liquidity reflecting that these firms are constrained in the level of their R&D activity by their internal funds. In other words, we interpret a positive sensitivity of R&D investment to internal resources as an indication of lack of access to external financing.
If patents serve as a quality signal the firms’ stocks of patents (or the number of pre-period patent applications)6 should reduce the firms’ reliance on internal funds for their R&D investments. More precisely, we would expect that the interaction term between patents and internal funding is negative, (partially) off-setting the positive effect of internal liquidity.
4
Data
The following analysis uses unique database that we constructed based on several sources: the Flemish R&D survey, the OECD/EPO patent citations database, and the Bureau van Dijk BELFIRST database.
Information on firms’ R&D-related activities comes from the Flemish part of the OECD R&D survey. This survey is harmonized across OECD countries and is conducted every second year in order to compose the OECD Main Science and Technology Indicators.
6 Harhoff (2009) argues that patents do not necessarily have to be granted yet in order to work as a signal as
even patent applications reveal information and require money and time. Hence, we use patent applications rather than granted patents in the subsequent analysis.
12
The sampling population from which the survey sample is drawn targets all R&D-active companies in Flanders. Our analysis is based on repeated cross sections that form an unbalanced panel from five consecutive waves of the R&D survey covering the period from 2000 until 2009. Each wave provides information at the firm level for two consecutive years. The definition of research and development used in the survey is based on the definition of the OECD Frascati Manual (1993, 2002) which frames the methodology for collecting and using statistics about R&D in OECD countries.
Patent information comes from a database issued by the European Patent Office (EPO), the “OECD/EPO patent citations database” (Webb et al., 2005). This database covers all patents applied for at the EPO since its foundation in 1978 as well as all patents applied for under the Patent Cooperation Treaty (PCT) in which the EPO is designated, so-called “Euro-PCT applications”. Additionally, information from the Belgian patent office was used to include information about patents filed in Belgium only. Patent data is available as a time series from 1978 until the end of 2011.
The accounting and balance sheet data for our firms stems from the BELFIRST database provided by Bureau van Dijk. BELFIRST is a comprehensive database that contains information on about 1.2 million active and non-active Belgian companies. Approximately half of the companies have financial account information; the remainders are generally individuals (sole traders).
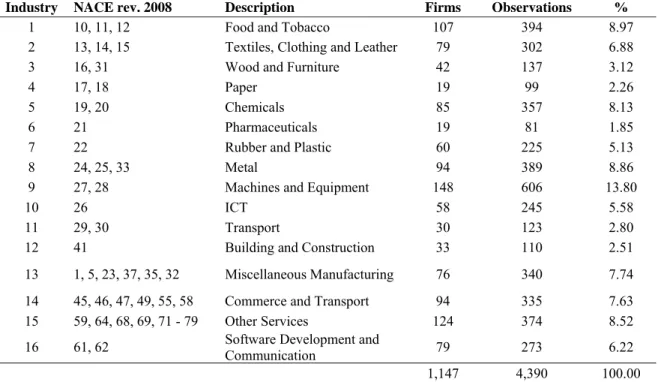
Our sample comprises firms that invested at least once in R&D during the panel period and are observed at least twice during that time. We require two years of data since we estimate simple panel data models that control for unobserved heterogeneity. On average, we observe each firm about 4 times in our panel. After eliminating data with missing values in the variables of interest and requiring the firms to be observed at least twice during the sample period, our final unbalanced panel consists of 4,309 unique firm-year observations referring to 1,135 different firms active in a broad range of industries.7
13
4.1 Variables
Firms’ R&D expenditures (more precisely, firms’ R&D intensity measured as R&D per tangible capital) serve as the dependent variable in the following analysis (R&D). We derive indicators for the firms’ capital structure from balance sheet information.8 The firms’ stock of working capital serves as a measure of operating liquidity. As suggested by Hall and Kruiniker (1995), using working capital instead of cash flow as a measure of firms’ liquidity is preferable, because it is a better indicator of the funds available for investment.9 Although working capital is affected by cash flow, working capital is a more precise liquidity indicator when it comes to investment decisions as it also includes not only cash but also values that can relatively easily be converted into cash. Thus, the advantage of working capital compared to cash flow is that it is an accumulation rather than a flow parameter. More precisely, working capital (WCAP) is the net amount of short
term assets, i.e. the difference between current assets minus current liabilities of a firm. For the purpose of the following study, we make use of a measure that is to a high degree comparable across firms in our sample and not biased by accounting options. Hence, we employ a stricter definition and calculate WCAP = cash + inventories + accounts
receivable – accounts payable.10 Other short term assets (such as other current assets, prepaid expenses, deferred charges) and liabilities such as other short term debt and other creditors are not included. The higher the working capital the more secure is a firm’s liquidity and accordingly its financial flexibility. This variable can take positive or negative values. A positive working capital means that short term liabilities are covered by current assets (accounts receivable and inventory) whereas a negative working capital indicates that a firm’s current assets are not sufficient to cover its current liabilities.
8 These accounts follow the Belgian GAAP on an annual basis.
9 The appropriateness of cash flow as an indicator for financial liquidity and the interpretation of the
sensitivity of R&D investment to changes in cash flow has been intensely criticized in the literature (Hao and Jaffe 1993; Fazzari and Petersen 1993; Kaplan and Zingales 1997, 2000). Especially for large firms, cash flow levels may be determined by accounting practice as well as by dividend policies (Jensen and Meckling 1976; Jensen 1986).
10 Accounts receivable and accounts payable are termed Trade Debtors and Trade Creditors in the data
14
In addition, we obtain firm’s debt, more precisely the longer-term liabilities of the firm which consist of all non-current liabilities payable later than one year, to control for credit market access. For the variable DEBT, we use a two period lag as debt is measured at the end of the year t–2, so that its visibility to potential lenders is effective in t–1. We calculate the firms’ debt-to-tangible assets ratios (DEBTRATIO) rather than debt-to-equity ratios as the former type is more meaningful in terms of reflecting the firms’ liabilities relative to the firms’ collateral value. Thus, as common in the literature, we scale the dependent variable as well as WCAP and DEBT by firms’ assets (see e.g. Fazzari et al.
1988; Fazzari and Petersen 1993; Harhoff 1998). We use tangible assets (K)from the firm
accounts, which excludes intangible assets, financial assets, and current assets.
Our measure of the key variable, patenting activity, is computed as the stock of patent applications made by the firm. We compute this quantity for each firm and year as a perpetual inventory of past and present patent applications of the firm with a constant depreciation rate (δ) of 15 percent, as is common practice in the literature (see Griliches and Mairesse, 1984):
, (1 ) , 1 ,
i t i t i t
PATSTOCK PATSTO KC PATAPPS (1) We also control for firm size measured in terms of the firms’ tangible assets, measured as the log of those assets. Larger firms may be able to realize economies of scale and scope when doing R&D activities. Because R&D investment may also depend on the life cycle of the firm, and younger firms are often observed to invest relatively more in R&D than older firms, we control for age-related effects by including the log of age, ln(AGE).
Additionally, the dummy variable GROUP is included to take into account that firms that
are part of an enterprise group may conduct more R&D since firms associated with a group can benefit from intra-firm knowledge spillovers as well as from R&D funding through intra-group sources. A set of yearly time dummies is included to take business cycle effects into account and 16 sector dummies on basis on the European standard industry classification (NACE) are included to capture differences in technological opportunities that determine R&D investment. To avoid simultaneity bias due to feedback effects from the dependent variable to current explanatory variables, we use lagged values of all time-varying independent variables (with the exception of AGE).
15
4.2 Descriptive statistics
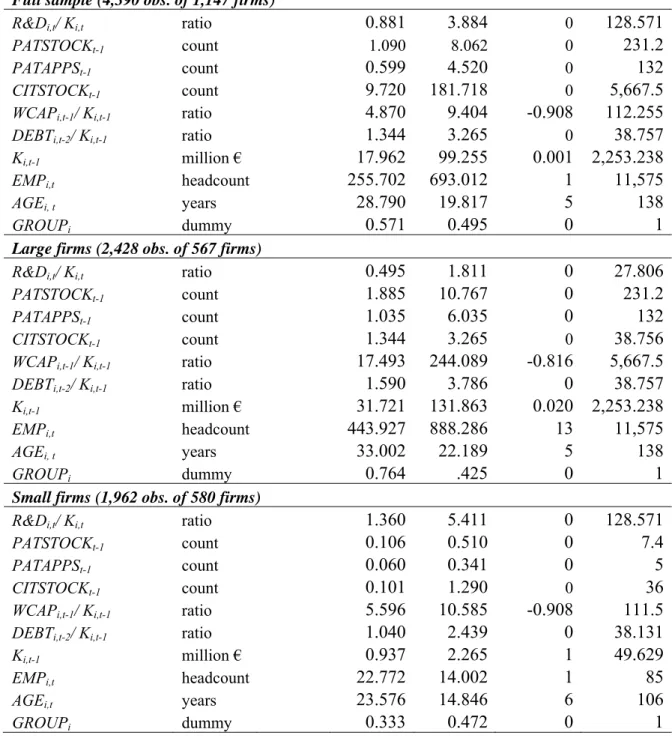
Table 1 presents the descriptive statistics for these variables for the full sample as well as for the groups of small and larger firms separately. We define small firms as those whose employment averages less than 50 during the sample period, which is essentially the definition used by the European Commission. Out of total 4,390 firm-year observations about 45% refer to small firms.
Average R&D to tangible assets ratio in the full sample is 0.88 which correspond to an annual R&D spending of about 3 million, on average. Median spending is much lower, however, with about 132.5 thousand euros (not reported). A bit more than 20% of the observations stem from patent-active firms, that is they filed at least one patent in the sample period. The average patent stock is 1.09 and firms file on average 0.6 patents per year. This value is higher in the group of patent-active firms, i.e. firms with at least one patent application with 2.9 patents per year (not reported). The firms’ long term debt is around 22 million euros on average resulting in a mean debt to tangible assets ratio of 1.34; the median is much lower at a ratio of 0.52. The working capital to tangible assets ratio is 4.87 and firms employ on average 256 employees (median = 64). Firms’ mean age is close to 29 years and remarkably 57% of the firms are part of an enterprise group. When splitting our sample into small and larger firms, we see interesting differences in the main variables between these two groups. Small firms have significantly (at 1% level) higher R&D expenditures to tangible assets ratios, smaller patent stock and fewer patent applications in a given year. Small firms’ patents receive significantly fewer citations, reflected in smaller citations stocks. Moreover, these firms are younger, more often independent ventures and have lower debt ratios (DEBT/K), on average. The amount of working capital is significantly lower for the sub-sample of small firms, but the mean of the working capital to tangible assets ratio is larger for the group of small firms.
16
Table 1: Descriptive Statistics (main variables)
Variable Units Mean Std. Dev. Min Max
Full sample (4,390 obs. of 1,147 firms)
R&Di,t/ Ki,t ratio 0.881 3.884 0 128.571
PATSTOCKt-1 count 1.090 8.062 0 231.2
PATAPPSt-1 count 0.599 4.520 0 132
CITSTOCKt-1 count 9.720 181.718 0 5,667.5
WCAPi,t-1/ Ki,t-1 ratio 4.870 9.404 -0.908 112.255
DEBTi,t-2/ Ki,t-1 ratio 1.344 3.265 0 38.757
Ki,t-1 million € 17.962 99.255 0.001 2,253.238
EMPi,t headcount 255.702 693.012 1 11,575
AGEi, t years 28.790 19.817 5 138
GROUPi dummy 0.571 0.495 0 1
Large firms (2,428 obs. of 567 firms)
R&Di,t/ Ki,t ratio 0.495 1.811 0 27.806
PATSTOCKt-1 count 1.885 10.767 0 231.2
PATAPPSt-1 count 1.035 6.035 0 132
CITSTOCKt-1 count 1.344 3.265 0 38.756
WCAPi,t-1/ Ki,t-1 ratio 17.493 244.089 -0.816 5,667.5
DEBTi,t-2/ Ki,t-1 ratio 1.590 3.786 0 38.757
Ki,t-1 million € 31.721 131.863 0.020 2,253.238
EMPi,t headcount 443.927 888.286 13 11,575
AGEi, t years 33.002 22.189 5 138
GROUPi dummy 0.764 .425 0 1
Small firms (1,962 obs. of 580 firms)
R&Di,t/ Ki,t ratio 1.360 5.411 0 128.571
PATSTOCKt-1 count 0.106 0.510 0 7.4
PATAPPSt-1 count 0.060 0.341 0 5
CITSTOCKt-1 count 0.101 1.290 0 36
WCAPi,t-1/ Ki,t-1 ratio 5.596 10.585 -0.908 111.5
DEBTi,t-2/ Ki,t-1 ratio 1.040 2.439 0 38.131
Ki,t-1 million € 0.937 2.265 1 49.629
EMPi,t headcount 22.772 14.002 1 85
AGEi,t years 23.576 14.846 6 106
GROUPi dummy 0.333 0.472 0 1
5
Econometric Analysis
In the following econometric analysis, we estimate censored panel regression models as not all of our firms in the sample perform R&D in each year which results in a
left-17
censoring of the dependent variable. Small firms especially may conduct R&D only on an irregular basis. Indeed, in our sample the number of censored observations is larger in the group of firms with fewer than 50 employees. Thus, we estimate random effects Tobit models that can be written as
2
max 0, , 1, 2, , , 1, 2, , | , 0, it it i it it i i u y x c u i N t T u x c N (2)where y denotes the dependent variable, x the set of regressors, c a firm-specific time-constant effect, and u the usual random error term. The parameters to be estimated are denoted by the vector .
The first specification of the model to be estimated assumes that there is no correlation between c and x (see Wooldridge, 2002, pp. 540-541, for further technical details).11 As this assumption can easily be challenged, we relax the assumption of uncorrelatedness between x and c following Wooldridge (2002) through modifying the model by adding “within” means of each of the time varying covariates to the set of regressors to proxy “quasi-fixed effects”. Thus, if ci xiaiwe can write
max 0, it it i i it y x x a u (3) with | ,
0, 2
and
0, 2
. it i i u i a u x a N a N The appropriateness of the Wooldridge model, i.e. that the assumption of uncorrelatedness between the firm-specific effect and the regressors is not valid, will be tested by the joint significance of the x-variables’ “within” means.
The basic model for R&D investment is specified as:12
11 Note that it is not useful to estimate a fixed effects Tobit model, as the maximum likelihood estimator of
this model is not consistent (see e.g. Cameron and Trivedi 2005).
12 Although the model contains a time-invariant firm-specific effect we also include the time-invariant
regressors GROUP and the industry dummies, as the firm-specific effect is treated as a random component in the estimation.
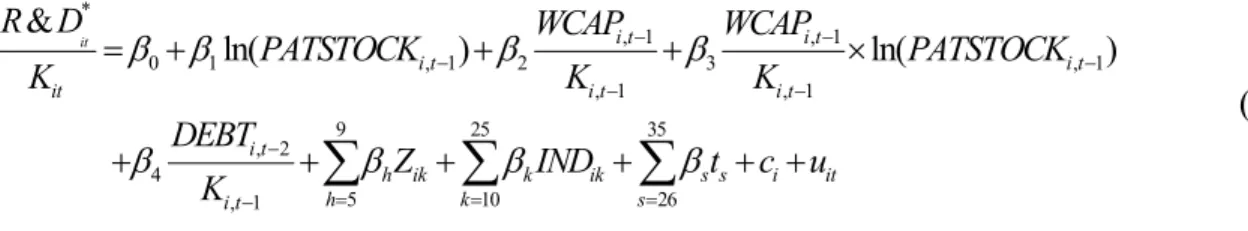
18 * , 1 , 1 0 1 , 1 2 3 , 1 , 1 , 1 9 25 35 , 2 4 5 10 26 , 1 & ln( ) ln( ) it i t i t i t i t it i t i t i t h ik k ik s s i it h k s i t R D WCAP WCAP PATSTOCK PATSTOCK K K K DEBT Z IND t c u K
(4)Where Zik corresponds to the set of firm level control variables including SIZE in terms of tangible assets, AGE and GROUP. INDik comprise the industry dummies and ts the set of year dummies. The model for the observable R&D/Kratio is the following:
* & if 0 & 0 otherwise. it it i it it it it R D x c u R D K K (5)
We include an interaction term of the working capital ratio and the patent indicator to measure the impact of patenting activity on the firms’ sensitivity in R&D investment to the availability of internal liquidity as captured by working capital. The patent indicator
PATSTOCKi,t-1measures the firms discounted patent stock as described above at period t-1. We employ the natural log of PATSTOCKi,t-1, i.e. ln(PATSTOCK+1) in the estimations to account for the skewness of the patent distribution. One may also include an indicator that captures recent patenting activity, i.e. a dummy for new patent applications
(PATDUMMY) that takes the value one if the firms filed for at least one patent in t-1.
5.1 Estimation Results
The results of the random effects panel model are presented on the left hand-side of Table 2 and the results for the model that allows for correlated effects by including the within sample means of the time variant firm characteristics are presented on the right panel. Table 2 shows the results of the specification with the PATSTOCK variable as outlined above. The first and fourth columns present the results for the full sample, columns two and five show the results for small firms and columns three and six for larger firms. First, it should be noted that the tests of whether x and c are uncorrelated are rejected for the regressions for both subsamples (tests on joint significance on within means). Thus, we would prefer the Wooldridge generalization of the random effects model over the
19
‘traditional’ random effects model. In the following, we therefore limit our discussion to these results.
As can be seen in Table 2, we observe a significant positive coefficient on lagged working capital intensity for the full sample. The sample split models, however, indicate that this effect is mainly driven by small firms. In line with previous literature identifying financing constraints by investments’ sensitivity to internal liquidity, we may interpret the different size in the coefficients between small and large firms as an indication that smaller firms are more dependent on internal means for financing their R&D (supporting Hypothesis 1).
The patent stock itself is positively and significantly related to R&D spending in the full sample and for larger firms. Our main attention is directed at the interaction effect between the firms’ past patent activity and the firm’s liquidity. As can be gathered from Table 2, the sign of the coefficient of the interaction term (WCAP t-1 / K t-1)* ln(PATSTOCKt-1)
is negative and significant, but only in the sample of small firms. Its negative sign suggests that the firm’s patent stock helps to reduce the dependence on working capital (supporting Hypothesis 2 and 3). This “mitigation” effect is robust to the inclusion of controls for correlated fixed effects. In terms of the magnitude of the mitigation effect, we see that the interaction coefficient of -0.105 when compared to the working capital coefficient of 0.175 corresponds to about two-thirds of the initial effect. In other words, the larger a small firm’s patent stock, the lower its dependency of internal liquidity when investing in R&D. In terms of marginal effects, we also find that the patent stock has a significant economic impact on investment. Consider a small firm that does not hold any patents and has otherwise average firm characteristics including an average value of
WCAP/K. Now suppose it is hit by a shock in liquidity such that its value of WCAP/K is reduced by one standard deviation. As a consequence, its R&D investment to tangible assets ratio is expected to decline by about 48%, other things equal. If, however, the same liquidity shock hits a small firm that patents at the average value of the patent stock distribution in the sample, its investment to assets ratio would only reduce by 23%. Thus, the significant coefficient estimates of the liquidity, the patent stock and their interaction, also translate into economically significant results.
20
These insights are robust to the altering the specification using a dummy variable for recent patenting activity only.13 Thus, in general, small firms depend highly on their internal resources, but having patent applications alleviate the constraint, on average. Thus, whatever attributes of the firms patents are assumed to correlate with, the signal seems to be positive. In line with previous studies, we find that liquidity is less associated with R&D in larger firms. In addition, although the past patent stock is strongly associated with current R&D intensity, patents have no impact on the small liquidity coefficient, suggesting that there is no signaling role of patents for large firms.
The control variables show the expected signs. Among the larger firms, more physical capital-intensive firms invest less in R&D, while group membership is positively associated with R&D for small firms. Not surprisingly, industry is a strong predictor of R&D spending. Interestingly, for the sub-sample of small firms, we further find evidence for a sensitivity of R&D to business cycle movements as captured by the year dummies, while larger firms’ R&D spending seems less sensitive to fluctuations in the business cycle.14
13 Detailed results are available from the authors upon request. The χ2(3) for coefficient equality across
small and large firms is 82.6 for patent applications and 75.1 for the patenting dummy.
14 Note that Czarnitzki et al. (2011) used a subsample of this database for estimating to what extent R&D
subsidies mitigate financing constraints for R&D investment. In order to not distract the reader from the core issue of this paper, we omit the subsidy variable and further discussion about it in this empirical study. All results as reported hold when a subsidy variable is included in the regressions as in Czarnitzki et al. (2011).
21
Table 2: Estimation results from Tobit regressions of R&D intensity (R&D over tangible assets) on lagged patent stock
Random-Effects Panel Model Wooldridge Estimator
Variable full sample EMPL < 50 EMPL > 50 full sample EMPL < 50 EMPL > 50
ln(PATSTOCK)t-1 0.785*** 1.689*** 0.409*** 0.574** 1.353* 0.243*** (0.156) (0.610) (0.071) (0.203) (0.740) (0.086) WCAP t-1 / K t-1 0.111*** 0.159*** 0.008 0.115*** 0.175*** -0.001 (0.009) (0.016) (0.006) (0.010) (0.019) (0.007) (WCAP t-1 / K t-1)*ln(PATSTOCK)t-1 -0.051*** -0.105*** 0.001 -0.052*** -0.105*** 0.003 (0.010) (0.023) (0.005) (0.010) (0.023) (0.005) DEBT t-2 / K t-1 0.042** 0.104* 0.045*** 0.043* 0.085 0.045*** (0.021) (0.054) (0.010) (0.023) (0.062) (0.011) ln(Kt-1) -0.368*** -0.581*** -0.265*** -0.216 0.013 -0.422*** (0.062) (0.152) (0.044) (0.125) (0.248) (0.071) ln(AGEt) -0.120 -0.365 0.029 -0.096 -0.289 0.007 (0.181) (0.371) (0.111) (0.182) (0.373) (0.111) GROUPt 0.295* 0.695** 0.006 0.312* 0.661** -0.016 (0.168) (0.334) (0.099) (0.170) (0.337) (0.099)
Joint sign. of time dummies χ2(9) 23.0*** 22.1*** 13.2 23.9*** 25.1*** 14.2
Joint sign. of ind. dummies χ2(15) 102.2
*** 55.6*** 68.0*** 96.2*** 49.7*** 66.4***
Joint sign. of within means χ2(4) - - - 5.8 11.3
** 18.0***
Log-Likelihood -10,118.7 -5,093.6 -3,717.3 -10,115.8 -5,088.0 -3,708.4
(s.e.) 0.633 (0.015) 0.564 (0.025) 0.733 (0.017) 0.633 (0.015) 0.566 (0.024) 0.733 (0.016)
# observations 4,390 1,962 2,428 4,390 1,962 2,428
# censored observations 666 305 361 666 305 361
Notes: Standard errors are in parentheses. *** (**, *) indicate a significance level of 1% (5%, 10%). All models include an intercept (not shown). Coefficients of variables’ within means in Wooldridge model areomitted from the table. The value of indicates the share of the total variance which is due to the cross-sectional variation.
22 5.2 Patent signal or patent value?
The previous results suggest that patents affect the firms’ dependence on internal funds for conducting R&D for small firms. If this effect was due to a signaling value of patents then we would expect the effect is related to the patent application and not necessarily to the ex-post value of the patented technology. In other words, the effect should stem from the patent application independently of whether or not the technology turned out to be highly valuable in the end. For the purpose of testing this, we use the forward citations to the patent applied for in t-1 by the firm. As shown in previous research, the value distribution of patented inventions is subject to considerable uncertainty early in the patent life and ultimately highly skewed. Using a number of measures (renewal rates, citations, surveys, etc.) researchers have found that only a few patents turn out to be of high economic value, while the remainder are worth almost nothing (Pakes, 1985; Schankerman and Pakes, 1986; Harhoff et al., 1999; Deng, 2007). Thus, one does not expect patents to alleviate financing constraints unless patents signal something more, for example overall technological competencies,than simply the expected rents from appropriating returns on R&D via IP protection. This would make the patent right itself valuable, independently of the value of the underlying technology. Hall et al. (2005) suggest using forward patent citations (references to the patent in subsequent patent applications) as a patent value indicator. The more citations a firm’s patents receive, the more influential are these patents for follow-on technology developments, and consequently the higher is the assumed economic value of the patents. Research on the appropriateness of forward citations as value indicator found citations to correlate positively and significantly with patents’ economic value reported in surveys (Harhoff et al., 1999; Jaffe et al., 2000; Gambardella et al. (2008).
In the sample of small firms, however, we observe only very few patenting firms that receive citations to their patents at all (14 firms, corresponding to only a quarter of the small firms who patent).15 In other words, the reported effect can hardly be due to the ex-post value of the
underlying invention, as proxied by the average number of forwards citations to the patent in a five year-window after the patent was filed.
23
Among larger and patent active firms, about 15 percent receive citations to their patents. On average, these firms received 8 citations to their patents in the sample period. This number is of course downward biased by the number of non-patenting firms in our sample. Among the firms with at least one patent, the overall number of citations is 27 with a maximum of 4554 total citations. More meaningful is the average number of citations per patent that firms receive, on average. In the sub-sample of large firms this number is 0.47, with a maximum of 255 citations per patent. It should be noted that we consider patent profiles at the level of the firms which implies that we aggregate citations over all the patents the firm applied for in a given year and then divde by patents
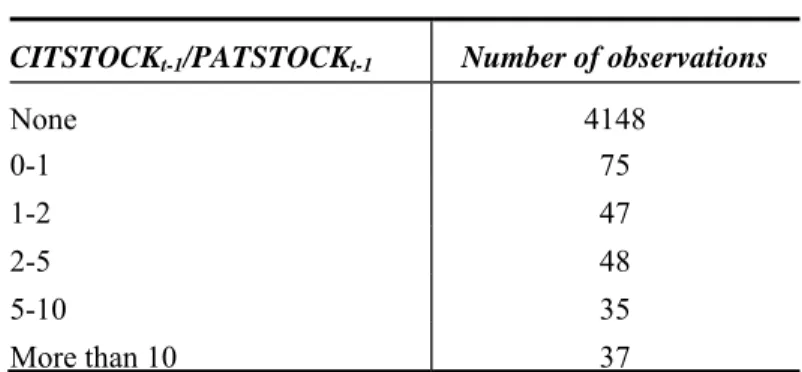
The citations per patent variable has a very skewed distribution, as expected. Table 3 below shows the distribution of the citation stock-patent stock ratio (lagged) for our sample:
Table 3: Citation Distribution
CITSTOCKt-1/PATSTOCKt-1 Number of observations None 4148 0-1 75 1-2 47 2-5 48 5-10 35 More than 10 37
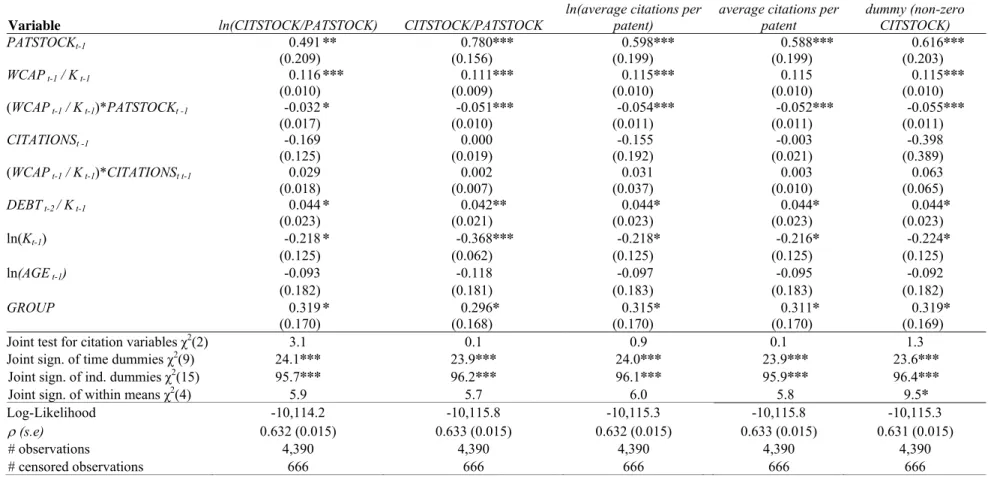
We therefore experimented with a number of specifications of the citations variable: the lagged cite stock-patent stock ratio (in levels and logs), the previous year’s citation/patent ratio (in levels and logs), and a simple dummy for the 242 observation with a nonzero citation stock. The citations stock (CITSTOCK) is calculated in the same fashion as the patent stock. The results are presented in Table 4, for the whole sample of firms. The coefficients of
WCAP/Kand the signs and significance levels of the control variables are comparable to the previous specification. Neither the citations term nor its interaction with working capital is ever significant, singly or jointly (supporting Hypothesis 4). 16
16 We also experimented with using a series of dummies for different levels of average cites per patent, as in Hall et al. (2005), but without success.
24
The irrelevance of the ex-post patent quality points to the conclusion that the signalling value of a patent is irrespective of the actual value of the patented technology for small firms and controlling for patent quality does not compromise the result for larger firms.17 We caution that this conclusion may be somewhat weaker than the conclusion that patents matter for financing, for two reasons: 1) citations may be a relatively weak indicator of value, especially citations based on EPO data, which are fewer in number; 2) these citations have been collected over a relatively short horizon.
6 Conclusion
Previous literature suggests that besides the original function of a patent to protect an invention, patents may additionally serve as a signal to lenders and investors easing access to external financing. The current study was motivated by a gap in the literature on the role of patents as quality signals for established R&D-active firms. The role of patents as quality signals for these firms, unlike for start-up firms and entrepreneurial ventures, has received little systematic treatment so far.
In line with previous research, the results showed that in particular small firms have to rely on internal liquidity to fund their R&D activities as a result of limited access to external financing. Moreover, the results showed that patent activity may help small firms to attract external financing more easily compared to non-patenting firms. Hence, their R&D spending relies to a lesser extent on available internal funds. We also found that the mitigating effect of patent applications is not due to the actual ex-post value of the patented technology, and we therefore conclude that patents do have some signaling effect. Thus, the patent application has a value in itself unrelated to the ex-post economic value of the patented invention. An alternative and related interpretation of our findings is that the private value of the invention is so uncertain at the time of application that capital markets and financial institutions are unable to distinguish among the various patents held by small firms, although they do evaluate the mere existence of a patent application positively.
17 Note that the number of citations is always truncated. Moreover, in our case, observations in the years later than 2008 have a shorter citation window than five years. We tested the sensitivity of our results to dropping these observations and found that the coefficients’ magnitude and significance is hardly affected.
25
Our findings add to previous research that suggested that patents play a particularly valuable signaling role in the start-up phase of a firm by finding patents to be important for small firms to attract external financing even if they are already established. The results thus stress that firms size may not only determine the likelihood that firms face financing constraints for R&D, but also whether patent help firms to signal technology competencies. As about half of the firms in our sample qualify as being small, the significance of the findings for technological advances at the level of the Flemish economy is clear. If small firms slow down growth in order to adapt their growth to the rates that can be maintained with its available financial means, as a consequence, growth of such firms is constrained by internal finance postponing technological advances and forgoing some technological opportunities. For many small technology firms, the signaling value of patents may thus be valuable adding to the protection function of patents.
Long (2002) argues that investors give high importance to patent counts when looking at established firms. In contrast, when looking at less-established firms, investors investigate the quantity as well as the quality of the patents. This may have affected our findings as the present study explicitly studied established firms. So it might be, that if we had considered young firms in our sample, patent quality would have mattered more. This distinction should be addressed in more detail in future research. Moreover, as individual patents can convey information about an particular invention, “patent portfolios may provide information about the lines of research a firm is conducting and how quickly the research is proceeding” (Long 2001). Future research may therefore benefit from a more detailed assessment of the firms’ patent portfolios in order to disentangle the portfolio effect from the signal value of the individual patent.
Finally, future research would also benefit from studying in much greater detail how the signal varies between different external investors and also whether it matters for attracting public R&D funding. Previous research suggested that public funding agencies may act like private investors in the sense that they favor less uncertain projects that a more likely to result in marketable products sooner.
26
Table 4: Estimation results from Tobit regressions with Wooldridge correction of R&D over tangible assets with citations form of citation variable (CITATIONSt -1)
Variable ln(CITSTOCK/PATSTOCK) CITSTOCK/PATSTOCK
ln(average citations per patent)
average citations per patent dummy (non-zero CITSTOCK) PATSTOCKt-1 0.491** 0.780*** 0.598*** 0.588*** 0.616*** (0.209) (0.156) (0.199) (0.199) (0.203) WCAP t-1 / K t-1 0.116*** 0.111*** 0.115*** 0.115 0.115*** (0.010) (0.009) (0.010) (0.010) (0.010) (WCAP t-1 / K t-1)*PATSTOCKt -1 -0.032* -0.051*** -0.054*** -0.052*** -0.055*** (0.017) (0.010) (0.011) (0.011) (0.011) CITATIONSt -1 -0.169 0.000 -0.155 -0.003 -0.398 (0.125) (0.019) (0.192) (0.021) (0.389) (WCAP t-1 / K t-1)*CITATIONSt t-1 0.029 0.002 0.031 0.003 0.063 (0.018) (0.007) (0.037) (0.010) (0.065) DEBT t-2 / K t-1 0.044* 0.042** 0.044* 0.044* 0.044* (0.023) (0.021) (0.023) (0.023) (0.023) ln(Kt-1) -0.218* -0.368*** -0.218* -0.216* -0.224* (0.125) (0.062) (0.125) (0.125) (0.125) ln(AGE t-1) -0.093 -0.118 -0.097 -0.095 -0.092 (0.182) (0.181) (0.183) (0.183) (0.182) GROUP 0.319* 0.296* 0.315* 0.311* 0.319* (0.170) (0.168) (0.170) (0.170) (0.169)
Joint test for citation variables χ2(2) 3.1 0.1 0.9 0.1 1.3
Joint sign. of time dummies χ2(9) 24.1
*** 23.9*** 24.0*** 23.9*** 23.6***
Joint sign. of ind. dummies χ2(15) 95.7
*** 96.2*** 96.1*** 95.9*** 96.4***
Joint sign. of within means χ2(4) 5.9 5.7 6.0 5.8 9.5
*
Log-Likelihood -10,114.2 -10,115.8 -10,115.3 -10,115.8 -10,115.3
(s.e) 0.632 (0.015) 0.633 (0.015) 0.632 (0.015) 0.633 (0.015) 0.631 (0.015)
# observations 4,390 4,390 4,390 4,390 4,390
# censored observations 666 666 666 666 666
Notes: Standard errors are in parentheses. *** (**, *) indicate a significance level of 1% (5%, 10%). All models include an intercept (not shown). Coefficients of variables’ within means in Wooldridge model areomitted from the table. The value of indicates the share of the total variance which is due to the cross-sectional variation.
27
References
Anton, J. and Yao, D. (2002). The Sale of Ideas: Strategic Disclosure, Property Rights, and Contracting, Review of Economic Studies, 69(3), 513-531.
Arora, A., Fosfuri, A. and Gambardella, A. (2001). Markets for Technology: The Economics of Innovation and Corporate Strategy, MIT Press, Cambridge.
Baum, J.A. and Silverman, B.S. (2004). Picking Winners or Building Them? Alliance, Intellectual, and Human Capital as Selection Criteria in Venture Financing and Performance of Biotechnology Startups, Journal of Business Venturing 19(3), 411-436.
Berger, A. and Udell, G. (1998). The Economies of Small Business Finance: The Roles of Private Equity and Debt Markets in the Financial Growth Cycle, Journal of Banking and Finance 22(6-8), 613-673.
Bessen, J. and Maskin, E. (2009). Sequential Innovation, Patents, and Imitation, RAND Journal of Economics 40(4), 611-635.
Bhattacharya, S. and Ritter, J. (1983). Innovation and Communication: Signaling with Partial Disclosure, Review of Economic Studies 50(2), 331-346.
Bond, S. and Van Reenen, J. (2007). Microeconometric Models of Investment and Employment, in: J.J. Heckman and E.E. Leamer (eds.), Handbook of Econometrics 6, London, North-Holland, 4417-4498.
Bougheas, S., Görg, H. and Strobl, E. (2003). Is R&D Financially Constrained? Theory and Evidence from Irish Manufacturing, Review of Industrial Organization 22(2), 159-174.
Brown, J.R. and Petersen, B.C. (2011), Cash holdings and R&D smoothing, Journal of Corporate Finance 17, 694–709.
Brown, J.R., Martinsson, G. and Petersen, B.C. (2012). Do financing constraints matter for R&D?, European Economic Review 56, 1512–1529.
Cameron, A.C. and Trivedi, P.K. (2005). Microeconometrics: Methods and Applications, New York, Cambridge University Press.
Carpenter, R. and Petersen, B.C. (2002). Capital Market Imperfections, High-Tech Investment, and New Equity Financing, Economic Journal 112, 54-72.
Christie, A., C. Dent,J. Liddicoat, and A. Lim (2013). What Difference Does Patent Examination Make?: An Analysis of the Effect of Examination in the USPTO, the EPO and APO. Paper presented at the TILEC Workshop on Innovation and the Patent System, June 20-21.
Cockburn, I. and Wagner, S. (2007). Patents and the Survival of Internet-Related IPOs, NBER Working Paper No. 13146.
Conti, A., Thursby, M.C., and Rothaermel, F.T. (2013). Show Me the Right Stuff: Signals for High Tech Startups, Journal of Economics & Management Strategy, 20(2), 341–364.
Conti, A., Thursby, M.C., and Thursby, J. (2013). Patents as Signals for Startup Financing, The Journal of Industrial Economics, 61(3), 592–622.
28
Czarnitzki, D., Hall, B.H. and Oriani, R. (2006). The Market Valuation of Knowledge Assets in US and European Firms, in: D. Bosworth and E. Webster (eds.): The Management of Intellectual Property, Cheltenham Glos: 111-131.
Czarnitzki, D. and Hottenrott, H. (2010). Financing Constraints for Industrial Innovation: What do we know?, Review of Business and Economics 55(3), 346-362.
Czarnitzki, D. and Hottenrott, H. (2011a). R&D Investment and Financing Constraints of Small and Medium-Sized Firms, Small Business Economics 36(1), 65-83. Czarnitzki, D. and Hottenrott, H. (2011b). Financial Constraints: Routine versus Cutting
Edge R&D Investment, Journal of Economics and Management Strategy 20(1), 121-157.
Deeds, D., DeCarolis, D. and Coombs, J. (1997). The Impact of Firm Specific Capabilities on the Amount of Capital Raise in an Initial Public Offering: Evidence From the Biotechnology Industry, Journal of Business Venturing 12, 165–187.
Deloof, M. (1998). Internal Capital Markets, Bank Borrowing, and Financing Constraints: Evidence From Belgian Firms, Journal of Business Finance and Accounting, 25(7&8), 945-968.
Deloof, M. and Jegers, M. (1999). Trade Credit, Corporate Groups, and the Financing of Belgian Firms, Journal of Business Finance and Accounting 26(7&8), 945-966. Deng, Y. (2007). Private Value of European Patents, European Economic Review 51,
1785-1812.
Fazzari, S., Hubbard, R. and Petersen, B.C. (1988). Financing Constraints and Corporate Investment, Brookings Papers on Economic Activity 1, 141-206.
Fazzari, S.M. and Petersen, B.C. (1993). Working Capital and Fixed Investments: New Evidence on Financing Constraints, RAND Journal of Economics, 24(3), 328-342. Gambardella, A., Harhoff, D. and Verspagen, B. (2008). The Value of European
Patents, European Management Review 5, 69-84.
Griliches, Z. and Mairesse, J. (1984). Productivity and R&D at the Firm Level, in: Z. Griliches (ed.), R&D, Patents, and Productivity. Chicago, University of Chicago Press.
Griliches, Z. (1986). Productivity, R and D, and Basic Research at the Firm Level in the 1970’s, American Economic Review, 76(1), 141-154.
Griliches, Z., Pakes, A. and Hall, B.H. (1987). The Value of Patents as Indicators of Inventive Activity, in: Economic Policy and Technological Performance, P. Dasgupta and P. Stoneman (eds.), Cambridge University Press, 97-124.
Haeussler, C., Harhoff, D. and Mueller, E. (2009). To Be Financed or Not – The Role of Patents for Venture Capital Financing, ZEW Discussion Paper No. 09-003.
Hall, B.H. (1992). Research and Development at the Firm Level: Does the Source of Financing Matter? Cambridge, Mass.: NBER Working Paper No. 4096.
Hall, B.H. (2000). Innovation and Market Value, in: R. Barrell, G. Mason and M. O’Mahoney (eds.), Productivity, Innovation and Economic Performance, Cambridge: Cambridge University Press.