No. 2006–32
NETWORK EMBEDDEDNESS AND THE EXPLORATION OF
NOVEL TECHNOLOGIES: TECHNOLOGICAL DISTANCE,
BETWEENNESS CENTRALITY AND DENSITY
By Bart Nooteboom, Victor Gilsing, Wim Vanhaverbeke,
Geert Duysters, Ad van den Oord
March 2006
NETWORK EMBEDDEDNESS AND THE EXPLORATION OF
NOVEL TECHNOLOGIES:
TECHNOLOGICAL DISTANCE,
BETWEENNESS CENTRALITY AND DENSITY
March 2006 Bart Nooteboom
Tilburg University, the Netherlands Presenting author
Adelheidstraat 82, 2595 EE the Hague +31-703478605
[email protected] Victor Gilsing
ECIS - Eindhoven University of Technology, the Netherlands Wim Vanhaverbeke
ECIS - Eindhoven University of Technology, the Netherlands & Limburg University Centrum, Belgium
Geert Duysters
ECIS - Eindhoven University of Technology, the Netherlands Ad van den Oord
ECIS - Eindhoven University of Technology, the Netherlands ABSTRACT
In this paper we analyze the innovative performance of alliance networks as a function of the technological distance between partners, a firm’s network position (centrality) and total network density. We study how these three elements of an alliance network, apart and in combination, affect the ‘twin tasks’ in exploration, namely novelty creation on the one hand and its efficient absorption on the other hand. For an empirical test, we study technology-based alliance networks in the pharmaceutical, chemical and automotive industry.
JEL – codes: O31, O32, L14, L24, L25
INTRODUCTION
There is now increasing consensus in the academic literature that a firm’s embeddedness in a network of interfirm relations matters for its economic and innovative performance (Nooteboom, 1992; Hagedoorn, 1993; Powell e.a., 1996; Rowley e.a. 2000; Ahuja 2000; Owen-Smith and Powell, 2004). The empirical evidence has indicated that this relationship between embeddedness and innovation can be found in industries as diverse as chemicals (Ahuja, 2000), biotechnology (Baum e.a., 2000; Powell, e.a. 1999), semiconductors (Stuart, 2000), textile (Uzzi, 1996), personal computers (Hagedoorn and Duysters, 2002) and banking (Zaheer and Bell, 2005). More recently, some studies have started to unravel this notion of embeddedness in order to understand in what specific ways it contributes to a firm’s innovation performance. Here, characteristics of partners have been studied such as their degree of innovativeness (Stuart, 2000) as well as the properties of alliances such as the role of formal governance mechanisms (e.g. Mowery et al., 1996), equity vs. non-equity alliances (Rowley e.a. 2000) or the role of repeated contacts (Hagedoorn et al. 2005; Wuyts e.a., 2005). Beyond the dyad level, studies at the network level have shown that the properties of an alliance network also affect innovation. Here it has been shown that apart from the number of direct ties (Ahuja, 2000; Shan et al. 1994) also a firm’s indirect ties (Ahuja, 2000) and the redundancy among these ties (Ahuja, 2000; Baum e.a., 2000; McEvily and Zaheer, 1999) affect its innovation performance. In most of these studies an important function of alliances is that they function as ‘pipelines’ through which information and knowledge flows between firms (Owen-Smith and Powell, 2004). This focus on the diffusion potential of alliances may not be surprising as most studies on the role of embeddedness have been assuming conditions of relative environmental stability. Here, embeddedness refers to routinization and stabilization of linkages among members as a result of a history of exchanges and relations within a group or community (Gulati, 1998). Under such structure-reinforcing conditions, the role of embeddedness is increasingly well understood (Gulati, 1998; Madhavan et al., 1998; Koka et al., 2006). These conditions connect with March’s category of exploitation (1991) in which environmental uncertainty is rather limited and the focus is on the refinement and extension of existing competences and technologies. The rationale for teaming up with partners then is formed by possibilities to obtain complementary know-how (Teece, 1986) and/or to speed up the R&D-process in industries where time-to market is crucial. Here, cooperation is attractive as partners have a good understanding of the relevant issues at hand (Hansen et al., 2001) and alliances enable a rapid diffusion of knowledge among partners, enhancing the efficiency and speed of cooperation (Gilsing, 2005).
In this strand of literature, an implicit underlying assumption is that similarity of partners is beneficial for learning and innovation. This follows from Cohen and Levinthal’s influential notion of absorptive capacity (1990), i.e. the idea that the extent to which firms can learn from external knowledge is largely dependent upon the similarity of the partners’ knowledge bases. In a similar vein, different studies have demonstrated that learning potential declines with an increase in dissimilarity of knowledge stocks (Hamel, 1991; Lane and Lubatkin, 1998; Mowery et al., 1996; Fleming and Sorenson, 2001). So, for interorganisational learning in exploitation, similarity is attractive and distances in knowledge and cognition (cognitive distance) form a liability.
This raises the question of how to understand the role of network embeddedness in view of exploration that can be characterized by a break away from the established
way of doing things, with a focus on the discovery and experimentation of new technologies (March, 1991; Nooteboom, 2000). By its very nature, exploration is not about efficiency of current activities, but rather forms an uncertain process that deals with the search for new, technology based business opportunities (Rowley et al., 2000; Nooteboom, 2000), which requires production of new insights and knowledge. This points to a different role of a firm’s alliance network, namely its recombination potential in view of new knowledge creation rather than its function as a channel for diffusion of existing information and knowledge in view of exploitation. Existing literature has largely ignored this role of alliances for novelty creation and is therefore unable to explain the development of new knowledge and competencies (Hagedoorn, Link and Vonartas, 2000; Phelpes, 2005). In contrast to exploitation, in this process of exploration partners’ similarity is unattractive whereas cognitive distance between partners forms an important asset.
The main aim of this paper is to develop an understanding of the role of a firm’s alliance network in view of exploration. To do so, we will develop the following two steps. First, we will consider this role of cognitive distance between firms in order to understand in how far dissimilarity between partners is attractive in view of exploration. Second, we combine such a cognitive view with a social structural one. In this way we complement the literature that has predominantly focused on the role of economic and social factors regarding alliance formation and the role of network embeddedness (Gulati, 1998). A cognition-based understanding of these processes is however still in its infancy (Moran, 2005). Combining the role of cognitive and social structural factors may provide us with new insights in what constitutes an optimal network structure for exploration. As we will argue, for exploration firms are faced with a dual task. On the one hand, they need to develop access to heterogeneous sources of knowledge and in this way create a potential for novel combinations. This requires an emphasis on diversity and disintegrated network structures, which is related to Burt’s argument (1992) stressing the benefits of access to non-redundant contacts to obtain novel information (novelty value). On the other hand, firms need to make sure that such novel knowledge, once accessed, is evaluated and when proven to be valuable, is adequately absorbed (absorptive capacity). As we will argue, this process favors more homogenous network structures in view of integrating the diverse inputs obtained from distant partners (Hansen et al., 1999). This is more in line with Coleman’s view (1988) stressing the benefits of redundant network structures. Given these differences between the two tasks, we claim that a firm’s network will impact differently on each task. So, an important contribution of this paper is that it investigates in how far optimal embeddedness for novelty creation may form a burden for absorptive capacity and vice versa. In this way, we may shed new light on the ongoing debate on the validity of the arguments by Burt, favoring structural holes, versus those of Coleman, favoring closure. The debate until now has focused on how the two views differ, but our emphasis on the joint consideration of absorption and novelty creation may enable us to see in how far both views are complementary. This paper is structured as follows. First we elaborate our theoretical argument and formulate a number of hypotheses. Then, we present details about the data, the specification of variables, and the estimation method. Next, we present our main findings and a discussion of the results. Finally, we provide the main conclusions and some indications for further research.
As argued, the central focus of this paper is on the role of a firm’s alliance network regarding the ‘twin tasks’ of on the one hand creating novel combinations, and on the other hand the build up of absorptive capacity for understanding such novel combinations. To understand its role, we study a firm’s alliance network along three dimensions. First, following Nooteboom et al. (2005), we consider the role of cognitive distance among the firms making up such an alliance network. Here, cognitive distance refers to the extent that firms differ in their technological knowledge and expertise. We analyze how cognitive distance affects the potential for novelty creation and for the build up of absorptive capacity. Next we focus on the role of a firm’s position in a network and also analyze how this affects the potential for novelty creation and its absorption. As a third element of a firm’s alliance network we study the role of network density, as a property of the total network, and analyze its effect along similar lines. By considering cognitive distance as well as position and network density we combine a cognitive view of a firm’s alliance network with a social structural view. Whereas a cognitive view elucidates the potential for recombination due to distances in cognition between firms, a social structural view highlights how technology-based alliances serve as the mechanism for crossing such distances and accessing (proximate and distant) partners. In this way, combining the two perspectives provides a complementary theoretical foundation for understanding the role of a firm’s alliance network in exploration.
Exploration
The distinction between exploration and exploitation goes back to Holland (1975) and was later further developed by March (1991). Exploitation can be characterized as a process of routinisation, which adds to the existing knowledge base and competence set of firms without changing the nature of activities (March, 1991). This resembles ‘local search’ in which firms search for new knowledge that is less likely to conflict with their existing cognitive and mental models (Nelson and Winter, 1982).1 They develop more and more competence in their particular field, further increasing the chance of immediate and positive returns. Exploitation may therefore increase a firm’s innovative performance due to returns from specialization, however, it may also lead to technological obsolescence and leave firms locked out from new developments (March, 1991; Sorensen and Stuart, 2000). To escape from this lock-in situation, firms need to engage in so-called exploration that can be characterized by breaking with an existing dominant design and a shift away from existing rules, norms, routines and activities, in search of novel combinations. Hence exploration is not about efficiency of current activities and cannot be planned for. It is an uncertain process that is characterized by a constant search for new opportunities.2 Although the literature agrees on the fact that alliance networks form an important instrument in this process (Powell et al, 1996; Rowley et al, 2000), there is very limited empirical evidence of how they facilitate the creation of new knowledge in this process of exploration.
An important issue here is that we take a firm’s perspective on exploration. In other words, in this paper we will focus on the creation of technological knowledge that is
1
Underlying this is the idea of the relative inertia of firms, as advanced by population ecology that firms are better at doing more of the same than at adapting tot change (Carrol and Hannan, 2000).
2
Exploration and exploitation are related and build on each other: exploration develops into exploitation, and exploration emerges from exploitation, in ways that go beyond the present paper (see for a further discussion Nooteboom (2000) and Gilsing and Nooteboom (2006).
new to the firm. So, we consider knowledge as novel and the activities to create such knowledge as exploratory if it falls outside a firm’s existing knowledge stock, even though it may have been in existence elsewhere earlier. This clearly differs from exploration that yields knowledge that is new to the industry or perhaps even new to the world. These latter two form ‘newly emerging’ respectively ‘pioneering’ technologies and represent (much) more radical types of exploration (Ahuja and Lampert, 2001).
Role of technological distance
Regarding the role of cognitive distance, Nooteboom (1999) proposed a model, which was tested by Wuyts et al. (2005) and by Nooteboom et al. (2005). The key argument in the model is that while larger distances in cognition have a negative effect on absorptive capacity, it has a positive effect on the potential for novelty creation. In first instance, as cognitive distance increases, it has a positive effect on learning by interaction because it yields opportunities for novel combinations of complementary resources. However, at a certain point cognitive distance becomes so large as to preclude sufficient mutual understanding needed to utilize those opportunities. Of course, a certain degree of mutual understanding is needed for collaboration, and familiarity certainly breeds trust (Gulati, 1995a), which facilitates successful collaboration. However, too much familiarity may take out the innovative steam from collaboration. The challenge then is to find partners at sufficient cognitive distance to learn something new, but not so distant as to preclude mutual understanding.
In general, cognitive distance entails more than only technological distance, although there is correlation between technological distance and distance in other functional disciplines such as marketing, production and engineering (Phelpes, 2005). In this paper, we specify cognitive distance in terms of technological distance, for two empirical reasons. First, our measure of innovative success will be based on patents, and there technological knowledge is more dominant. A second, more pragmatic argument is that it is not clear how, precisely, other dimensions of cognitive distance should be measured (cf. Wuyts et al. 2005).
Reframing the logic of the above argument in terms of technological distance: absorptive capacity declines with technological distance, and novelty value increases with it. For both effects of technological distance the simplest effect would be linear, and this is hypothesized until theoretical or empirical arguments emerge for a more complicated effect. Seen in this way, innovative performance by collaboration is hypothesized to arise from the interaction (modelled as the mathematical product) of novelty value and absorptive capacity. The basic idea here is that there is an inverted-U shaped relationship. Mathematically:
AC = a0 – a1.TD and (1)
NV = b0 + b1.TD
a0, a1, b0, b1 > 0. (2)
Where
AC = absorptive capacity, NV = novelty value, TD = technological distance
The innovation performance of collaboration in the dyad (= IP) is defined as the product of the two linear effects:
Replacing AC and NV by the right hand side of equations (1) and (2) yields:
IP = a0.b0 + (a0.b1 – b0.a1)TD – a1.b1.TD2 (4)
Equation (4) results in an inverse U-shaped effect if and only if.:
a0.b1 > b0.a1 (5)
In sum, this leads to our first hypothesis:
Hypothesis 1: Exploration is an inverse U-shaped function of technological distance. Role of network position
Unlike the local search process of exploitation (March, 1991), the search process in exploration is ‘recombinant’, reflecting the idea that novelty arises as the result of (re)combining and transforming existing and novel elements of knowledge into something radically new (Nelson and Winter, 1982; Henderson and Clark, 1990; Tushman and Rosenkopf, 1992; Ahuja and Lampert, 2001). Here, the role of an alliance network is that it brings together a variety of skills and experience, which provides a potential for the generation of Schumpeterian novel combinations (Schumpeter, 1939). In this case, alliances do not serve as channels for the diffusion of existing knowledge and competencies but rather generate a recombination potential in view of new knowledge creation. This recombination potential originates from the fact that knowledge, values and behavior are more homogenous within groups than between groups, so that firms connected across groups have more access to alternative ways of thinking, which gives them more options for creating new combinations (Burt 2004).3 So, to effectuate this recombination potential of its alliance network, firms should develop ties to companies that are themselves not connected to a firm’s existing group of partners. A tie will provide access to new information and entrepreneurial opportunities to the extent that it offers access to non-redundant sources of information (Burt, 1992). Such a tie spans a structural hole. Structural holes guarantee that the partnering companies on both sides of the hole have access to different flows of information (Hargadon and Sutton, 1997) and that the information that comes from these mutually unconnected allies is non-redundant.
A key issue here is that possibilities to create such non-redundant ties are not equally spread across firms. A firm’s network position importantly conditions the possibility to create alliances to such non-redundant partners and benefit from these accordingly. Central firms become better informed about what is going on in the network This increases possibilities for central firms to initiate the formation of new alliances (Gnyawali and Madhavan, 2001). Moreover, this combination of timely access to important and novel information and their higher status and power increases their bargaining power (Gnyawali and Madhavan, 2001; Burt, 2004), which also improves possibilities to benefit more from their alliances than less central firms. Following this, we expect that central firms form attractive partners to ally with, which enhances the likelihood that these central players, when engaging in exploration, will create alliances to non-redundant partners and benefit from these alliances accordingly. As a consequence, we anticipate that centrality has a positive
3
Quoting Burt here: “People who stand near the holes in a social structure are at a higher risk of having good ideas” (Burt: 349, 2004).
effect on the search for novel combinations and hence on exploration, in particular on novelty value.
However, searching through non-redundant ties comes at a price and bears certain risks. A consequence of having access to many non-redundant ties is that central firms have to deal with a higher volume of more diverse information that will arrive at faster rates when compared with less central firms (Gnyawali and Madhavan, 2001). This consumes time and resources that cannot be allocated for absorbing and integrating the obtained novel insights. As a consequence, abundant exploration and search through non-redundant contacts may come at a price of limited attention for absorption. Second, a sole focus on searching for novelty through non-redundant ties may result in a random drift so that a firm’s knowledge base changes continuously in different and unrelated directions, making the accessed novel knowledge difficult to absorb and integrate (Fleming and Sorenson, 2001; Ahuja and Katila, 2004). So, both from a search-costs and cognition point of view, too many non-redundant ties will decrease the potential for novelty absorption. In other words, centrality spurs the possibilities for novelty creation but at high(er) levels it may impede the possibilities for absorption of this novelty.
Thus, we hypothesize that centrality has a positive effect on novelty value (NV) and a negative effect on absorptive capacity (AC), and by the same logic as for the effects of technological distance, with innovative performance being a product of NV and AC), this yields an inverse U-shaped effect on exploration:
Hypothesis 2: Exploration is an inverse U-shaped function of centrality.
Role of network density
In contrast to the effects of centrality, we anticipate that network density limits the potential for novelty creation whereas it enhances the build up of absorptive capacity. As we will argue, both direct and indirect ties play a role in the build up of absorptive capacity. Therefore we consider the role of ‘global network density’, which considers both types of ties as a property of the total network, rather than the density of ties surrounding a specific node. As we will argue, both direct and indirect ties play a role in the build up of absorptive capacity.
Novel knowledge from a direct partner, especially at a large technological distance, may not be readily understandable for a firm. If one is not able to adequately understand novel information from a given source, one may need another partner to complement one’s absorptive capacity (Gilsing and Nooteboom, 2005). More precisely, if A remains linked to both B and C, even if there is also a link between B and C, this may help A to understand C by comparing what A understands from C with what B understands from C. In other words, even if a firm’s direct ties are known to be redundant for access to sources of information, they may both be needed to understand and absorb knowledge accessed in the other relation. This is the case particularly when engaging in exploration, where new and distant knowledge is accessed, and dominant designs and standards may be lacking. Moreover, the tacit and experimental nature of exploration further increases the difficulty of firms to recognize and value the technology of potential partners when they are not connected through a common alliance partner. In this way, indirect ties can enhance the absorptive capacity of the firm by acting as device for screening and interpreting novel information on its potential relevance and value for him (Leonard-Barton, 1984; Vanhaverbeke et al., 2005). In addition, even if one does understand a given source, one may not be able to judge the reliability of information, so that, like researchers in gathering potentially biased data, one may need a third party as a source for
triangulation (Gilsing and Nooteboom, 2005). In this way, firms may be able to develop a richer understanding and a better evaluation of the acquired novelty (Rowley et al., 2000).
In addition, a dense network of direct and indirect ties also facilitates the build-up of trust, a reputation mechanism, and coalitions to constrain opportunism (Gulati, 1995; Hagedoorn and Duysters, 2002). These are the prime arguments for closure, introduced by Coleman (1988). They apply especially to exploration in view of the uncertainty surrounding it, which limits options for governance by formal contracts (Nooteboom, 1999, 2002).
Now, density and its potential for trust building enables a proliferation of triangulation, as follows. First, it is useful for neighbors of the focal firm to be mutually connected for triangulation. Next, information from any neighbor is richer and more reliable to the extent that the neighbor also profits from triangulation among his neighbors.
So, density through direct ties and indirect ties plays an important role with regard to assessing the reliability of (distant) sources of novelty as well as understanding and evaluating these sources. In sum, we propose that density enhances the absorptive capacity of each individual firm in the network.
Let us now turn to the arguments against dense networks. One argument entails that there are costs associated with establishing and maintaining contacts and that by shedding redundant ties, firms can create efficiency in their network (Burt, 1992). However, in exploration such costs of redundancy play a limited role as the key focus here is on finding and absorbing novelty, making considerations of efficiency less of an issue (Hagedoorn and Duysters, 2002; Gilsing and Nooteboom, 2005).
The main argument against high density, however, is that it inhibits the existence and the utilization of diversity, and hence of novelty value. When knowledge is more densely spread across firms in the network, the benefits of direct ties and indirect ties in giving access to novelty will decline, because ‘everyone knows what everyone knows’. Firms are less likely to gain new or additional information from their indirect ties, as the information that can be obtained from them will be very similar to the knowledge already obtained from its direct contacts. As a consequence, the potential for creating novel combinations will diminish.
Also, a dense network increases the likelihood that knowledge and information reaching the company through its alliance network also reaches its partners. This may create a risk of undesirable spillovers. Such diffusion of novelty throughout the network can put limits on its appropriation and makes it less attractive for firms to search for such novelty (Gilsing and Nooteboom, 2005).
A final argument against density is, as indicated before, that it facilitates effective sanctions. As pointed out by Coleman (1988), dense networks enable reputation effects, and yield opportunities for coalitions to constrain behaviour. This is useful for the governance of relational risk, but may create strong behavioral pressures to conform rather than to be radically different (Kraatz, 1998). Firms may also be preempted from entering into new, more innovative relationships, as the implicit expectation of loyalty to their existing partners and network may inhibit them from allying with others (Buchko 1994; Nooteboom, 1999; Duysters and Lemmens 2003; Gulati et al, 2000).
In sum, density supports the build up of shared absorptive capacity but it may impede the possibilities for search and novelty creation. These arguments lead to the following hypothesis:
Combined effects
The effects of technological distance (TD) (Hypothesis 1), betweenness centrality (BC) (Hypothesis 2) and network density (D) (Hypothesis 3) apply simultaneously, and hence there are interaction effects between them. Theoretically, the inverse U-shaped effects result from opposite effects on absorptive capacity (AC) and novelty value (NV), which are multiplied in their effects on exploration performance, as specified previously for the effect of technological distance.
In Hypothesis 1 we posited that technological distance has a negative effect on absorptive capacity and a positive effect on novelty value. In Hypothesis 2 we argued that centrality has a negative effect on absorptive capacity and a positive effect on novelty value. In hypothesis 3 we assume that network density has a positive effect on absorptive capacity and a negative effect on novelty value
For the combined effects, the full model then becomes:
AC = a0 –a1.TD - a2.BC + a3.D (6)
NV = b0 + b1.TD + b2.BC – b3.D (7)
a0 , a1 , a2 , a3 , b0 , b1 , b2 , b3 > 0
Multiplying (6) and (7) provides the equation for exploration performance (IP)
IP = AC.NV = (8) (a0.b1 – b0.a1).TD + (a0.b2 – b0.a2).BC + (b0.a3 – a0.b3).D - a1.b1.TD2 – a2.b2.BC2 – a3.b3.D2 - (a1.b2 + a2.b1).TD.BC + (a1.b3 + a3.b1).TD.D + (a2.b3 + a3.b2).BC.D Where a0.b1 > b0.a1, a0.b2 > b0.a2 and b0.a3 > a0.b3 (9)
This mathematical model can be interpreted in the following way. The interaction effect of two variables on exploration is negative when they have an effect in the same direction on novelty value or on absorptive capacity. These yield alternative ways for achieving those effects and here the variables can be considered as substitutes. This applies to the interaction effect between technological distance and betweenness centrality, which both enhance novelty value while decreasing absorptive capacity. Thus, such a combined increase in the potential for novelty value with a decrease of the ability to absorb this novelty has a negative net effect on exploration. Interaction effects are positive when variables have opposite effects on novelty value and on absorptive capacity. Here, the interaction effects form complements. An increase in novelty value is accompanied by an increase in the ability to absorb it. This applies to the interaction effects between technological distance and density as well as to the interaction effect between betweenness centrality and density. In both cases, an increase in novelty value, due to an increase of technological distance or an increase of centrality, is accompanied by an increase in absorptive capacity due to an increase of network density.
In other words, there are alternative strategies for the maximization of exploration. High (low) technological distance would need to be compensated by low (high) betweenness centrality and/or high (low) density. High (low) betweenness centrality would have to be compensated by low (high) technological distance and/or high (low)_density. High (low) density would have to be compensated by high (low)
technological distance and/or high (low) betweenness centrality. In sum, this leads to our final three hypotheses:
Hypothesis 4: The interaction between technological distance and betweenness centrality has a negative effect on exploration.
Hypothesis 5: The interaction between technological distance and density has a positive effect on exploration.
Hypothesis 6: The interaction between betweenness centrality and density has a positive effect on exploration.
DATA AND METHODS Data
The sample set for this study consisted of panel data on the alliance and patenting activities of 116 companies in the chemicals, automotive and pharmaceutical industries. The reason to choose these three industries is that they share the importance of investing in R&D and innovation, but that they also reveal profound differences regarding some key characteristics such as the stage of industry development (Walker et al., 1997), the importance of exploration vis-à-vis exploitation (Rowley et al., 2000) and the importance of product versus process innovations (Tidd et al, 1997)4. Testing our hypotheses in different industries enables us to assess in how far the role of a firm’s alliance network for exploration and exploitation remains invariant across industries, enhancing the generalization of the results.
The focal firms that we study were observed over a 12-year period, from 1986 until 1997. The panel is unbalanced because of new start-ups and mergers and acquisitions. The 116 companies were selected to include the largest companies in these three industries that were also establishing technology based strategic alliances. Information on the establishment of alliances is hard to obtain for small or privately owned companies. Previous studies on inter-firm alliances also focused on leading companies in an industry (Ahuja, 2000a; Gulati, 1995b; Gulati and Gargiulo, 1999).
In total, 994 alliances were established in the period 1986-1996 among these companies. Alliance data were retrieved from the MERIT-CATI database, which contains information on nearly 15 thousands cooperative technology agreements and their ‘parent’ companies, covering the period 1970-1996 (see Hagedoorn and Duysters (2002) for a further description).
Exploration, the dependent variable, is based on patent counts. All patenting data were retrieved from the US Patent Office Database for all the companies in the sample, also those based outside the US. Working with U.S. patents – the largest patent market - is preferable to the use of several national patent systems “…to maintain consistency, reliability and comparability, as patenting systems across nations differ in the application of standards, system of granting patents, and value of protection granted” (Ahuja, 2000a; p. 434). Especially in industries where companies
4
Pharmaceuticals with its invasion of biotechnologies reflects a younger type of industry that stresses the importance of exploration (Powell et al., 2005), whereas chemicals and automotive form mature industries with some more reliance on exploitation (Coriat and Weinstein, 2001). Moreover, the pharmaceutical industry has a strong focus on product innovations (Powell 1990, Walker et al., 1997), whereas chemicals show a strong focus on process innovations and the automotive industry a mixture of both (Marsili, 2001).
operate on an international or global scale U.S. patents may be a good proxy for companies’ worldwide innovative performance.
For companies in the three sectors the financial data were derived from a combination of Worldscope, Compustat and data published in the companies’ annual reports.
Variables
Dependent variable
The different hypotheses test the effect of technological distance, network position and overall network density on the explorative innovation performance of companies in the chemical, automotive and pharmaceutical industry. To derive the dependent variable, technological profiles of all focal companies were computed to find out whether new patents in the year of observation could be categorized as ‘explorative’. These technological profiles were created by adding up the number of patents a firm received in each patent class during the five years prior to the year of observation. Different scholars have argued that a moving window of 5 years is an appropriate timeframe for assessing the technological impact of prior inventions (Podolny and Stuart, 1995; Stuart and Podolny, 1996; Henderson and Cockburn, 1996; Ahuja, 2000a). Studies about R&D depreciation (Griliches, 1979, 1984) suggest that knowledge capital depreciates sharply, losing most of its economic value within 5 years. The USPTO-classes were determined at two-digit level, which resulted in approximately 400 classes.
From these technology profiles we can distinguish between exploitative and explorative technology classes. Classes in which a company receives a patent in the year of observation but had not received a patent in the previous five years were considered ‘explorative’ patent classes5. Since knowledge remains relatively new and unexplored for a firm immediately after patenting, patent classes kept their explorative ‘status’ for 3 consecutive years, parallel to Ahuja and Lampert’s (2001) concept of novel and emerging technologies6. All the classes in which a company had successfully applied for a patent the previous five years and successfully applied for a patent in the year of observation were considered ‘exploitative’ patent classes.
Independent variables
Explanatory variables
Technological distance, centrality and overall network density are the three explanatory variables that have to be operationalized. The first variable is based on USPTO patent count data. The other two are calculated based on the alliances that were established during the 5 year period prior to the year of observation. This moving window approach is considered to be an appropriate timeframe during which the existing alliance portfolio is likely to have an influence on the current technological performance of a firm (Kogut 1988, 1989; Gulati, 1995b).
Technological distance: Technological distance was measured on the basis of CRTA, which is the Pearson correlation index of the distribution across technological classes of the revealed technological advantages (RTA) of each firm relative to the other sample firms. The RTA of a firm in a particular technological field is given by
5
We chose the year when the company filed for the patent rather than the year when it was granted, because the innovation in the company already has been realized when the company files for a patent.
6
In order to test the robustness of this measure, we also constructed a 'exploration patents'-variable where explorative patents could keep this status for 5 years instead of 3 years.
the firm's share in that field of the US patents granted to all companies in the study, relative to its overall share of all US patents granted to these companies. The RTA index varies around one, such that a value higher than one suggests that a firm is comparatively specialized in the technology in question, given its overall innovative performance. Positive values of CRTA indicate similarity of the pattern of relative technological specialization of firms, as it appears from the distribution of their patent activity across technological fields. For each firm and each year, a profile was constructed of its revealed technological advantage (RTA) in each patent class.
A company’s RTA-index in a patent class is defined as the firm’s share of patents in that class (compared to all its alliance partners) divided by its share in all patent classes. The correlation coefficient was computed pairwise between the RTA-profile of the focal firm and that of each of its alliance partners. The CRTA variable is then calculated as the average of these correlations. The values for CRTA can theoretically vary from –1 to 1. As positive (negative) values indicate smaller (larger) technological distances, we choose to transform this variable into a new one ('Technological distance’) with a minimum value of zero and a maximum of hundred, where higher values indicate larger technological distance.
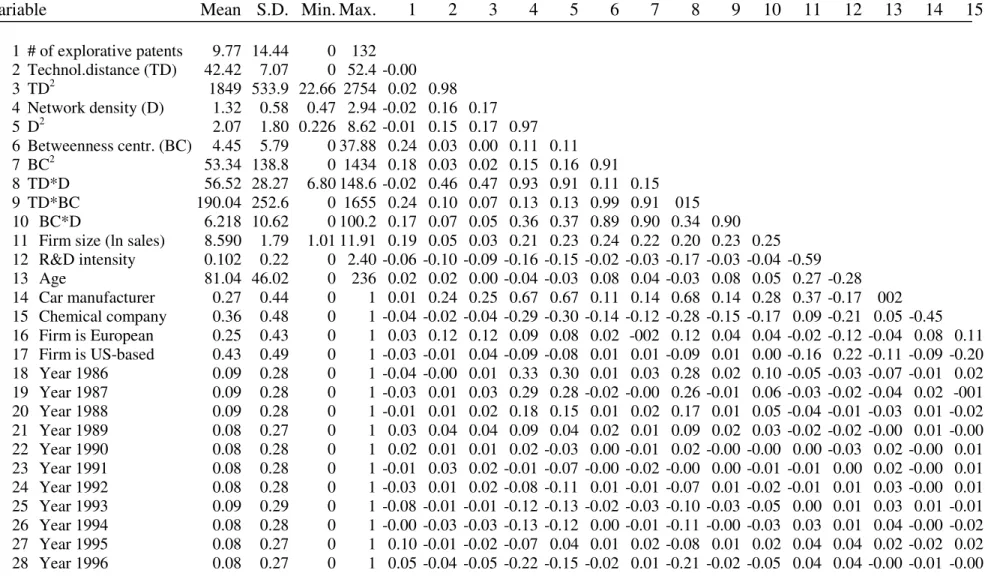
The values for this variable in table 2 indicate that the average technological distance is 42.4 with a standard deviation of 7.1. The maximum distance is 52.5 and the minimum 4.8.
Overall network density: This explanatory variable is a characteristic of the overall alliance network in a particular year for one of the three industries. This variable is "calculated as the number of all ties occurring in the matrix divided by the number of all possible ties.” (Knoke and Kuklinski, 1982). Table 2 shows that the networks are sparse. The network are calculated for each year and each industry: the density ranges from 0.5% tot 2.9%. The average is 1.3%.
Network centrality: The second variable, related to a firm’s alliance network, is its betweenness centrality. Betweenness centrality measures the centrality of a focal firm in a network, and is calculated as the fraction of shortest paths between other companies that pass through the focal firm. Betweenness is, in some sense, a measure of the influence a focal firm has over the information through the alliance network. In other words, it also forms a network-wide (global) measure and takes direct and indirect ties into account. This is important as this indicates in how far a firm can reach potentially all (including also distant) parts of the network. This provides us with an indication of the potential for novel combinations that a firm may have.
We standardized this measure to compare betweenness centralization of firms across different alliance networks – different years and industries. In theory, standardized values can range from 0 to 100. Table 2 indicates that the values for this variable range from 0 tot 38. On average, firms have a network position with a low value for betweenness centrality, but there are a few companies that are in the midst of the action.
Control variables
Other variables can of course also affect the explorative innovation performance of these firms. We included three types of dummy variables. A first one indicates where the company is headquartered geographically. Following the Triad-concept of the world economy, a company can be headquartered in North America, Asia or Europe - the default is Asia (Ohmae, 1985). Firms that are headquartered in different countries may differ in their propensity to patent. Annual dummy variables were included to capture changes over time in the propensity of companies to patent their
innovations. Finally, we included a dummy variable to indicate whether a company is a car manufacturer or chemical firm (default is the pharmaceutical industry).
Furthermore, we included three organizational variables as controls7. The first one is the age of the company. Older firms, with their accumulated experience, are expected to be better at exploitation, and younger firms, with lower stakes and habituation in old technologies, to be better at exploration. Hence, we expect a negative sign for the coefficient of this variable.
The natural logarithm of ‘corporate revenues’- a proxy for firm size - was included as a control variable. Firm size is expected to enhance exploitative learning (Acs and Audretsch, 1991). Large firms have the financial means and vast technological and other resources to invest heavily in R&D. However, they usually experience problems in diversifying into new technological areas inhibiting experimentation and favoring specialization along existing technological trajectories (Levinthal and March, 1993; March, 1991; Ahuja and Lampert, 2001). As a result, large firms are disadvantaged with respect to exploring new technological fields and will innovate proportionally less than smaller firms in new technological areas (Nooteboom, 1991; Nooteboom and Vossen, 1995).
R&D intensity (R&D expenditures as a percentage of sales) is expected to have a positive impact on exploration: firms that invest heavily in R&D will have a higher rate of innovation assuming that there exists a positive correlation between technological input and output (Pakes and Griliches, 1984). R&D investments also play a role in the ability of companies to recognize, value and assimilate external knowledge. Absorptive capacity is crucial to acquire and integrate external knowledge, especially when the knowledge is tacit. Firms conduct R&D to be more able to use the technology of other companies (Cohen and Levinthal, 1990; Kim, 1998; Mowery and Oxley, 1995). This absorptive capacity argument is particularly relevant in the case of explorative learning because the knowledge to transfer is tacit and the focal firm has not yet built any capabilities in these technological areas.
Model estimation
The dependent variable is a count variable and only takes nonnegative integer values - i.e. the number of patents a firm filed for in a particular year in patent classes in which it has not issued patents during the past 5 years. A Poisson regression approach provides a natural baseline model for such data (Hausman et al., 1984; Henderson and Cockburn, 1996). Since we use pooled cross-section data with several observations on the same firms at different points in time, we modeled the data using a random effects Poisson estimation8.
The basic Poisson model for event count data can be written as follows:
! ) exp( ) Pr( it y it it it it y y Y it λ λ − = = (10)
Where the parameter λit represents the mean and the variance of the event count
and yit the observed count variable. It is furthermore assumed that:
λit = β’xit (11)
with xit being a vector of independent variables.
7
Those variables were calculated for the year prior to the year of observation. 8
Hausman tests indicate that random effects Poisson models are better than fixed effects Poisson models.
The above specification assumes that the mean and variance of the event count are equal. However, for pooled cross-section count data the variance often exceeds the mean. This overdispersion is particularly relevant in the case of unobserved heterogeneity. The presence of overdispersion does not bias the regression coefficients but the computed standard errors in the Poisson regression are understated resulting in an overestimation of the statistical significance of the coefficients. Therefore, a random effects Poisson estimator used: it does not assume within-firm observational independence for the purpose of computing standard errors. For the random effects Poisson estimator equation (2) is changed into:
λit = β’xit + ui (12)
where ui is a random effect for the ith firm and reflects the firm-specific
heterogeneity.
Unobserved heterogeneity may be the result of differences between companies in their innovation generating capabilities, and as a consequence, also in their propensity or ability to patent. Such unobserved heterogeneity, if present and not controlled for, can lead to overdispersion in the data or serial correlation. Differences in patenting behavior between companies or between different years are captured by including dummy variables in the model. First, the propensity to patent may be partly determined by the nationality of the companies or the industry to which they belong. Similarly, we introduced annual dummy variables to account for changes over time: they may capture the ever-growing importance of intellectual capital or changing macroeconomic conditions.
Results
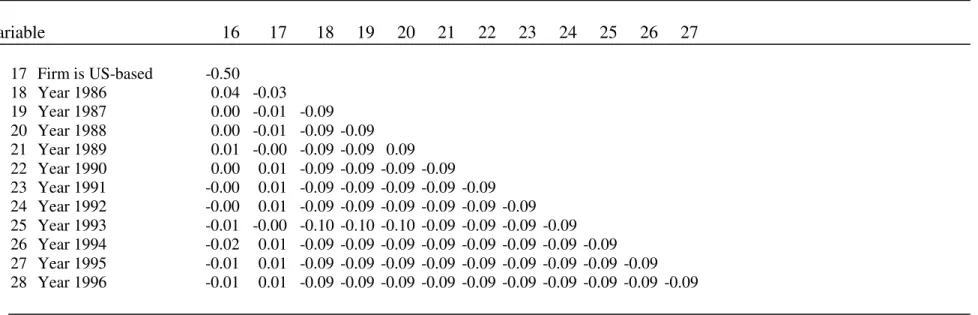
Table 1 represents the description of the different variables. Table 2 provides the descriptive statistics and the correlations between the variables for the 762
observations in the sample. Although the sample represents the prominent firms in the three sectors, there is quite some variance in most of the key variables.
Insert table 1 here Insert table 2 here
Table 3 represents the results of the regression analysis using random-effects Poisson estimations explaining the explorative innovation performance of the firms in our sample. The estimated alpha coefficient is positive and significant. This indicates that important firm-level unobserved effects are present in the data and that a panel estimator is preferred above a pooled Poisson estimator. We focus on the full model (model 2) but also provide the basic model with only control variables (model 1) to show that the coefficients for those variables are robust over the two models.
Insert table 3 here
Technological distance, network density and betweenness centrality and their interaction terms are the independent variables in model 2. The coefficients for the linear and quadratic term of the technological distance variable have the expected sign and are significant. This result corroborates hypothesis 1.
Model 2 also introduces the standardized betweenness centrality of each focal firm and the overall network density as independent variables. Hypothesis 2, claiming an inverse U-shaped relation between the betweenness centrality and exploration is also corroborated. According to hypothesis 3 we expect that exploration is also an inverse-U shaped function of network density. The positive sign for the linear term and the negative sign for the quadratic term indicate that we also find evidence for hypothesis 3.
Model 2 also introduces the pairwise interaction terms between the three explanatory variables to test hypothesis 4, 5 and 6. We expect a negative interaction effect between technological distance and betweenness centrality (hypothesis 4), a positive interaction effect between technological distance and density (hypothesis 5), and a positive interaction effect between betweenness centrality and density (hypothesis 6). As table 3 shows, the signs of these three interaction terms are correct but the coefficient for the interaction term between technological distance and network density is not significant. As a result, hypothesis 4 and 6 are confirmed but there is no confirmation for hypothesis 5.
DISCUSSION AND CONCLUSIONS
The joint impact of the three explanatory variables can only be understood if we take all variables in model 2 – linear, quadratic and interaction terms – simultaneously into consideration. To keep the analysis tractable, we start from the observation that firms can only control or influence relations with their direct partners and have virtually no possibilities to do so beyond their ego-network (Bae and Garguilo, 2004). Therefore, it seems reasonable to consider global density as an exogenous variable for the innovating firms. That leaves them with two variables for dealing with their alliance network when engaging in exploration endeavours, namely their network position and the technological distance with their partners.
Insert figure 1 here
Consider figure 1 that represents the joint effect of technological distance and network centrality, keeping network density constant at the mean level.9 The figure represents the results for the observed range of observations. As the figure shows, a (highly) central position in the network yields ample potential for a high exploration performance, if one works with partners at a very limited technological distance, and when supported by ‘sufficient’ density (mean level). However, if working from such a central position with partners that operate at a large(r) technological distance, performance is halved (dropping steeply from 1000% to below 500%). The interpretation for this finding may be as follows. Being highly central implies a higher chance of being faced with different kinds of knowledge and information (Burt, 1992). This is beneficial for novelty value but also creates a need to understand and integrate potentially unrelated information. Therefore, being highly central requires exploration at small technological distances in order to be able to absorb knowledge from all parts of the network. The price for not doing so is a sharp decrease in one’s
9
The boundary values for technological distance and network centrality were calculated as the mean plus or minus two times the standard deviation. We further restricted the range when these values exceeded the minimum or maximum observed values as indicated in Table 2.
innovation performance. When centrality lowers, we also notice a decrease in innovation performance, from 1000% down to below 600%. In other words, a central position is most advantageous, especially at a very small technological distance, and remains so for a wide range of technological distances.
In contrast, a highly peripheral position (at very low or minimal BC) forms a liability as it shows a much lower performance compared to more central positions. Although an important difference is that such positions initially show an increase in innovation performance when technological distance increases. Moreover, being at the periphery can be advantageous at very high levels of technological distance, where more central firms perform comparatively lower. This may be interpreted as follows. Being at the periphery generally implies that one is outside the immediate sight of dominant and more central players. Because of this, selection forces to comply with dominant designs and existing systems of production, organization, technical standards and so on, may be somewhat less stringent. Hence, deviating from such prevailing ‘industry recipes’ (Spender, 1989) becomes easier (Gilsing and
Nooteboom, 2006). As a consequence, firms at the periphery may enjoy more freedom to experiment freely with partners at a high technological distance. It might be that this strategy yields more radical innovations with potentially more
technological and economic value. However, the way we measure our dependent variable (based on patents counts) does not take this into account, an issue we come to when discussing limitations and possibilities for future research.
In sum, figure 1 shows that within the range of observations, at mean network density we find that if betweenness centrality is high, yielding problems of absorptive capacity, one cannot afford to also have large technological distance to direct partners, which would compound the problem.
Insert figure 2 here
Still, firms need to also consider the degree of overall density and how it conditions their choices regarding position and technological distance respectively. Consider therefore figure 2 that shows the relation between density and betweenness centrality while keeping technological distance at its mean value. Here we see that the effect of density on innovation performance has a similar, curvilinear effect for both central and peripheral positions. In other words, irrespective of one’s position, high density inhibits the existence and utilization of diversity, and hence of novelty value, while at low levels it does not support absorption sufficiently. The figure shows that even at the mean level of betweenness centrality one needs a certain amount of network density to yield requisite absorptive capacity, and an intermediate (not too high) level of technological distance is best at all levels of network density.
Finally, there are some interesting conclusions to draw from the control variables in model 2 of table 3. There are significant differences between the three industries (chemical industry, car manufacturing and pharmaceutical industry) in their propensity to get involved into explorative innovation. The country of origin of the different companies plays no role in explaining both types of innovation.
Size has a positive and significant effect on the rate of innovation when firms are exploring new technological areas. Since this explanatory variable is in the log form, its coefficient in the Poisson specification can be interpreted as elasticity between firm size and the dependent variable. The coefficient is substantially smaller than one suggesting – ceteris paribus - that the frequency of patenting increases with firm size but less than proportionately. As a result, small firms are more innovative than larger firms when they explore new technologies. This is in line with the results of previous
research on the relation between firm size and R&D (Nooteboom and Vossen, 1995), and with research showing that new and more radical inventions are likely to originate with entrants rather than incumbents (Cooper & Schendel, 1976; Foster, 1986). This finding is also in line with the organizational learning literature: large established organizations have difficulties in diversifying into new technological areas, inhibiting experimentation and favoring specialization along existing technological trajectories (Levinthal and March, 1993; March, 1991; Ahuja and Lampert, 2001).
As expected, R&D-intensity has a positive and significant effect on the innovation rate of the companies in the sample. The age of the firm has a negative but non-significant effect on exploratory patents. This result suggests that established companies that had time to develop capabilities in particular technological fields do not necessarily have a competitive advantage over new entrants in the exploration of new technological fields. By contrast, the negative coefficient for age indicates that newly established firms might have a slight advantage in exploring new technological fields and (although we have no conclusive evidence). This is in line with previous research that focused on the role of new firms in the creation of new technologies (Methe et al., 1997).
Following our findings, we can conclude that our key argument is confirmed, claiming that successful exploration requires a delicate balance between the ‘twin tasks’ of novelty creation on the one hand and its efficient absorption on the other hand. We found that highly central firms enjoy the strongest improvements of their explorative innovation performance and this effect declines steadily when centrality decreases, or alternatively, when technological distances increases. Peripheral positions show the least performance, although such positions can be attractive when cooperating with partners at a very large technological distance. In other words, success rates for exploration are not spread equally across network positions.
However, position alone does not tell the full story. Our empirical findings clearly indicate that exploration success also depends on the two other dimensions of embeddedness, namely technological distance and network density. Therefore, an important conclusion is also that the three elements of network embeddedness need to be considered jointly in order to understand their complementary effects on both novelty creation and absorptive capacity. This is an important finding and contributes to the literature in several ways.
One is that it contrasts with the tradition in the literature on alliances and interfirm networks with its bias towards to the role of position (Powell et al., 2005). The message as conveyed from this study is that for exploration the value of a position depends on the technological distance with others and on the degree of network density.
A second contribution is that the social network literature specifically considers ´social distance´ between any two nodes (here firms) in the network, in terms of the number of links on the shortest path between them. Here we have added technological distance between any two firms. This has enabled us to go beyond the dominant focus on partners’ similarity and to understand the positive role of technological distance in view of exploration. Such a cognition-based view has been largely ignored by the literature with its main focus on the role of economic and social factors regarding alliance formation and the role of network embeddedness (Gulati, 1998; Phelps, 2005).
It also contributes to the literature on learning and innovation that stresses the recombination potential arising from distances in cognition (Nelson and Winter, 1982; Nooteboom 2000; Malerba, 2004), but leaves unexplained what are the associated social structural implications. Moreover, considering the role of global density
enables one to go beyond the dyadic level, which has been mostly studied in the literature (Salancik, 1995; Gulati, 1998; Powell et al., 2005). The focus on dyads reflects an undersocialized view of alliances and ignores in how far positive effects of a central or peripheral position can be mitigated or amplified by the entire structure. We found that this structure, in terms of its density, plays an important role indeed and conditions the potential benefits of different degrees of centrality for exploration. [Beetje herhaling hier volgens mij:] Both for central and peripheral position an intermediate degree of density seems to be most effective. In contrast, high levels of density may inhibit the existence and utilization of diversity, and hence of novelty value, while at low levels it does not support absorption in a sufficient way.
This points to an interesting new insight that sheds a different light on the validity of the arguments of Burt versus Coleman. Success in exploration requires a dual emphasis on the benefits of non-redundant contacts for potential novel combinations as well as on network density in view of integrating the diverse inputs obtained from such contacts. In other words, it seems that both views convey some truth and may be seen as complements instead of opposites as stressed in the literature (Hansen et al., 1999; McEvily and Zaheer, 1999; Rowley et al, 2000; Ahuja, 2000).
Limitations of this study, which may provide directions for future research, are as follows. One is that we have studied exploration that is new to the firm. In other words, we cannot substantiate our claims and findings beyond this relatively moderate degree of exploration. It therefore seems useful in future studies to also consider more radical degrees of exploration such as the discovery of ‘newly emerging’ technologies (new to the industry) or ‘pioneering’ technologies (new to the world) respectively (Ahuja and Lampert, 2001). For these kinds of exploration one needs partners at presumably (much) larger technological distances than considered here and we anticipate that this will have major implications for the role of both betweenness centrality and density.
A second limitation relates to our dependent variable. We have counted the number of explorative patents for each firm and in this way have treated all patents equally. Of course, patents differ in technological and economic value and taking this into account would definitely enrich future work in this field. Weighing patents based on the number of citations that they receive seems a straightforward way to do this (Ahuja and Lampert, 2001). Such an approach would also enable to study the validity of our conjecture that peripheral firms have better possibilities for more radical exploration when compared with central firms. A final limitation is that we did not consider the effect of 'tie strength' on exploration. Different types of alliances can be weighted according to the ‘strength’ of the relationship as some authors did (see Contractor and Lorange, 1988; Gulati 1995b; Nohria and Garcia-Pont, 1991). This was beyond the scope of the current paper and would require additional research and hypothesis building regarding which alliance type is more instrumental for the exploration of new technologies.
References
Acs, Z., D.B.Audretsch. 1991. Innovation in large small firms: An empirical analysis.
American economic Review. 78 678-690.
Ahuja, G. 2000a. Collaboration networks, structural holes, and innovation: A longitudinal study. Administrative Science Quarterly, 45: 425-455.
Ahuja, G. 2000b. The duality of collaboration: inducements and opportunities in the formation of interfirm linkages, Strategic Management Journal, 21(3): 317-343. Ahuja, G. & Lampert, C.M. 2001. Entrepreneurship in the large corporation: A
longitudinal study of how established firms create breakthrough inventions.
Strategic Management Journal, 22: 521-543.
Ahuja, G., & Katila, R. 2004. Where do resources come from? The role of idiosyncratic situations. Strategic Management Journal, 25(8-9): 887-907. Bae, J. and Gargiulo, M. (2003). Local action and efficient alliance strategies in the
Telecommunications Industry. INSEAD working paper.
Beerkens, B.E. 2004. External acquisition of technology: Exploration and exploitation in internatiional innovation networks, ECIS, 158 p.
Berg, S.V., J. Duncan and P. Friedman, 1982, Joint venture strategies and corporate innovation, Cambridge (MA), Oelgeschlager, Gunn & Hain.
Buchko, A.A.. 1994. Barriers to strategic transformation: interorganizational networks and institutional forces. Advances in Strategic Management. Volume 10B, 81-106.
Burt, S. 1992. Structural holes: The social structure of competition, Harvard University Press, Cambridge, MA.
Burt, R.S. 2004. Structural holes and good ideas. American Journal of Sociology. 110(2) 349-399.
Carrol G.R. and M.T. Hannan, 2000. The demography of corporations and industries. Princeton University Press, Princeton.
Cohen, M., D. A. Levinthal, 1990. Absorptive capacity: a new perspective on learning and innovation. Administrative Science Quarterly. 35 128-152.
Coleman, J. S. 1988. Social capital in the creation of human capital. American Journal of Sociology. 94 S95-S120.
Cooper A, D. Schendel. 1976. Strategic responses to technological threats. Business Horizons 19(1): 61–69.
Duysters, G.M. and C.E.A.V. Lemmens, 2003. Alliance group formation: enabling and constraining effects of embeddedness and social capital in strategic technology alliance networks. International Studies of Management and Organization, 33, 49–68.
Fleming, L. and Sorenson, O. 2001. Technology as a complex adaptive system: evidence from patent data, Research Policy, 30, 1019-1039.
Foster R. 1986. Innovation: The Attackers Advantage. New York: Summit Books. Gilsing, V.A. 2005. The dynamics of innovation and interfirm networks,
exploration, exploitation and co-evolution. Edward Elgar, Cheltenham.
Gilsing, V.A., B. Nooteboom. 2005. Density and strength of ties in innovation networks, an analysis of multimedia and biotechnology. European Management Review, 2, 179 - 197.
Gnyawali, D.R. and R. Madhavan, 2001. Cooperative networks and competitive dynamics: a structural embeddedness perspective, Academy of Management Review, 26, 431–45.
Gomes-Casseres, B. (2001), ‘The logic of alliance fads: why collective competition spreads’, in M.P. Koza and A.Y. Levin (eds), Strategic Alliances and Firm Adaptation: A Coevolution Perspective, M.E. Sharpe.
Griliches, Z. 1979. Issues in Assessing the Contribution of Research and Development to Productivity Growth. Bell Journal of Economics. 10(1) 92-116. Griliches, Z. 1984. Patents and productivity, NBER: Chicago, IL.
Gulati, R. 1995a. Does familiarity breed trust? The implications of repeated ties for contractual choice in alliances. Academy of Management Journal, 30(1): 85-112. Gulati, R. 1995b. Social structure and alliance formation patterns: A longitudinal
analysis. Administrative Science Quarterly, 40(4): 619-652.
Gulati, R. 1998. Alliances and Networks. Strategic Management Journal. 19 293-317.
Gulati, R., M. Garguilo 1999. Where do interorganizational networks come from?
American Journal of Sociology. 104(5) 1439-93.
Gulati, R., N. Nohria and A. Zaheer, 2000. Strategic networks. Strategic Management Journal, 21, 203–15.
Hagedoorn, J. 1993. Understanding the rationale of strategic technology partnering: Interorganizational modes of cooperation and sectoral differences. Strategic Management Journal, 14: 371-385.
Hagedoorn, J., A.L. Link and N. Vonortas, 2000, Research partnerships, Research Policy, 29, pp. 567-586.
Hagedoorn, J. G.M. Duysters. 2002. Learning in dynamic inter-firm networks, the efficacy of quasi-redundant contacts. Organization Studies. 23, 525-548. Hamel, G. 1991. Competition for competence and inter-partner learning within
international strategic alliance. Strategic Management Journal, 12, Special issue: 83-103.
Hamel, G. 1991. Competition for competence and inter-partner learning within international strategic alliance. Strategic Management Journal, 12, Special issue: 83-103.
Hansen, M.T. 1999. The search-transfer problem: The role of weak ties in sharing knowledge across organization subunits. Administrative Science Quarterly. 44 82-111.
Hargadon, A., Sutton, R.I. (1997) Technology brokering and innovation in a product development firm. Administrative Science Quarterly, 42, 716-749.
Hausman J., B. Hall, Z. Griliches 1984. Econometric models for count data with an application to the patents-R&D relationship. Econometrica. 52 909-938.
Henderson, R.M., K.B. Clark 1990. Architectural Innovation: The Reconfiguration of Existing Product Technologies and the Failure of Established Firms,
Administrative Science Quarterly, 35, 9-30.
Henderson, R., I. Cockburn. 1996. Scale, scope and spillovers: the determinants of research productivity in drug discovery. Rand Journal of Economics. 27(1) 32-59.
Holland, J.H. 1975. Adaptation in natural and artificial systems. Ann Arbor, The University. of Michigan Press.
Kim, L. 1998. Crisis construction and organizational learning: Capability building in catching-up at Hyundai Motor. Organization Science. 9 506-521.
Knoke, D. and J.H. Kuklinski. 1982. Network analysis, Series: Quantitative applications in the social sciences, Sage : Beverly Hills and London.
Kogut, B. 1988. A study of the life cycle of joint ventures. F. Contractor, P. Lorange, eds. Cooperative Strategies in International Business, Lexington Books, Lexington, MA, 169-186.