Design Patterns for Rapid Visualization Prototyping
Mark Giereth and Thomas Ertl
Visualization and Interactive Systems Institute, University of Stuttgart
{
giereth,ertl
}
@vis.uni-stuttgart.de
Abstract
In this paper we present three software design patterns for rapid prototyping of information visualization applica-tions. The first pattern describes a mapping of object ori-ented models to relational data tables used in many visual-ization frameworks. The second pattern describes a script based approach for the configuration of visualization ap-plications. The third pattern addresses the problem of per-forming online changes on the visual mapping by enhanc-ing fine-grained mappenhanc-ing operators with scriptenhanc-ing capabil-ities. We present an implementation of the patterns, which is based on the Prefuse toolkit. Finally we discuss some experimental results according to performance issues.
1. Introduction
Information visualization is an established instrument for the analysis of data and has become an integral part of most analytical systems. Visualization functionality is integrated into the overall system design to provide visual aid to specific analysis problems. The structure of software systems and the communication between its modules can be described in an abstract way in terms of software design patterns. Software design patterns are reusable solutions for common design problems that often occur during software development.
In this paper we present three design patterns that focus on problems in the field of visualization prototyping. Our approach is motivated by the aspect that - especially in vi-sualization development - the communication with domain experts and end users is very important. We therefore focus on the prototyping aspect in visualization development. We propose patterns that incorporate scripting in order to give the possibility of changing existing algorithms, adding new algorithms, and modifying configurations online.
Our approach is further motivated by the following re-quirements. First, it should be possible to discuss proto-types online with domain experts and end users and do changes during the discussion to get an immediate
feed-back. Second, in the context of preparation of teaching material, students should be able to change and modify the material and should directly see the results of their changes. Third, within software development projects, visualization development should be a continuous process that allows ex-changing quick adhoc implementations (e.g., done during a user session) with efficient implementations later on.
2. Related Work
During the last two decades various authors have de-scribed software design patterns for user interface design and information visualization [17, 3, 1, 8]. More general purpose design patterns have been described in the well-known books of Gamma et al. [5] and Grand [7]. Gamma et al. divide patterns into creational, structural and behavioral patterns. The Grand further describes patterns for partition-ing and concurrency.
In the area of information visualization the reference model pattern described in Card et al. [1] is widely used by many visualization toolkits. It describes a pipeline of transformations from raw data on the one end to visual rep-resentations on the other end (see figure 1). Raw data are first transformed into data tables. This step is referred to as data transformations. Data tables are the building blocks within this model. In the second step visual attributes, such as shapes, color, size, position in space, etc. are added to the data. This step is called the visual mapping. The result is a visual data structure ready to be rendered into a specific rep-resentation. The result of the rendering is called the view. Users interact with the view and can trigger changes on the view (e.g. zooming), the visual structure (e.g. change of shape or color), or on the data itself (e.g. filtering, update or replacement of data).
Chen [2] describes nine design patterns that summarize commonly used techniques in the process of dynamic an-alytical data visualization and proposes an architecture de-sign for a visualization library.
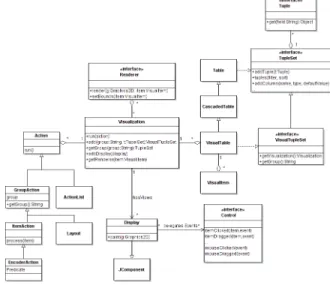
More recently Heer and Agrawala have proposed a set of patterns for information visualization [8] that have been implemented in the Prefuse toolkit [9]. Figure 2 gives a
sim-Figure 1. InfoVis Reference Model
plified overview of the Prefuse structure. The central class isVisualization, which has associatedVisualTable,Action, Renderer, andDisplayobjects. VisualTableobjects repre-sent the visual structures to be rendered. They are backed up by data tables (Tableobjects) using the cascaded table pattern describes in [8].VisualTableobjects extend the data tables by additional columns for visual properties such as color, shape, size, position, etc. Each row of aVisualTable represents oneVisualItemobject. AVisualItemis rendered to one or moreDisplayinstances using an associated Ren-derer. Actionsare used for data transformations (e.g. for filtering), visual mappings (e.g. for defining the color, size or shape), and for view transformations (e.g. zooming or animation). An important concept is the concept of visual groups. Groups are identifies for sets ofVisualItems. Ac-tionscan be assigned for each such set. An example for an action is the layout of items. ALayoutaction computes the location of all items of a certain group in terms of (x,y)-coordinates. EncoderActionsuse aPredicateto restrict to certain items of a group, e.g. changing the foreground color only of items that are currently selected. Finally, Control objects handle user input, e.g. dragging of an item to a new location.Controlsthen usually invoke one or more Actions to perform the changes on the data.
Another important trend in today’s software develop-ment is the use of scripting languages, for example in the current Web 2.0 development [14]. We can distinguish two different approaches of using scripting languages for the creation of visualization prototypes. The first approach is to provide a special purpose programming (or scripting) language for developing visualization prototypes. Exam-ples for this approach are Vanish [10], Summon [15], Pro-cessing [16], or Mondrian [12]. The second approach is to use scripting languages as glue for combining visualization components, such as in JyVis [11]. The JyVis approach is related to our approach, with the difference that JyVis pro-vides a set of high-level visualization primitives and UI wid-gets rather then integrating scripting into low-level patterns.
3. Contribution
In the following we will describe three patterns that im-prove the flexibility of the overall reference model (fig-ure 1). As starting point we refer to the design patterns
Figure 2. Structure of the Prefuse framework
described by Heer and Agrawala [8] used in the Prefuse framework [9]. The overall structure is shown is figure 2. The following patterns focus in particular on the integration of object oriented data models and on the usage of scripting to simplify visualization prototyping. Each pattern has a name, a synopsis, an UML class diagram, and a description that includes the context of use and examples. The patterns described in this section are: the Virtual Table pattern, the Scriptable Configuration pattern, and the Scriptable Opera-tion pattern.
3.1. Virtual Table
Synopsis: Provide a logical table view for object oriented data models. Enable declarative typed mappings from object methods to table columns.
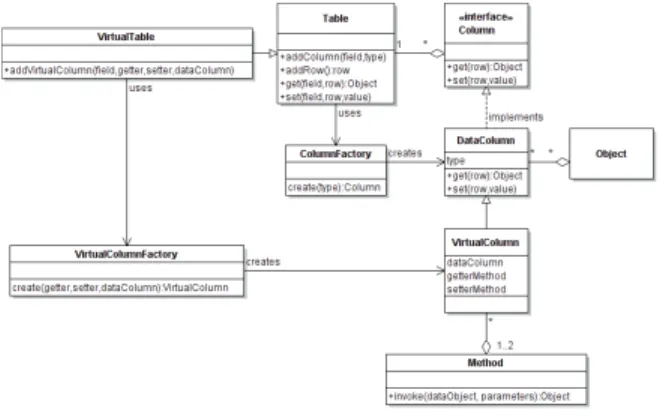
Many information visualization toolkits use relational data tables for the internal data representation. When a new visualization prototype has to be developed for application with an existing object oriented data model, the model usu-ally has to be transformed to a data table structure program-matically. The virtual table pattern (see figure 3) is an ex-tension of the data column pattern described in [8]. It can be directly applied to object models and provides a declarative mapping from object methods to data columns. This allows a more seamless integration of object models into table ori-ented visualization toolkits without the need of copying the data into table structures.
A VirtualTableis a Tablethat consists of one or more VirtualColumnsand at least oneDataColumn. Theget(row) method of a VirtualColumninvokes the associated getter Method and returns the method’s return value. The
Figure 3. Virtual Table pattern
set(row,value) method of a VirtualColumn invokes the associated setter Method. Each VirtualColumn has an associatedDataColumnthat contains the objects on which the methods are invoked. In the following, we give a template for aVirtualColumnimplementation:
1: procedureGET(row)
2: Objecto←dataColumn.get(row) 3: returngetterMethod.invoke(o) 4: end procedure
1: procedureSET(row, value) 2: Objecto←dataColumn.get(row) 3: returnsetterMethod.invoke(o, value) 4: end procedure
Example: Consider a simple model with a Personand aPersonCollectionclass. A person has a name, which can be accessed by using the getter methodgetName()and the setter methodsetName(String). For mapping this model to a table using the virtual table pattern, the declarations (1-4) have to done. Then the virtual table can be filled by just adding references to the data objects (5-8). Afterwards the column namedlabelcan be accessed the same way as for a normal table. The get() method of the label column is mapped to thegetName()method of thePerson class and theset()method is mapped to thesetName(String).
1: g←new Method(”getName”,noargs) 2: s←new Method(”setName”, String) 3: vt←new VirtualTable
4: vt.addColumn(”data”,Person)
5: vt.addVirtualColumn(”label”,g,s,”data”) 6: for allPersonpin PersonCollectiondo 7: row←vt.newRow()
8: vt.set(”data”,row,p) 9: end for
Data values have not to be copied from the object model to a table structure. The values are directly read from the ob-ject by using corresponding getter and setter methods. The mapping is dynamically done during runtime, which allows customizing the construction of virtual tables by an external configuration file rather then to hard code it and thus eases
the construction of rapid visualization prototypes.
An extension of this pattern would be to provide method parameters. They could be specified in additional columns similar to the definition of theDataColumnholding the ob-ject reference. Then eachVirtualColumnneeds to know in whichDataColumn the parameter value has to be looked up. Another possibility would be to define additional meth-ods on the object, whose return values are interpreted as method parameters. In a simpler case, where only constant parameter values have to be provided, they could be stored as attributes of aVirtualColumninstance.
3.2. Scriptable Configuration
Synopsis: Outsource the visualization configuration to an external configuration script. Using a script allows chang-ing the configuration without the need of recompilation.
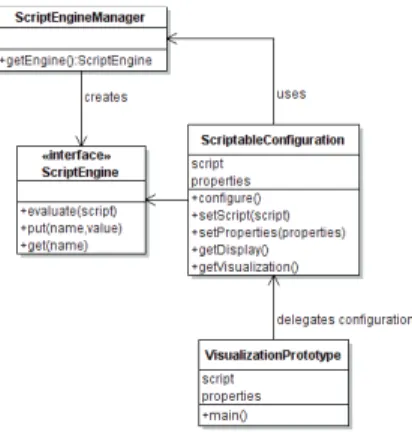
As shown in figure 2, the configuration of a visualiza-tion prototype involves many different components, such as components for layout, interaction handling, rendering, etc. The scriptable configuration pattern delegates the configu-ration of visualization components to a script rather then using a hard coded implementation.
Figure 4 shows the main participating classes. The Visu-alizationPrototypeis considered to be the main class that sets up the visualization. The configuration is outsourced to a script and optional properties, for example constants, such as color, labels, fonts, etc. AScriptableConfiguration instance must have access to the script and the optional properies. In the first step a ScriptEngineis created using aScriptEngineManager. Then the properties are inserted into the Bindings of the engine, so that the script has access to relevant properties (optional). In the second step the script is executed by calling the evaluate() method. The method updates the Bindings. They must at least contain a valid binding for a Display and Visualization, which are accessible bygetDisplay()andgetVisualization(). The following pseudocode shows how to use the script-able configuration pattern. After theVisualizationand the Displayhave been initialized (5-6), they can be used and added to the corresponding graphical user interface.
1: procedureMAIN(script)
2: c←new ScriptableConfiguration 3: c.setScript(script) 4: c.configure() 5: v←c.getVisualization() 6: d←c.getDisplay() 7: end procedure
Figure 4. Scriptable configuration pattern
3.3. Scriptable Operator
Synopsis: Provide a flexible mechanism for changing the behavior of an operation by calling script methods. The script methods can either modify an existing implemen-tation by being called before and/or after the original implementation, or can replace the original implementa-tion.
In contrast to monolithic widgets, anOperatorhas a sin-gle method that defines one specific operation on a Visu-alizationinstance, e.g. setting the color or calculating the layout of a group of items.Operatorssimplify the creation of new functionality by encapsulating a specific functional-ity on a fine-grained level so that this functionalfunctional-ity can be reused in different contexts. In a visualization application many operators have to work together. The scriptable ator (structure shown in figure 5) allows changing an oper-ator implementation after compilation. A scriptable opera-tor defines three hooks on which a script could change the outcome: before the original implementation is called ( set-MethodBefore), after the original implementation has been called (setMethodAfter), or instead of the original imple-mentation (setMethodReplace).
Figure 5. Scriptable operator pattern
Scenario 1, Layout post-processing: A possible scenario would be the modification of a default layout to handle spe-cific constraints. For example to use a force directed graph layout for setting the node positions. If the nodes have vari-able sizes further post processing is needed in order to re-move overlapping, e.g. by applying a force transfer algo-rithm, that resolves node overlapping. Figure 6 shows the structure of such a scenario. The force transfer algorithm could be implemented by a script that is set by setMethod-After(). The scriptable operator pattern allows to simulate inheritance, in environments that do not provide this func-tionality.
Figure 6. Layout post-processing scenario
Scenario 2, Scripting of event handlers: In this scenario a ScriptableControlclass has been derived fromControl. The scriptable version delegates its implementation to mul-tipleScriptableOperator instances, each implementing on specific functionality. The structure is shown in figure 7.
Figure 7. Scripting of event handlers scenario
Scenario 3, Scripting of Renderers: In this scenario a ScriptableRendererimplements theRendererinterface and delegates the implementation to aScriptableOperatorthat uses a script to realize the needed functionality (figure 8).
Although it is useful to script the rendering for rapid pro-totyping, it will likely be a serious bottleneck for the final system. The reason for is the large number of method in-vocations. Note that renderer code is called for each item (which could be thousands). In case of animation the ren-dering code is called several times for each item. Section 5 will further discuss this topic.
Figure 8. Scripting of renderers scenario
4. Application
We have used and tested the patterns described above within an ongoing research project that investigates new techniques for the visualization of patent information in a web based environment. Since the amount of data is very high, an efficient data object model has been developed that also implements parts of the application logic, e.g. to asynchronously load patent data on demand from different data sources. An important design decision therefore was the ability to reuse this object model also for the visual-izations. This section describes a prototypical implementa-tion of the patterns described in the previous secimplementa-tion. The implementation is realized in Java as an extension of the Prefuse toolkit. It uses the Scripting for the Java Platform API (JSR 223) in conjunction with the default JavaScript engine shipped with the Java 6 development kit. Instead of JavaScript other scripting languages, such as Jython, JRuby, Groovy, or JavaFX could also be used.
In the following we show an example snippet that cre-ates a treemap representation of the upper four levels of the International Patent Classification (right lower part of fig-ure 9). The original example without using scripting pat-terns has been described in [6]. In the code the Java classes used in the script are highlighted. The script shows how easy the configuration of a visualization prototype can be done by an external script.
1: // 1. load data model and map to table
2: var ipcmod = IPCModel.load("http://..."); 3: var table = mapToTable(ipcmod);
4: // 2. create and init visualization
5: var vis = new Visualization(); 6: vis.addTable("ipc",table) 7: // init renderer
8: var r = new CushionTreeMapRenderer(); 9: var rf = new DefaultRendererFactory(); 10: rf.setDefaultRenderer(r);
11: vis.setRendererFactory(rf);
12: // define actions for color and layout 13: var al = new ActionList();
14: al.add(createNodeColorAction()); 15: al.add(new TreeMapLayout("ipc"));
16: al.add(new RepaintAction()); 17: vis.putAction("NodeAct", al);
18: // 3. create and init display instance
19: var display = new Display(vis); 20: var infoCtrl = new MouseClickControl( 21: new MouseClickHandler()
22: handleItemClicked : function (item, evt) 23: var ipc = item.get(Const.USERDATA); 24: println(ipc.toParamString());); 25: display.addControlListener(infoCtrl);
The above snippet contains the following steps: First, loading an object model for patents from an URL and map-ping it a virtual table. Second, the creation and initialization of aVisualizationinstance, which involves the creation and configuration ofActionsthat define the visual mapping and the creation and configuration of Renderer instances that define the output format. Third, the creation and initializa-tion of a Displayand an associated Control instance that handles the user interaction.
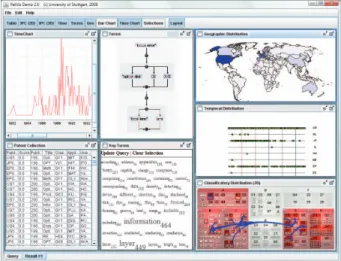
Figure 9. PatViz prototype
Figure 9 shows a screenshot of the PatViz prototype, which is based on the patterns described in this paper. It shows different visualizations for patent metadata, such as the temporal distribution of a patent collection (left upper, right middle), the term distribution (middle bottom), the ge-ographical distribution (right upper) and the classificatory distribution (right bottom).
The interaction in this example is defined by the MouseClickControl, which simply prints the label of the se-lected item. More complex controls can be realized, either in the framework itself or via scripting. All mouse and key-board events can be processed and can trigger an modifica-tion of the data transformamodifica-tion, the visual mapping or the view transformation.
5. Discussion
A general shortcoming of each scripting approach, is a slower program execution. This has two reasons: first the script interpreter is slower then native code or code that has been precompiled into a certain intermediate format (e.g., Java Bytecode). The second reason is due to fact that there has to be marshalling and unmarshalling of objects between the scripting engine environment and for example the Java virtual machine. This marshalling needs additional time, which is sometimes higher then the execution time of the script.
In the following we have measured the scripting perfor-mance. As scenario we have set a color attribute of a visual primitive to a specific integer value. The method has been invoked for 4 Million items. The default scripting engine (JavaScript) that comes with JDK 1.6 needed 277.4 seconds (≈14 invocations per millisecond). An optimization using the Mozilla Rhino engine with a shared context between the calls took 18.2 seconds (≈231 invocations per millisec-ond). The pure Java implementation needed 2.0 seconds (≈1924 invocations per millisecond). The Java implemen-tation was more then 100 times faster. As a consequence we do not suggest to use scripting in program parts that are called very often, such as for rendering. For initialization or event handling on the other side, we do not expect a serious loss of performance.
6. Conclusions
We described the three patterns for visualization proto-typing that are based on the integration of existing object models (virtual table pattern) and on the usage of scripting (scriptable configuration and scriptable operator patterns). In contrast to other visualization prototyping approaches (e.g., the ones mentioned in section 2) we propose a hybrid usage of well-engineered visualization framework compo-nents on the one hand and scripting on the other hand. The basic ideas of using scripts are to simplify the configura-tion by outsourcing it to scripts and to separate new or ex-perimental algorithms from the components in the frame-work, also by using scripts. For future work we are going to restructure the script code making use of scripting frame-works such as Mootools [13], Dojo [4] or YUI [18]. This is exprected to improve the reusability and extensibility of scripts and also will provide a clearer script structure.
7. Acknowledgements
The work presented in this paper has been funded by the European Commission within the PATExpert project (http://www.patexpert.org, FP6 028116).
References
[1] S. Card, J. Mackinlay, and B. Schneiderman, editors. Read-ings in Information Visualization: Using Vision to Think. Morgan Kaufman, 1999.
[2] H. Chen. Towards design patterns for dynamic analytical data visualization. InSPIE Visualization and Data Analysis, 2004.
[3] W. Cunningham and K. Beck. Using pattern languages for object-oriented programs. InOOPSLA-87, 1987.
[4] Dojo.http://dojotoolkit.org/, 2008.
[5] E. Gamma, R. Helm, R. Johnson, and J. Vlissides. Design Patterns: Elements of Reusable Object-Oriented Software. Addison-Wesley, 1994.
[6] M. Giereth, S. S. Koch, M. Rotard, and T. Ertl. Web based visual exploration of patent information. In 11th Inter-national Conference on Information Visualization (IV’07), 2007.
[7] M. Grand.Patterns in Java Volume 1. Wiley, 1998. [8] J. Heer and M. Agrawala. Software design patterns for
in-formation visualization.IEEE Transactions on Visualization and Computer Graphics, 12(5), 2006.
[9] J. Heer, S. K. Card, and J. A. Landay. Prefuse: A toolkit for interactive information visualization. InCHI, 2005. [10] R. Kazman and J. Carriere. Rapid prototyping of
informa-tion visualizainforma-tions using vanish. InIEEE Symposium on In-formation Visualization (INFOVIS ’96), 1996.
[11] C. Kelleher and G. Grinstein. Jyvis - a flexible high level visual-analytic framework. Technical report, University of Massachusetts Lowell, 2007.
[12] T. G. M. Meyer and M. Lungu. Mondrian: An agile in-formation visualization framework. InACM Symposium on Software Visualization, 2006.
[13] Mootools.http://mootools.net/, 2008.
[14] T. O’Reilly. What is web 2.0 - design patterns and business models for the next generation of software, 2005.
[15] M. Rasmussen. Summon - visualization prototyping and scripting. Technical report, Massachusetts Institute of Tech-nology, 2008.
[16] C. Reas and B. Fry.Processing: A Programming Handbook for Visual Designers and and Artists. MIT Press, 2007. [17] T. Reenskaug. Thing-model-view-editor - an example from
a planningsystem. Technical report, Xerox PARC, 1979. [18] Yahoo User Interface Library (YUI). http://