PROBING NEUROCHEMISTRY WITH FAST-SCAN CYCLIC VOLTAMMETRY
Pavel Takmakov
A dissertation submitted to the faculty of the University of North Carolina at Chapel Hill in partial fulfillment of the requirements for the degree of Doctor of Philosophy in the
Department of Chemistry
Chapel Hill 2011
Approved by:
R. Mark Wightman
Royce W. Murray
Nanncy L. Allbritton
Max L. Berkowitz
ABSTRACT
Pavel Takmakov
PROBING NEUROCHEMISTRY WITH FAST-SCAN CYCLIC (under the direction of R. Mark Wightman)
“Fast-scan cyclic voltammetry (FSCV) with carbon-fiber microelectrodes is a prominent analytical technique for rapid and sensitive detection of electrochemically active analytes in mammalian brain. In recent years this technique became very popular among neuroscientists. However, many improvements for FSCV are possible. Chapter 1 introduces the technique and provides brief description of recent improvements in fast-scan cyclic voltammetry.
During voltammetric experiments, potential applied to electrodes changes carbon surface. Chapter 2 describes investigation of the changes induced by waveforms with anodic potential limits of 1.0 V, 1.3 V and 1.4 V. Instrumental methods of analysis such as XPS, AFM and SEM together with electrochemical studies were used. It was observed, that for waveforms with high anodic potential (1.3 V and 1.4 V) carbon electrode surface continuously oxidizes and etches away. Thus, the electrode surface which has surface groups that promote adsorption of catechols is constantly renewed. A benefit of surface renewal is sustainability to chemical fouling.
Carbon electrode surface has electrochemically active chemical groups which are oxidized and reduced during voltammetric potential ramps. Electrochemical reactions for these groups involve protons, thus changes in pH of solution generate characteristic cyclic voltammograms. Hence, FSCV can be used to sample rapid pH fluctuations in the brain that are associated with metabolism and changes in the cerebral blood flow. However, cyclic voltammograms for pH changes recorded in brain in vivo and in the flow cell have different shapes, which compromises the identity of pH signal. Chapter 3 describes investigation of the peaks in cyclic voltammogram for pH which led to the conclusion that adsorption of electrochemically inert species to electrode surface is responsible for the interference and the mismatch. Identity of pH signal in brain in vivo was confirmed by inducing acidosis by increasing concentration of carbon dioxide in breathing mixture (hypercapnia). Acidic pH shift with characteristic cyclic voltammogram was recorded with FSCV in hypercapnia.
brain can be studied. Also, microelectrodes in the array are independently addressable which means that multiplexed detection of different analytes in brain can be performed simultaneously.
Instrumentation for FSCV experiments in freely moving animals is custom made which limits the dissemination of this technique. Chapter 5 describes instrumentation for FSCV experiments for combined electrochemical and electrophysiological measurements in details. All electronic components are documented and layouts of electronic circuits are provided in this chapter.
ACKNOWLEDGEMENTS
Many people have contributed to my work. First, I would like to thank my PhD advisor, Dr. R. Mark Wightman, who guided me through my research endeavors and helped me to develop into a scientist. Dr. Wightman has always been available for advice and support. He was a great source of inspiration and I’m very grateful for his mentoring.
I want to thank my wife, Marina Krylova, for her continuous support and assistance. Marina has demonstrated a lot of patience towards my inclination to spend extra time in the lab instead of spending it with her at home.
I want to thank my immediate and extended family for being supportive during period of my study. I’m glad that they accepted the path that I chose and supported me all the way through.
I would like to thank postdoctoral fellows Dr. Parastoo Hashemi, Dr. Zoe McElligott-Kash and Dr. Nina Owesson-White for their support, advices and discussions.
Dr. Carrie Donley and CHANL facility members have been extremely helpful with instrumentation for surface analysis and consultations. I appreciate their contribution very much.
I want to thank my coworkers, Jenny Ariansen, Anna Belle, Elizabeth Bucher, Elyse Dankoski, Adam Dengler and Paul Walsh, for assistance with the experiments and support in and beyond the lab.
I would like to thank former Wightman Lab members who formed my extended “scientific family” and were “role models” for me: Dr. Nii Addy, Dr. Evgeny Budygin, Dr Michael Heien, Dr. Natalie Herr, Dr. Charlie Miller, Dr. Jelena Petrovic, Dr. Paul Phillips. I’m grateful for all insightful discussions that we had every year at Pittsburgh Conference and Society for Neuroscience meetings.
I want to thank faculty members at the Department of Chemistry and at University of North Carolina Neuroscience Center for answering many of my questions and dramatically expanding horizons of my knowledge.
Also, I want to thank my friends, Dr. Pavel Aronov (Stanford University) and Dr. Ivan Vlassiouk (Oak Ridge National Laboratory), for many valuable scientific discussions and advices.
I appreciate financial support from NIH, Eli Lilly and Eastman Chemical Company
TABLE OF CONTENTS
List of Figures………...xiii
List of Abbreviations and Symbols………....xv
Chapter 1. Advancements in Probing Neurochemistry with Fast-Scan cyclic Voltammetry ... 1
Introduction ... 1
Dynamic State of Carbon Surface and regeneration of Adsorption Sites ... 8
Measurement of pH in Brain In Vivo and Interference from Adsorption ... 12
Microelectrode Arrays for voltammetric Measurements in Brain In Vivo ... 15
Dissertation Outline ... 19
References ... 20
Chapter 2. Carbon Microelectrodes with a Renewable Surface ... 25
Introduction ... 25
Materials and Methods ... 27
Chemicals. ... 27
Fabrication of Carbon Fiber Microelectrodes.. ... 28
Fabrication of PPF Electrodes. ... 28
Electrochemical Experiments.. ... 29
Flow Injection Apparatus. ... 31
XPS Analysis ... 31
AFM Imaging ... 32
Scanning Electron Microscopy ... 33
Optical Microscopy ... 33
Data Analysis ... 33
Results and Discussion ... 34
Effect of Applied Potential on Background Current of Carbon Microelectrodes ... 34
Characterization of Surface Effects of Potential Cycling on PPF Electrodes ... 37
Physical Changes Caused by Electrochemical Potential Limits ... 40
Increased Adsorption of Catecholamines Resulting from Oxidative Etching of Carbon Fiber Microelectrodes ... 46
Recovery of Fouled Carbon Microelectrodes by Overoxidative Surface Renewal.. ... 50
Conclusions. ... 52
References ... 54
Chapter 3. Characterization of Local pH Changes in Brain Using Fast-Scan Cyclic Voltammetry with Carbon Microelectrodes ... 59
Introduction ... 59
Materials and Methods ... 63
Chemicals. ... 63
Electrochemical Experiments ... 64
Flow Injection Apparatus.. ... 65
Animal Experimentation ... 65
Results and Discussion ... 67
Characterization of the Peaks in Cyclic Voltammogram for pH change. ... 67
Capacitive Contributions to the Cyclic Voltammogram for pH change. ... 70
Background-subtracted Cyclic Voltammograms due to the Adsorption of Electrochemically Inert Species. ... 72
Distortion of Cyclic Voltammograms for pH change due to Adsorption of Electrochemically Inert Species. ... 78
Distortion of Cyclic Voltammogram for pH change from DOPAC. ... 82
Verification of FSCV pH Signal with Acidosis Induced by verification of pH signal with Acidosis Induced by Hypercapnia. ... 85
Conclusions ... 88
References ... 89
Chapter 4. Carbon Microelectrode Arrays Compatible with Fast-Scan Cyclic Voltammetry. ... 94
Introduction ... 92
Materials and Methods ... 96
Chemicals and drugs ... 96
Fabrication of PPF Miroelectrode Arrays of MEA 1.0 Generation. ... 96
Data Acquisition. ... 98
Flow Injection Apparatus. ... 99
Experiments in Animals. ... 100
Results and Discussion ... 100
Design of Microfabricated Microelectrode Arrays. ... 100
Multiplexed Detection with Individually Addressable Microelectrode Arrays ... 100
Microelectrode Arrays for Multisite Recording of Dopamine Release in Anesthetized Animals ... 112
Conclusions ... 114
References ... 115
Chapter 5. Instrumentation for Fast-Scan Cyclic Voltammetry Combined with Electrophysiology for Behavioral Experiments in Freely Moving Animals. ... 119
Introduction ... 119
Design ... 121
Overview of Setup for Combined Behavioral Experiments. ... 121
Design of Potentiostat for In Vivo Voltammetry. ... 125
Design of Headstage for Combined FSCV and Electrophysiological Measurements in Freely Moving Animals ... 129
Design of the UEI Chassis. ... 134
Conclusions ... 141
Chapter 6. Evidence of Contralateral Synchronization of Transient Dopamine
Release in Nucleus Accumbens In Vivo ... 145
Introduction ... 145
Materials and Methods ... 148
Chemicals and drugs ... 148
Fast-Scan cyclic Voltammetry ... 149
Experiments in Animals. ... 149
Data Analysis. ... 150
Results and Discussion ... 153
Evidence of Connection between Dopaminergic Systems of Left and Right Hemisphere... 153
Synchronization of Endogenous Dopamine Transients between Hemispherres in Anesthetized Rats ... 155
Synchronization of Pharmacologically Induced Dopamine Transients between Hemispherres in Anesthetized Rat ... 157
Conclusions ... 161
LIST OF FIGURES
Figure Page
1.1
Schematic representation of the mainstream techniques used to measure
local brain activity.………... 4 1.2 Effect of oxidative etching on the surface of carbon electrodes………... 11
1.3
Cyclic voltammograms for pH recorded in brain and in flow
cell………... 14
1.4
Measurement of dopamine transients in nucleus accumbens of both hemispheres in anesthetized rat after pharmacological alteration wit
raclopride and cocaine…………..………... 18
2.1
Cyclic voltammograms in PBS buffer recorded at carbon fiber electrodes (A - C) and PPF electrodes (D - I)………...……… 36 2.2 XPS spectra of PPF electrode surfaces……….……….. 39
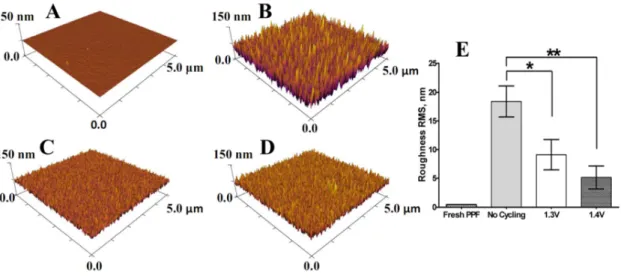
2.3
AFM images of the PPF electrode surface morphology after different
treatment conditions……… 41
2.4
Images of PPF electrodes after prolonged treatment with the extended
waveforms……….……… 43
2.5
Images of carbon fiber microelectrodes after prolonged treatment with the
extended waveform………... 45
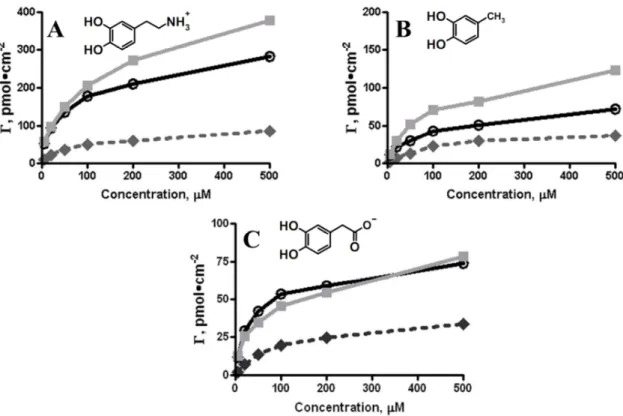
2.6
Application of the extended waveforms facilitates adsorption of catechols
with different functional groups……….. 48
2.7
Sensitivity of carbon fiber towards 500 nM dopamine fouled by
polymerization of tyramine is recovered by brief application of the extended
waveform……… 51
3.1 Background subtracted cyclic voltammograms of pH shifts……….… 69 3.2 Capacitive peak identification………...………. 72
3.3
Adsorption of electrochemically inert species at carbon-fiber
microelectrodes……….……… 77
3.4
Interference from adsorptive species to background subtracted cyclic
voltammograms for pH……..……….. 81
3.5
The effect of DOPAC adsorption on the background-subtracted pH change
carbon-fiber microelectrode………
4.1 Microfabricated array of different generations……….………... 103
4.2 Detection of dopamine in flow cell with MEA 1.0………...…………. 105
4.3 Simultaneous detection of dopamine using FSCV and amperometry…………. 108
4.4 Simultaneous detection of dopamine and oxygen………..………... 111
4.5 Simultaneous monitoring of electrically excited dopamine release in vivo……. 113
5.1 Setup for combined freely moving Echem/Ephys experiments…………..…….. 122
5.2 Block diagram for UEI potentiostats and headstage……… 124
5.3 Schematic circuitries for headstages with iontophoresis, analog background subtraction and multiple electrodes recordings………... 128
5.4 Photo of miniaturized headstage used for combined Echem/Ephys freely moving experiments adjacent to a U.S. dime……….. 132
5.5 Circuitry for headstage used for combined Echem/Ephys freely moving experiments……….. 133
5.6 Circuitry for switching control module………. 136
5.7 Circuitry for electrochemical amplifier with variable gain………..……… 138
5.8 Circuitry for neural spike amplifier………...……….. 140
6.1 Carbon-fiber microelectrodes placement for dual contralateral recordings…… 152
6.2 Contralateral stimulation induces dopamine release in nucleus accumbens…. 154 6.3 Recording of dopamine transients in nucleus accumbens core in the left and right hemispheres………..………... 156
6.4 Dopamine transients in the nucleus accumbens core in left and right hemispheres... 158
LIST OF ABBREVIATIONS AND SYMBOLS 5-HT 5-hydroxytryptamine
4MC 4-methylcatechol
Ǻ angstrom
AFM atomic force microscopy
ADC analog to digital converter
AMPH amphetamine
AP anterior-posterior
BOLD blood oxygenation level dependence
C capacitance
C concentration
C coulomb
CE capillary electrophoresis
CMOS complimentary metal-oxide semiconductor
Coc cocaine
CP caudate putamen
CV cyclic voltammogram
D diffusion coefficient
DA dopamine
DAC digital to analog converter
DAT dopamine transporter
DC direct current
DOPAC 3,4-dihydroxyphenylacetic acid
E applied potential
Echem electrochemical measurements
Ephys electrophysiological measurements
EDTA ethylenediaminetetraacetic acid
FSCV fast-scan cyclic voltammetry
fMRI functional magnetic resonance imaging
HPLC high pressure liquid chromatography
Hz hertz
i current (A)
I/E current to voltage conversion
i.p. intraperitoneal injection
kg kilogram
L distance
L left
LED light emitting diode
M molar
MFB medial forebrain bundle
mg milligram
min minutes
mL milliliter
ML medial-lateral
mm millimeter
mM millimolar
NMR nuclear magnetic resonance
µA microamperes
µm micrometer
MSN medium spiny neuron
MEA microelectrode array
METH methamphetamine
MFB medial forebrain bundle
MRI magnetic resonance imaging
MS Microsoft
nA nanoamperes
NAc nucleus accumbens
NAcc nucleus accumbens (core)
NI National Instruments
nM nanomolar
RMS root mean square
pA picoampere
PAA phenylacetic acid
PBS phosphate buffered saline
PEA β-phenylethylamine
PECVD plasma enhanced chemical vapor deposition
PEEK polyether ether ketone
PET positron emission tomography
pF picofarad
psi pounds per square inch
Q charge
R resistance
R right
Ra raclopride
RIT ritalin (methylphenidate)
s seconds
SEM scanning electron microscopy
SN substantia nigra
SO small outline
t time
SW switch
t1/2 time required for signal to decay 50%
TRIS tris(hydroxymethyl)aminomethane buffer
UV ultra violet
UEI universal electrochemical instrument
V applied potential
V volts
VTA ventral tegmental area
Chapter 1
Advancements in Probing Neurochemistry with Fast-Scan Cyclic Voltammetry.
INTRODUCTION
The human brain is a sophisticated organ that emerged as a result of several
billions of years of evolution. 1 The evolutionary advantage of its complexity is the ability of humans to adapt to various environments and even change their environment to be made more compatible for human life and these traits eventually made Homo Sapiens the dominant species.
However, the weakness of this complex system is its susceptibility to malfunctions. There are many neurological disorders that currently cannot be efficiently controlled because the causes of these diseases are not fully understood. Among them there are several widespread diseases associated with the dysfunctions of dopaminergic neurons such as Parkinson’s disease, schizophrenia and substance abuse that affect one, two and twenty two millions of people in the United States, respectively. 2 Better understanding of the dopaminergic system is needed for development of effective
therapies.
these advancements is developments in physics and chemistry that brought new technologies suitable for quantitative biological experiments. Excellent examples of this export are innovations in electronics and radar technology that facilitated discovery of electrical conductance in axons 4 and development of Falck-Hillarp histochemical fluorescent method (condensation of monoamines with formaldehyde) that was used to describe the anatomy of catecholamine-containing neurons. 5
Experiments on isolated neurons and brain slices greatly contributed to the mechanistic understanding of the separate elements of brain circuits. One of the strength of these experiments is their relative simplicity. However, neurons themselves are spatially delocalized cells and they sent their projections many centimeters away from their cell bodies and link together different brain regions. 6 This means that a focus on distinct neurons or their subdivisions might be an oversimplification that does not represent the entire brain accurately. This suggests that study of the intact brain is the best way to access its functions.
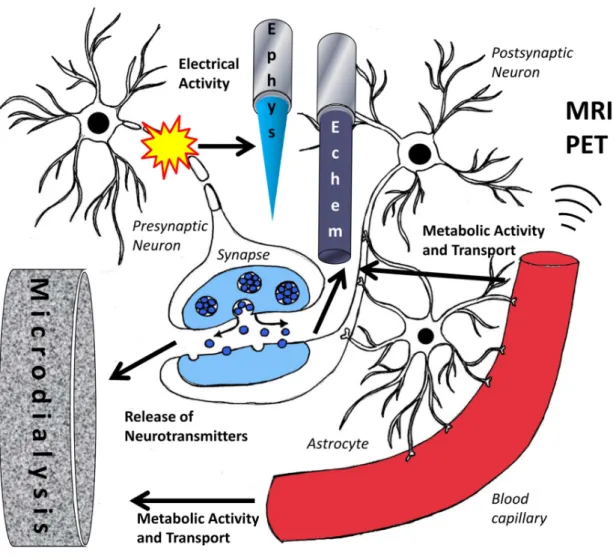
Initial attempts to study the functioning brain had limited success due to lack of knowledge about the basic elements and lack of the quantitative techniques available for neuroscientist. 3 Nowadays, there is a great variety of methods for a scientist to choose from. The mainstream techniques that are used to measure local brain activity in vivo are summarized on Figure 1.1.
simultaneously. 8 The advantage of the technique is simplicity, excellent spatial and temporal resolution and compatibility with many behavioral paradigms.
Neural activity is a very energy demanding process. To provide an adequate energy supply, an extensive network of blood vessels and capillaries exists in the brain that provides neurons with glucose and oxygen and removes carbon dioxide and the products of metabolism. 9 Local changes in neural activity cause changes in both metabolite and nutrient concentrations as well as change in the blood flow and blood oxygenation level. Several spectroscopic techniques such as magnetic resonance imaging (MRI) and positron emission tomography (PET) were developed that can trace localized changes in the blood flow or visualize transport of metabolites, glucose or specific markers. 10 This information provides assessment of local neural activity. These techniques are noninvasive so they can be routinely used in experiments with humans. Also they can sample integral activity of the entire brain and have good temporal and spatial resolution.
Figure 1.1. Schematic representation of the mainstream techniques used to measure local brain activity.
A probe with semipermeable membrane is lowered in the brain and extracellular fluid is continuously extracted with its following chemical analysis using classical analytical techniques such as HPLC or CE. 10 This technique has an excellent limit of detection and excellent chemical resolution that allows establishing identity of the activated neurons. 11 Furthermore, multiple neurotransmitters and metabolites can be sampled simultaneously.
Alternatively, neurotransmitters in the extracellular space can be detected with an electrochemically based biosensor that is placed next to the release cite. Coincidently, many of neurotransmitters and metabolites are electrochemically active and can be oxidized at moderate potential and detected electrochemically. 12 In its most successful and popular form, this technique is known as fast-scan cyclic voltammetry (FSCV) or in vivo voltammetry. In this method, consecutive triangular ramps at scan rate of 200-1000 V/sec and various potential limits are applied at frequency of 10 Hz to a carbon-fiber microelectrode. The resulting current is recorded and analyzed. Background current before the chemical events of interest is removed using either digital or analog 13 background subtraction. 14
suppliers of instruments might discourage the wide spread use of FSCV, especially by research and development divisions in commercial organizations.
FSCV is an invasive technique; however it is typically used with carbon-fiber microelectrodes. The carbon fiber itself is very small (~5 µm in diameter) and does not cause substantial damage to the brain. No gliosis or disruption of blood vessels is observed for carbon-fiber probe after histochemical evaluation of the implantation site, and this differs from the substantial damage that is usually induced by microdialysis probe. 17 Also, no gliosis was observed after a month of chronic implantation. 18
In FSCV voltammograms are collected at frequency of 10 Hz. This time resolution is sufficient to study neurotransmitter functions and observe the relation between animal behavior and neurotransmitter release. FSCV is comparable in temporal resolution to other techniques and much faster than temporal resolution of microdialysis (10 minutes). 11 One disadvantage of FSCV is background drift which limits the single differential measurement to about 100 seconds. Analog background subtraction has been employed to account for this shift and increase the recording time
to 60 minutes. 13
FSCV was developed for detection of catecholamines and the limit of detection for dopamine has been lowered to the subnanomolar range. 19 However, the number of molecules that can be detected with FSCV in vivo is growing. Detection of norepinephrine 20, 5-hydroxytryptamine 21, pH 22, 23, oxygen 22 and adenosine 24 in the brain were reported in literature in recent years. Unfortunately, electrochemically inert neurotransmitters and metabolites are still out of reach for FSCV. However it is possible to measure glucose and glutamate through auxiliary enzymatic reaction with further
There are many electrochemically active species in the brain extracellular fluid and it is tricky to have god selectivity for with FSCV. However, during several decades of development and improvement of the technique, principles for selectivity for in vivo biosensors were established. 26 According to these guidelines, five criteria including the electrochemical identity (voltammogram), anatomical and physiological verification, pharmacological verification and independent chemical identification need to be satisfied to establish identity of the voltammetric signal in vivo.
DYNAMIC STATE OF CARBON SURFACE AND REGENERATION OF ADSORPTION SITES
High sensitivity and low limit of detection for fast-scan cyclic voltammetry are achieved by adsorption and preconcentration of catecholamines at the electrode surface. 27, 28 Apparently, the adsorption of catecholamines on carbon is very specific for catechols and aromatic species in comparison to gold where interferants such as proteins adsorb as well. 29 The chemical structure of the adsorption sites on carbon is unknown. Part of the problem is the multitude of surface active groups that exist on the surface and also the variety in carbon materials that used for the fabrication of the electrodes as well as variation in the pretreatment procedures for the electrode surfaces.
30, 31
An additional challenge is the small size of carbon-fiber microelectrodes which severely limits number of techniques that can be used for surface analysis. Furthermore, during FSCV experiment voltage ramps are continuously applied to the electrode and, as was shown earlier, the higher potential limits led to an increase in dopamine adsorption, 32, 33 which means that the electrochemical experiment itself in certain cases affects the surface integrity and changes the composition of the surface active groups. With this being said, standard procedure of surface analysis such as turning off the potential ramps and taking an electrode from the solution to the high vacuum chamber of XPS instrument are unlikely to provide adequate representation of dynamic composition of carbon surface during electrochemical experiment.
In this work, the effect of different voltage ramps on the surface chemistry of carbon-fiber microelectrodes was investigated with a variety of techniques such as XPS,
It was discovered that the application of extended potential ramps (up to 1.3 V and 1.4 V), which are traditionally used for FSCV experiments in freely moving animals, led to oxidative etching of the carbon surface. Complete etching and disappearance of carbon-fiber microelectrodes were observed after prolonged (days and weeks) cycling of microelectrodes with the extended waveforms. This observation suggests that adsorption sites on the carbon surface are continuously created and destroyed (regenerated) and the chemical composition of the carbon surface in FSCV experiments with the extended waveform is a result of dynamic equilibrium. This discovery brings new insights into carbon surface chemistry and its dynamic nature and provides routes to explore for improvement in electrochemical sensing.
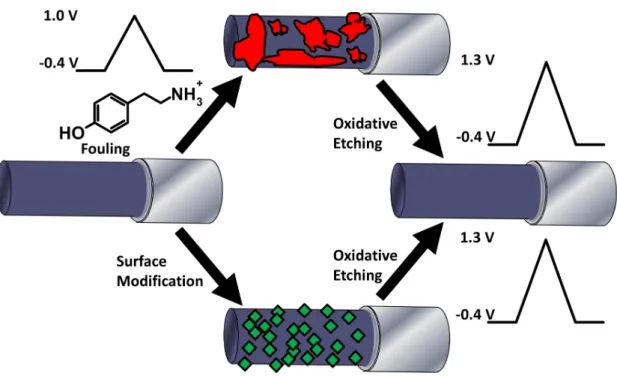
Oxidative electrochemical etching associated with application of the extended waveform prevents electrode fouling by irreversibly adsorbed species. It was confirmed by purposeful fouling of carbon-fiber microelectrode with products of electrochemical oxidation of tyramine, which tend to form polymer that adsorbs on the electrode surface.
35
Complete recovery of electrode sensitivity was achieved after use of the extended waveform. The concept of renewable surface of electrode surface provides an excellent way to prevent chemical fouling. However, resurfacing of carbon electrodes also means that modification of carbon surface is not very useful with the extended waveform. Covalently attached molecules on carbon electrodes are expected to etch away during
electrochemical oxidation of the surface (Figure 1.2).
Figure 1.2. Effect of oxidative etching on the surface of carbon electrodes.
MEASUREMENT OF PH IN BRAIN IN VIVO AND INTERFERENCE FROM ADSORPTION
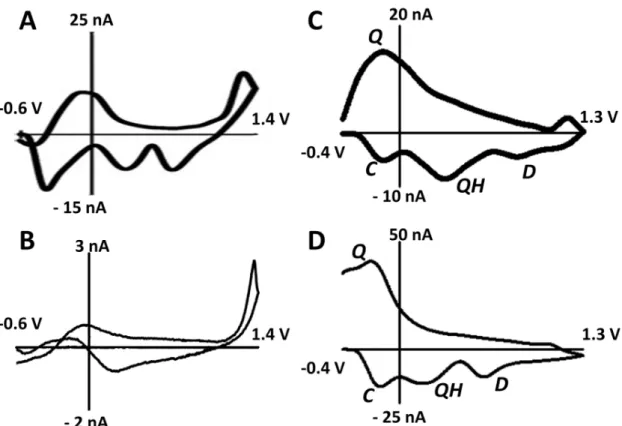
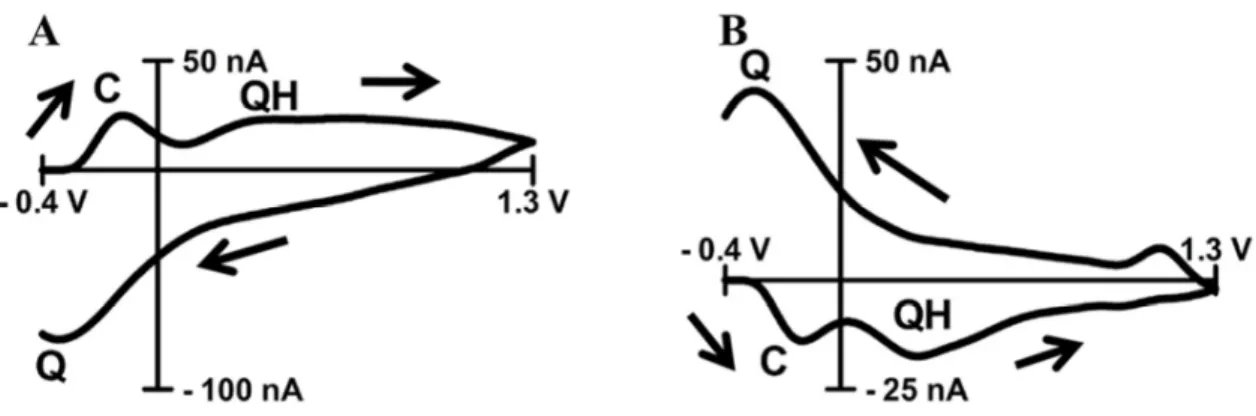
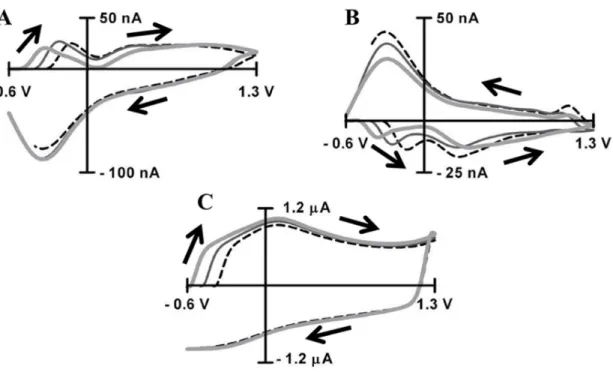
Some chemical groups on the surface of carbon-fiber microelectrodes participate in electrochemical reactions that involve protons. 40 Thus in FSCV experiment change in solution pH leads to shift in the electrode background current and characteristic cyclic voltammogram for pH can be obtained after background subtraction. This pH effect was initially considered as interference for dopamine detection. 41 Though, later it was adopted for detection of fast pH changes in the brain. 22 However, the cyclic voltammograms recorded in brain in vivo did not accurately match the cyclic voltammograms recorded in the flow cell (Figure 1.3, A and B).
Carbon surface is rich in surface active groups that form adsorption site for many chemical species. 30, 31 Also, to facilitate preconcentration of dopamine, which is positively charged at physiological pH of 7.4, carbon-fiber microelectrode is held at potential of -0.4 V. Obviously, any other molecules and ions, especially aromatic and positively charged with affinity to carbon surface, adsorb at the electrode as well. Even if these species are not electrochemically active themselves, they interfere with the electrochemical detection of adsorptive analytes. They compete with dopamine for adsorption sites on the surface. 42 Furthermore, they disturb double layer and alter its capacitance. 37 FSCV is a background subtraction technique; hence electrochemically inert species that adsorb to the electrode surface produce distinct voltammograms related to the alteration of the double layer capacitance. 23
Figure 1.3. Cyclic voltammograms for pH recorded in brain and in flow cell.
MICROELECTRODE ARRAYS FOR VOLTAMMETRIC MEASUREMENTS IN BRAIN IN VIVO
FSCV with carbon fiber microelectrodes provides excellent spatial resolution due to small diameter of carbon fibers (5 µm). However, the volume of the brain that is sampled with single carbon fiber is also very small. Average diffusion distance for dopamine in the brain is around 6 µm, 45 thus only dopamine in a volume of 20000 µm3 is detected. Average concentration of dopaminergic synapses is 0.1 µm-3, 46 thus there are only 2000 synapses that are sampled with a carbon-fiber microelectrode. However, there are roughly 22000 dopaminergic cells in nigrostriatal and mesolimbic dopamine systems 47 in each of two hemispheres and every dopamine neuron makes thousands of synaptic connections. 48 It means that just 0.005% of dopaminergic system is sampled with a single carbon-fiber microelectrode! What happens with the rest 99.995% of dopaminergic neurons during freely moving voltammetry experiments, when animals
perform behavioral tasks is not known very well.
There are many other neurotransmitters and metabolites besides dopamine that can be detected with FSCV and monitoring of their concentration could bring new insights in understanding of brain functions. However, each of these analytes has distinct electrochemical properties. Thus they can be detected with best sensitivity and selectivity only under certain electrochemical conditions with certain electrode modification and with a waveform that tailored for the specific neurotransmitter. For instance, detection of 5-hydroxytryptamine with FSCV requires coating of microelectrode with Nafion (to prevent fouling by 5-hydroxiacetic acid) and non-triangular waveform with
The challenges described above provide excellent opportunities for improvement of in vivo voltammetry. Microelectrode arrays (MEAs) compatible with FSCV would be an exceptionally powerful tool for sampling concentration of neurotransmitters in spatially different locations as well as for sampling different neurotransmitters simultaneously.
Microelectrode arrays have been used to measure neural electrophysiological activity for more than four decades, 8, 49 and it was adapted for electrochemical measurements much later, after advantages of microelectrodes were realized. 50, 51 However, implementation of MEAs compatible with FSCV has not happened until invention of pyrolyzed photoresist film (PPF) 34, 52 which provided a convenient route for microfabrication of MEAs and development of instrumentation that allowed independent control of the electrodes in the array. 16
Figure 1.4. Measurement of dopamine transients in nucleus accumbens of both hemispheres in anesthetized rat after pharmacological alteration with raclopride and cocaine.
DISSERTATION OUTLINE
REFERENCES
1. Lorenz, K., Behind the mirror: a search for a natural history of human knowledge. Harcourt Brace Jovanovich: 1978.
2. Brain facts: a primer on the brain and nervous system. Society for Neuroscience:
2008.
3. Kandel, E. R., In search of memory: the emergence of a new science of mind. W.W. Norton & Co.: 2007.
4. Hodgkin, A., Chance and design: reminiscences of science in peace and war. Cambridge University Press: 1994.
5. Iversen, L. L.; Iversen, S.; Dunnett, S.; Bjorklund, A., Dopamine Handbook. Oxford University Press: 2009.
6. Kandel, E. R.; Schwartz, J. H.; Jessell, T. M., Principles of neural science. McGraw-Hill, Health Professions Division: 2000.
7. Humphrey, D. R.; Schmidt, E. M., Extracellular single-unit recording methods. Humana Press: Clifton, N.J., 1991; Vol. 15.
8. Nicolelis, M. A. L., Methods for neural ensemble recordings. 2nd ed.; CRC Press: Boca Raton, 2008.
9. Kaila, K.; Ransom, B. R., pH and brain function. Wiley-Liss: New York, 1998; p xiii, 688 p.
10. Carter, M.; Shieh, J. C., Guide to Research Techniques in Neuroscience. Academic Press: 2009.
11. Watson, C. J.; Venton, B. J.; Kennedy, R. T., In Vivo Measurements of Neurotransmitters by Microdialysis Sampling. Analytical Chemistry 2006, 78, (5), 1391-1399.
12. Robinson, D. L.; Hermans, A.; Seipel, A. T.; Wightman, R. M., Monitoring Rapid Chemical Communication in the Brain. Chemical Reviews 2008, 108, (7), 2554-2584.
13. Hermans, A.; Keithley, R. B.; Kita, J. M.; Sombers, L. A.; Wightman, R. M., Dopamine detection with fast-scan cyclic voltammetry used with analog background subtraction. Analytical Chemistry 2008, 80, (11), 4040-4048.
14. Michael, A. C.; Borland, L. M., Electrochemical methods for neuroscience. CRC Press/Taylor & Francis: 2007.
transmission of fast-scan cyclic voltammetry at a carbon-fiber microelectrode: proof of principle. Journal of Neuroscience Methods 2004, 140, (1-2), 103-115. 16. Takmakov, P.; McKinney, C. J.; Carelli, R. M.; Wightman, R. M., Instrumentation
for Fast-Scan Cyclic Voltammetry Combined with Electrophysiology for Behavioral Experiments in Freely Moving Animals. Review of Scientific Instruments 2011, submitted.
17. Jaquins-Gerstl, A.; Michael, A. C., Comparison of the brain penetration injury associated with microdialysis and voltammetry. Journal of Neuroscience Methods 2009, 183, (2), 127-135.
18. Clark, J. J.; Sandberg, S. G.; Wanat, M. J.; Gan, J. O.; Horne, E. A.; Hart, A. S.; Akers, C. A.; Parker, J. G.; Willuhn, I.; Martinez, V.; Evans, S. B.; Stella, N.; Phillips, P. E. M., Chronic microsensors for longitudinal, subsecond dopamine detection in behaving animals. Nat Meth 2009, 7, (2), 126-129.
19. Keithley, R. B. T., P; Bucher, E S; Belle, A M, Owesson-White C A; Park, J; Wightman, R M, Improving In Vivo Dopamine Sensitivity with Faster-Scan Cyclic Voltammetry. Analytical Chemistry 2011, submitted.
20. Park, J.; Kile, B. M.; Wightman, R. M., In vivo voltammetric monitoring of norepinephrine release in the rat ventral bed nucleus of the stria terminalis and anteroventral thalamic nucleus. European Journal of Neuroscience 2009, 30, (11), 2121-2133.
21. Hashemi, P.; Dankoski, E. C.; Petrovic, J.; Keithley, R. B.; Wightman, R. M., Voltammetric Detection of 5-Hydroxytryptamine Release in the Rat Brain. Analytical Chemistry 2009, 81, (22), 9462-9471.
22. Venton, B. J.; Michael, D. J.; Wightman, R. M., Correlation of local changes in extracellular oxygen and pH that accompany dopaminergic terminal activity in the rat caudate-putamen. Journal of Neurochemistry 2003, 84, (2), 373-381.
23. Takmakov, P.; Zachek, M. K.; Keithley, R. B.; Bucher, E. S.; McCarty, G. S.; Wightman, R. M., Characterization of Local pH Changes in Brain Using Fast-Scan Cyclic Voltammetry with Carbon Microelectrodes. Analytical Chemistry 2010, 82, (23), 9892-9900.
24. Swamy, B. E. K.; Venton, B. J., Subsecond detection of physiological adenosine concentrations using fast-scan cyclic voltammetry. Analytical Chemistry 2007, 79, (2), 744-750.
25. Sanford, A. L.; Morton, S. W.; Whitehouse, K. L.; Oara, H. M.; Lugo-Morales, L. Z.; Roberts, J. G.; Sombers, L. A., Voltammetric Detection of Hydrogen Peroxide at Carbon Fiber Microelectrodes. Analytical Chemistry 2010, 82, (12), 5205-5210.
27. Baur, J. E.; Kristensen, E. W.; May, L. J.; Wiedemann, D. J.; Wightman, R. M., Fast-Scan Voltammetry of Biogenic-Amines. Analytical Chemistry 1988, 60, (13), 1268-1272.
28. Bath, B. D.; Michael, D. J.; Trafton, B. J.; Joseph, J. D.; Runnels, P. L.; Wightman, R. M., Subsecond adsorption and desorption of dopamine at carbon-fiber microelectrodes. Analytical Chemistry 2000, 72, (24), 5994-6002.
29. Zachek, M. K.; Hermans, A.; Wightman, R. M.; McCarty, G. S., Electrochemical dopamine detection: Comparing gold and carbon fiber microelectrodes using background subtracted fast scan cyclic voltammetry. Journal of Electroanalytical Chemistry 2008, 614, (1-2), 113-120.
30. McCreery, R. L., Carbon electrodes: structural effects on electron transfer kinetics. Marcel-Dekker: New York, 1991; Vol. 17, p 221-373.
31. McCreery, R. L., Advanced carbon electrode materials for molecular electrochemistry. Chemical Reviews 2008, 108, (7), 2646-2687.
32. Hafizi, S.; Kruk, Z. L.; Stamford, J. A., Fast Cyclic Voltammetry - Improved Sensitivity to Dopamine with Extended Oxidation Scan Limits. Journal of Neuroscience Methods 1990, 33, (1), 41-49.
33. Heien, M. L. A. V.; Phillips, P. E. M.; Stuber, G. D.; Seipel, A. T.; Wightman, R. M., Overoxidation of carbon-fiber microelectrodes enhances dopamine adsorption and increases sensitivity. Analyst 2003, 128, (12), 1413-1419.
34. Zachek, M. K.; Takmakov, P.; Moody, B.; Wightman, R. M.; McCarty, G. S., Simultaneous Decoupled Detection of Dopamine and Oxygen Using Pyrolyzed Carbon Microarrays and Fast-Scan Cyclic Voltammetry. Analytical Chemistry 2009, 81, (15), 6258-6265.
35. de Castro, C. M.; Vieira, S. N.; Goncalves, R. A.; Brito-Madurro, A. G.; Madurro, J. M., Electrochemical and morphologic studies of nickel incorporation on graphite electrodes modified with polytyramine. Journal of Materials Science 2008, 43, (2), 475-482.
36. Takmakov, P.; Zachek, M. K.; Keithley, R. B.; Walsh, P. L.; Donley, C.; McCarty, G. S.; Wightman, R. M., Carbon Microelectrodes with a Renewable Surface. Analytical Chemistry 2010, 82, (5), 2020-2028.
37. Bard, A. J.; Faulkner, L. R., Electrochemical Methods. Wiley New York: 2001. 38. Garris, P. A.; Collins, L. B.; Jones, S. R.; Wightman, R. M., Evoked Extracellular
Dopamine in-Vivo in the Medial Prefrontal Cortex. Journal of Neurochemistry 1993, 61, (2), 637-647.
40. Kawagoe, K. T.; Garris, P. A.; Wightman, R. M., pH-Dependent Processes at Nafion(R)-Coated Carbon-Fiber Microelectrodes. Journal of Electroanalytical Chemistry 1993, 359, (1-2), 193-207.
41. Runnels, P. L.; Joseph, J. D.; Logman, M. J.; Wightman, R. M., Effect of pH and surface functionalities on the cyclic voltammetric responses of carbon-fiber microelectrodes. Analytical Chemistry 1999, 71, (14), 2782-2789.
42. Chen, B. T.; Rice, M. E., Calibration factors for cationic and anionic neurochemicals at carbon-fiber microelectrodes are oppositely affected by the presence of Ca2+ and Mg2+. Electroanalysis 1999, 11, (5), 344-348.
43. Shou, M. S.; Ferrario, C. R.; Schultz, K. N.; Robinson, T. E.; Kennedy, R. T., Monitoring dopamine in vivo by microdialysis sampling and on-line CE-laser-induced fluorescence. Analytical Chemistry 2006, 78, (19), 6717-6725.
44. Roitman, M. F.; Stuber, G. D.; Phillips, P. E. M.; Wightman, R. M.; Carelli, R. M., Dopamine operates as a subsecond modulator of food seeking. Journal of Neuroscience 2004, 24, (6), 1265-1271.
45. Venton, B. J.; Zhang, H.; Garris, P. A.; Phillips, P. E. M.; Sulzer, D.; Wightman, R. M., Real-time decoding of dopamine concentration changes in the caudate-putamen during tonic and phasic firing. Journal of Neurochemistry 2003, 87, (5), 1284-1295.
46. Doucet, G.; Descarries, L.; Garcia, S., Quantification of the Dopamine Innervation in Adult-Rat Neostriatum. Neuroscience 1986, 19, (2), 427-&.
47. German, D. C.; Manaye, K. F., Midbrain Dopaminergic-Neurons (Nuclei A8, A9, and A10) - 3-Dimensional Reconstruction in the Rat. Journal of Comparative Neurology 1993, 331, (3), 297-309.
48. Anden, N. E.; Fuxe, K.; Hamberge.B; Hokfelt, T., A Quantitative Study on Nigro-Neostriatal Dopamine Neuron System in Rat. Acta Physiologica Scandinavica 1966, 67, (3-4), 306-&.
49. Hanna, G. R.; Johnson, R. N., A Rapid and Simple Method for Fabrication of Arrays of Recording Electrodes. Electroencephalography and Clinical Neurophysiology 1968, 25, (3), 284-&.
50. Wightman, R. M., Microvoltammetric Electrodes. Analytical Chemistry 1981, 53, (9), 1125-&.
51. Compton, R. G.; Banks, C. E., Understanding voltammetry. World scientific publishing: Singapore, 2007; p 371 p.
53. Zachek, M. K.; Park, J.; Takmakov, P.; Wightman, R. M.; McCarty, G. S., Microfabricated FSCV-compatible microelectrode array for real-time monitoring of heterogeneous dopamine release. Analyst 2010, 135, (7), 1556-1563.
54. Zachek, M. K.; Takmakov, P.; Park, J.; Wightman, R. M.; McCarty, G. S., Simultaneous monitoring of dopamine concentration at spatially different brain locations in vivo. Biosensors & Bioelectronics 2010, 25, (5), 1179-1185.
55. Venton, B. J.; Wightman, R. M., Pharmacologically induced, subsecond dopamine transients in the caudate–putamen of the anesthetized rat. Synapse 2007, 61, (1), 37-39.
56. Park, J.; Aragona, B. J.; Kile, B. M.; Carelli, R. M.; Wightman, R. M., In Vivo Voltammetric Monitoring of Catecholamine Release in Subterritories of the Nucleus Accumbens Shell. Neuroscience 2010, 169, (1), 132-142.
57. Pritzel, M.; Sarter, M.; Morgan, S.; Huston, J. P., Interhemispheric nigrostriatal projections in the rat: Bifurcating nigral projections and loci of crossing in the diencephalon. Brain Research Bulletin 1983, 10, (3), 385-390.
58. Shi, W.-X., Slow Oscillatory Firing: A Major Firing Pattern of Dopamine Neurons in the Ventral Tegmental Area. Journal of Neurophysiology 2005, 94, (5), 3516-3522.
Chapter 2
Carbon Microelectrodes with a Renewable Surface. INTRODUCTION
Carbon electrodes have several beneficial properties including a wide positive potential window, simplicity of surface modifications, and low cost. 1, 2 These benefits have allowed applications of carbon electrodes in energy sources 3 and electroanalytical detection. 4 Recent progress in the development of nanostructured carbon for electrochemical sensors 5 and introduction of carbon based electronics 6 additionally highlight the important role of this material for a variety of future applications in both fundamental research and industrial processes.
Different treatments have been employed to increase adsorption and electron-transfer kinetics at carbon electrodes because these factors influence sensitivity, selectivity and response time. Physical treatments include traditional electrode polishing (glassy carbon), 2 vacuum heat treatment (glassy carbon), 12 laser activation of electrode surfaces (glassy carbon) 13 and flame etching (carbon fibers). 14 All produce changes in the structure of carbon surfaces that lead to the desired electrochemical response. Despite the success of these physical pretreatments for achieving particular electrode properties, these approaches have several disadvantages. First, it is difficult to predict electrode performance when comparing different pretreatment methodologies on different forms of carbon. McCreery and coworkers have developed a relationship between carbon electrode surface structure and electron-transfer kinetics, 15 however this paradigm does not consider adsorption that plays an important role for the many electroactive analytes including catechols. 16, 17 A second limitation is that these surfaces cannot be renewed once implanted within a biological system. This is particularly important for in vivo voltammetry since it is difficult to repeat the sensitivity enhancing treatment step during the biological experiment. Thus, the reported procedures have limited applicability for in vivo work particularly for experiments with freely moving animals.
Another pretreatment approach that has proven to be useful is electrochemical
carbon-fiber microelectrodes with a potential limit of 1.4 V vs Ag/AgCl has been shown to increase adsorption when compared to the use of potential limit of 1.0 V while maintaining current stability both in vitro and in vivo. 23, 24 Increased adsorption enhances sensitivity but, at the same time, the background amplitude is also increased. This treatment differs from others in that the waveform is continually applied during the analytical measurement. However, the mechanisms behind this enhancement with extended voltage scans are unknown.
The small size of carbon-fiber microelectrodes limits the surface analysis techniques that can be used to investigate chemical changes on the carbon surface. In this work we have used pyrolyzed photoresist film (PPF) carbon electrodes to investigate the underlying changes that arise with increased positive limits during repetitive scans. PPF films have similar electrochemical properties as carbon-fiber microelectrodes but can be patterned into a variety of shapes using microfabrication techniques. 25-28 These carbon surfaces were probed with X-ray photoelectron spectroscopy (XPS) and atomic force microscopy (AFM). Our findings indicate that the surface of these electrodes is constantly renewed by using periodic application of waveforms with an extended anodic potential.
MATERIALS AND METHODS
Chemicals.
All chemicals were obtained from Sigma-Aldrich (St. Louis, MO, USA) unless otherwise noted and used as received. Solutions were prepared using doubly distilled water. Electrochemical experiments were done in PBS buffer (140 mM NaCl, 3 mM KCl, 10 mM NaH2PO4, pH = 7.4). Stock solutions of catechols were prepared in 0.1 N HClO4
Fabrication of Carbon Fiber Microelectrodes.
Cylindrical microelectrodes were constructed using a T-650 carbon fiber (Thornel, Amoco Corp., Greenville, SC, USA) as previously described. 29 Briefly, individual carbon fibers were aspirated into glass capillaries (A-M Systems, Carlsborg, WA, USA) using vacuum. Afterwards, the capillaries were pulled and sealed with a micropipette puller (Narishige, Tokyo, Japan). The quality of the pulled capillaries was examined with an optical microscope. The carbon fibers were cut to an exposed length of 100 µm. Before electrochemical experiments, electrodes were soaked in isopropanol purified with Norit A activated carbon (ICN, Costa Mesa, CA, USA) for at least 20 min to remove surface impurities. 17 Electrical connection to the carbon fiber was made with
electrolyte (4 M CH3COOK and 0.15 M KCl), and a stainless steel wire.
Fabrication of PPF Electrodes.
Two types of PPF microelectrodes that differed in their insulation were fabricated. SU-8 insulated PPF electrodes were used for studies of background current change with electrochemical treatment and silicon nitride insulated PPF electrodes were used for XPS and AFM studies. The PPF microelectrodes were fabricated as described previously. 28 Briefly, photoresist (AZ1518, AZ Electric Materials, Branchburg, NJ, USA) was spun on a 3” fused silica wafer and patterned using standard photolithographic techniques. The patterned wafer was subsequently pyrolyzed at 1000 °C under a forming gas atmosphere (5% H2, 95% N2). A microprocessor controlled tube furnace
(Sentro Tech, Inc., Berea, OH, USA) was used to ramp the temperature at 5 °C/min and it was held at 1000 °C for one hour. Samples were allowed to cool to room temperature under the forming gas atmosphere prior to exposure to air.
deposition (PECVD) was used to insulate the PPF microelectrodes. The Si3N4 films
were deposited using an Advanced Vacuum Vision 310 PECVD System (Lomma, Sweden). Monosilane (2% SiH4/N2) and ammonia (NH3) gases were used at
electronically mass controlled flow rates. The films were deposited at a rate of 7.5 nm/min to a final thickness of 500 nm. The exposed microelectrode area was photolithographically defined, and subsequently etched using reactive ion etching (Semi Group Inc, USA) under a fluoroform (CHF3) and oxygen atmosphere. The pyrolyzed
carbon served as a sufficient etch stop for this process. All deposition and etch rates were determined using a Tencor, P-6 profilometer (KLA-Tencor Inc, Milpitas, CA, USA). To obtain non-roughened and non-fluorinated samples, PPF microelectrodes were insulated with SU-8 3010, as previously reported. 28 External connections to the PPF were made using silver epoxy (MG Chemicals, Burlington, Ontario, Canada) and stainless steel wires. The device was cut with a dicing saw into its final form that had four PPF electrodes, each of which was 75 µm by 100 µm. Electrodes with such areas are compatible with small spot XPS measurements with a 27 µm diameter.
Electrochemical Experiments.
Cyclic voltammograms were acquired with an EI-400 potentiostat used in two electrode mode and TH-1 software (ESA Inc, Chemsfold, MA, USA) written in LabVIEW (National Instruments, Austin, TX, USA). The waveform was generated and the voltammetric signal was acquired with an ADC/DAC card PCI-6251 (National Instruments). A PCI-6711 DAC board (National Instruments) was used to synchronize waveform application, data acquisition and TTL pulses for the flow injection valve. The output waveform was filtered with a low pass 2 kHz filter to eliminate digitization steps.
back to - 0.4 V at a scan rate of 300 Vs-1 repeated at 10 Hz with a rest potential of - 0.4 V between scans. A second waveform (referred to as the 1.3 V waveform) was a ramp from - 0.4 V to 1.3 V and back to - 0.4 V at scan rate of 400 Vs-1 repeated at 60 Hz, also with a rest potential of - 0.4 V between scans. The third waveform (referred to as the 1.4 V waveform) was a ramp from - 0.6 to 1.4 V and back to -0.6 V at scan rate of 400 Vs-1 repeated at 60 Hz with a rest potential of - 0.6 V between scans. The latter two extended waveforms were applied at a frequency of 60 Hz to intensify any oxidative etching effects and to reduce the duration of the electrochemical experiments. In each experiment background current was allowed to stabilize for 15 minutes. 24
Evaluation of the adsorption of catechols employed the same waveforms but with a repetition frequency of 1 Hz. The charge was obtained by integrating the oxidation peak of the cyclic voltammogram as previously described. 17 The area of the electrode was calculated from microelectrode dimensions measured with an optical microscope. To account for contributions from diffusion, cyclic voltammograms were simulated with DigiSim software (Bioanalytical Systems Inc, West Lafayette, IN, USA) using kinetic parameters and diffusion coefficients reported before. 30, 31 The amount of adsorbed analyte was obtained by subtracting the computed diffusional component from the measured charge and converting it to the number of moles using Faraday’s law.
3 minutes apart (10 Hz application frequency). The recovery of electrode sensitivity was evaluated by cycling the electrode with the 1.3 V waveform in PBS buffer for 15 minutes at 60 Hz followed by testing with 500 nM dopamine in the flow-injection system with the 1.0 waveform for 10 consecutive injections 3 minutes apart (10 Hz application frequency). The responses for the 10 consecutive injections for each condition were averaged and normalized to the pre-tyramine injections.
All potentials are reported versus a Ag/AgCl reference electrode. Electrochemical measurements were performed in a grounded Faraday cage.
Flow Injection Apparatus.
The flow injection analysis system consisted of a syringe pump (Harvard Apparatus, Holliston, MA) that directed buffer solution through a Teflon tube to a 6-port injection valve (Rheodyne, Rohnert Park, CA, USA) at rate of 0.5 mL per minute. The injection valve was controlled by a 12 V DC solenoid and was used to introduce analyte from an injection loop (volume of 0.7 mL) into an electrochemical cell. The carbon-fiber microelectrode was placed inside the opening of the Teflon tube to eliminate the diffusion broadening and a reference electrode was placed within ~ 20 mm of the working electrode. 32
Electrochemical Modification of PPF Electrodes.
Electrochemical experiments involving PPF microelectrodes were accomplished using a drop of buffer placed on top of the microelectrodes and a reference electrode
was lowered into the buffer. The three different waveforms were applied to separate electrodes for 30 minutes. Electrodes were rinsed with water, dried in air and the surface
was analyzed with XPS and AFM.
Drops of saturated NiI2 solution were deposited onto the four corners surrounding
each of the electrodes using a pressure ejection to help locate the PPF microelectrode during XPS analysis. Glass capillaries with a 0.68 mm inner diameter (AM Systems, Sequim, WA, USA) were pulled on a Sachs-Flaming Micropipette Puller Model PC-84 (Sutter Instruments, Novato, CA, USA) and bumped to a final inner diameter of 10-15 µm at the tip. Approximately 20 – 30 µm diameter droplets were then deposited onto the substrate under an inverted microscope Nikon Eclipse TE 300 (Nikon, Lewisville, TX, USA) at 5-10 psi for 10-100 ms using a Picospritzer (Parker Instruments, Pine Brook, NJ, USA). The solution was then allowed to evaporate for approximately 15 minutes in a 100 ºC oven.
To investigate the chemical composition of the native PPF surface, a separate sample was prepared. A cooled wafer with a carbon film was transferred from the furnace to the XPS instrument in a desiccator under N2 to minimize oxidation by
atmospheric oxygen and to record the XPS spectra of a freshly prepared PPF surface. No subsequent insulation steps were done for this sample.
XPS analysis was performed with a Kratos Axis Ultra DLD X-ray Photoelectron Spectrometer (Kratos Analytical Inc, Chestnut Ridge, NY, USA) using a monochromatic Al Kα x-ray source. The surface was mapped for the Si 2p and Ni 2p3/2 lines to spatially
locate the electrode. Spectra were taken from the center of the electrode with a sampling area with diameter of 27 µm.
AFM Imaging.
sampling spots were randomly chosen from different locations of the PPF electrode to ensure representative sampling and averaging. The roughness for each sample was calculated for several 1 µm by 1 µm spots in Igor Pro 6.1 (WaveMetrics Inc, Lake Oswego, OR, USA). AFM data were plotted using ARgyle Light software (Asylum Research, Santa Barbara, CA, USA).
Scanning Electron Microscopy.
Carbon-fiber microelectrodes were imaged before and after electrochemical treatment with an FEI Quanta 200 FEG environmental scanning electron microscope (FEI Company, Hillsboro, OR, USA).
Optical Microscopy.
Etched PPF microelectrodes were imaged with Nikon Eclipse TE 300 inverted microscope (Nikon, Lewisville, TX, USA). Pictures were taken with Nikon digital camera. Etched carbon-fiber microelectrodes were photographed with an IR-1000 infrared CCD monochrome video camera (DAGE-MTI, Michigan City, IN) fixed to a Nikon FN-S2N upright microscope and collected with Video Advantage ® ADX PCI card and software (Turtle Beach, Elmsford, NY). Images were processed using Adobe Photoshop (Adobe Systems, Inc, San Jose, CA, USA).
Data Analysis.
Statistical analysis of the data and generation of the plots were done using MS Excel and GraphPad Prism. All numbers are reported as averages ± standard deviation.
RESULTS AND DISCUSSION
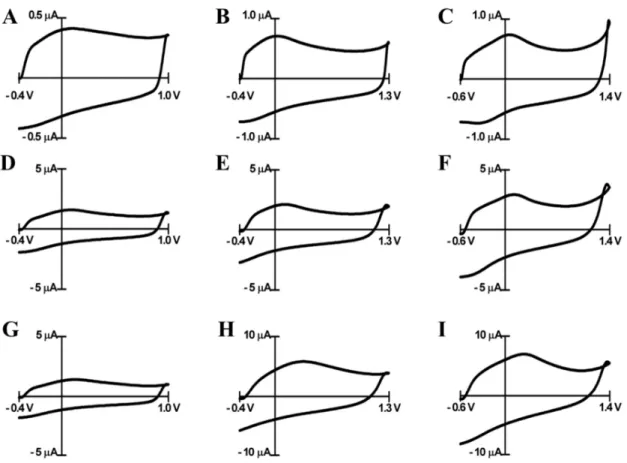
Effect of Applied Potential on Background Current of Carbon Microelectrodes. Due to its small size and geometry, the surface chemistry of the carbon-fiber microelectrode is difficult to study with modern surface-analysis techniques. To circumvent this problem, we used PPF electrodes that are more amenable to AFM and XPS analysis. PPF has been shown to be structurally similar to glassy carbon. 26 Like carbon-fiber microelectrodes, PPF was previously reported to have similar increases in sensitivity towards dopamine when extended waveforms were used with FSCV. 28 The area of the PPF electrodes in this work was 7500 µm2 which is 7-8 times larger than the area of a 100 µm long cylindrical carbon-fiber microelectrode (~ 1000 µm2). This area was selected as a compromise so that iR drop was only slightly greater than that of carbon-fiber microelectrodes but so that there was sufficient area for surface analysis.
Figure 2.1. Cyclic voltammograms in PBS buffer recorded at carbon fiber electrodes (A-C) and PPF electrodes (D - I).
As the potential limit is made more positive, the current at the most positive potential shows a slight increase at both PPF and carbon-fiber electrodes. This feature has been previously assumed to arise from oxidation of carbon at these positive potentials. 24 Such a process could increase the amount of oxides on the carbon surface and could cause a loss of electrode mass as is found when passing current through bundles of carbon fibers to generate carbon dioxide. 37 Indeed, overoxidation of highly ordered pyrolyzed graphite (HOPG) induces the formation of blisters on the surface of HOPG presumably due to evolution of carbon dioxide. 38 Besides formation of CO2,
oxidation of carbon surfaces has been shown to cause exfoliation of carbon either as graphite oxide as was suggested to occur during the blistering of HOPG 38 or as carbon particles or nanocrystals. 39-41 These observations imply that scanning to the higher potentials might change the surface of carbon electrode. Surface analysis techniques were used to establish the occurrence of these processes on the carbon surface with the
electrochemical treatment.
Characterization of Surface Effects of Potential Cycling on PPF Electrodes. XPS was used to sample the elemental composition of PPF electrode surfaces. For a sample prepared without insulation and stored in a desiccator to prevent oxidation by atmospheric oxygen, XPS showed approximately 5% surface oxygen (Figure 2.2A), a
value similar to that previously reported. 26, 27 Subsequent deposition of the Si3N4
maximum applied potential (summarized in Figure 2.2E). In contrast, potential scans to 1.0 V do not result in the removal of the fluorine marker (data not shown). These results indicate that the fluorine introduced on the surface during the Si3N4 etching is removed
Figure 2.2. XPS spectra of PPF electrode surfaces.
F 1s, O 1s and C 1s indicate characteristic peaks for fluorine, oxygen and carbon, respectively. (A) PPF electrode before any treatment. (B) PPF electrode after coating with silicon nitride, removal of insulation by etching with CHF3/O2 and subsequent
Physical Changes Caused by Electrochemical Potential Limits.
The roughness of the PPF electrodes used in this work was established with AFM. The roughness of a freshly prepared PPF surface was comparable to the roughness of the fused silica substrate (Figure 2.3A) with a RMS roughness of 0.45 ± 0.03 nm vs 0.94 ± 0.06 nm for the fused silica substrate (data not shown). However, when the PPF was coated with silicon nitride, and the insulator was subsequently etched and removed with a fluoroform/oxygen plasma, the resulting PPF surface showed a considerable increase in roughness (RMS 18 ± 5 nm, Figure 2.3B). The formation of
rough features on the carbon surface was caused by the fluoroform/oxygen plasma used for Si3N4 removal that has been reported to slowly etch carbon.
42
Surface roughness was also evaluated after electrochemical scanning. Application of the 1.3 V waveform at 60 Hz for 30 min caused a decrease in the surface roughness (RMS 9 ± 5 nm, Figure 2.3C) compared to the surface after etching. Smoothing of the carbon surface was even more pronounced with the 1.4 V waveform (RMS 5 ± 3 nm, Figure 2.3D). The difference in etching rates between the two extended waveforms is consistent with the XPS data for fluorine tracking where the larger overpotential caused more substantial removal of fluorine. Figure 2.3E
Figure 2.3. AFM images of the PPF electrode surface morphology after different treatment conditions.
(A) PPF electrode before any treatment. (B) PPF electrode after coating with silicon nitride, removal of insulation by etching with CHF3 and subsequent immersion in buffer
The AFM data revealed that the topography of fluoroform/oxygen plasma treated PPF electrodes before electrochemical treatment have peak-to-valley roughness values on the scale of 80 nm per 5 µm of lateral length. Application of the extended waveforms for 30 minutes led to the formation of a surface with 10 – 20 nm peak-to-valley change in height per 5 µm of lateral length. These results suggest that complete etching of a PPF electrode with a thickness of 400 nm could be accomplished within hours with these electrochemical treatments.
This hypothesis was verified by examining the electrode after multiple scans. During scanning the background current was monitored using both the 1.3 V and 1.4 V waveforms. The use of the PPF electrodes with the 1.3 V waveform applied at 60 Hz led to a decrease in the background within 10 hours and a similar disappearance of the background with the 1.4 V waveform after 1.5 hours. After the disappearance of the background, optical microscopy was used to examine the PPF microelectrodes. In both cases, the PPF electrodes had disappeared (Figure 2.4C, D). The electrodes did not disappear if they were immersed in the buffer solution (Figure 2.4B) for a similar time period without potential control or when they were scanned repetitively to 1.0 V. From the thickness of the PPF layer (400 nm), an estimate of the time for electrode disintegration can be established from the decrease in the background current. Etching rates were estimated to be 0.7 nm/min for the 1.3 V waveform and 4.4 nm/min for the
Figure 2.4. Images of PPF electrodes after prolonged treatment with the extended waveforms.
Optical microscopy images of PPF electrodes for different electrochemical treatment conditions. (A) schematic of microfabricated chip in which a SiO2 wafer served as a
substrate on which PPF electrodes were deposited followed by Si3N4 insulation. (B)
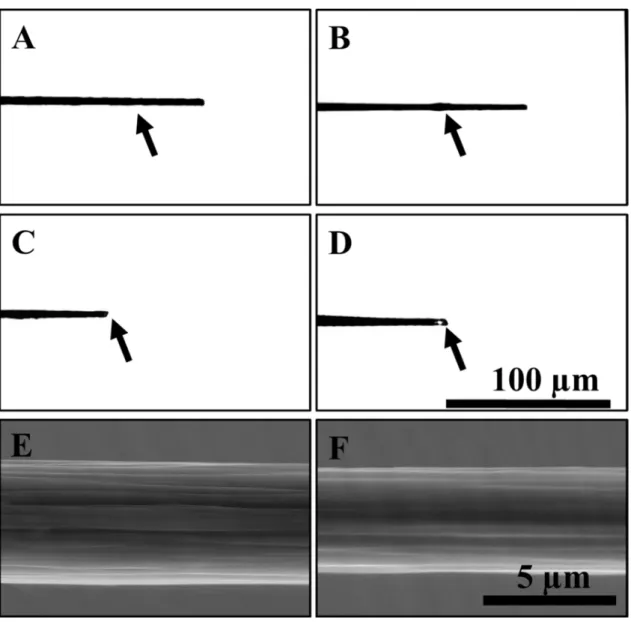
Do the waveforms with extended anodic potentials cause etching of only PPF electrodes, or do they affect other forms of carbon as well? PAN-type carbon fibers were used as a comparison. Carbon-fiber microelectrodes are routinely used for voltammetric detection of catecholamines both in vitro and in vivo. The diameter of the most popular carbon fibers (T-650) used in these types of experiments is 5 µm. If etching takes place on a carbon-fiber microelectrode, then it should be possible to observe the change in carbon-fiber diameter with optical or electron microscopy. As a control experiment, the 1.0 V waveform was applied at 60 Hz for 65 hours; it showed no significant change in carbon fiber diameter (compare Figure 2.5 A and B). However, prolonged application of the 1.3 V waveform at 60 Hz led to complete etching of the carbon-fiber microelectrode within 65 hours (Figure 2.5C). Application of the 1.4 V waveform led to a much faster etch rate causing the complete dissolution of the carbon fiber within just 6 hours (Figure 2.5D). For complete etching of the carbon fiber within 6 hours as seen with the 1.4 V waveform, the etching rate would be 7.5 nm/min, in the same range as observed at PPF electrodes.
Electron microscopy revealed in greater detail the oxidative etching-induced changes of the carbon fiber (Figure 2.5E and Figure 2.5F). The average decrease in
diameter of the carbon fibers was 0.9 ± 0.4 µm (n = 4) after 30 hour treatment with the 1.3 V waveform. Thus, application of the 1.3 V waveform to the carbon-fiber
Figure 2.5. Images of carbon fiber microelectrodes after prolonged treatment with the extended waveforms.
The etching of the carbon fibers also takes place with the extended waveforms applied at lower frequencies. Complete etching of carbon fibers was observed after 36 hours of application of the 1.4 V waveform at 10 Hz. This was achieved after 1.3·x 106 potential cycles with the 1.4 V waveform and after 1.4 x 10⁷ potential cycles with the 1.3 V waveform. Thus, the oxidative etching rate is linearly proportional to the frequency of the applied waveform.
Increased Adsorption of Catecholamines Resulting from Oxidative Etching of Carbon-Fiber Microelectrodes.
Regeneration of a fresh electrode in real time is advantageous during many electrochemical experiments. The chief benefit of this electrochemical surface treatment is the consistency in the electrochemical properties of carbon electrodes from experiment to experiment since the surface is renewed repeatedly. However, it is important to establish electrochemical performance of this surface towards redox active molecules. The kinetics and thermodynamics of electrochemical oxidation for catechols on carbon have been well documented, 30 and the biological importance of these molecules as neurotransmitters and metabolites makes them the analyte of choice. 7 As previously established, catecholamines strongly adsorb to the carbon surface. 16, 17 Many researchers utilize the extended waveforms because it has previously been reported to increase the adsorption of dopamine onto the electrode surface. 24 Catechols with different functional groups were used in this work to probe the nature of adsorption sites on the carbon at extended potential limits.