Anna R. Van Meter
A dissertation submitted to the faculty of the University of North Carolina at Chapel Hill in partial fulfillment of the requirements for the degree of
Doctor of Philosophy in the Department of Psychology.
Chapel Hill
2012
Approved by:
© 2013 Anna R. Van Meter ALL RIGHTS RESERVED
ABSTRACT
ANNA VAN METER: Does a sensitive palate beget sensitive mood? The relation between supertasting and disordered mood
(Under the direction of: Eric Youngstrom, PhD (Chair), Carol Cheatham, PhD, Andrea Hussong, PhD, Deborah Jones, PhD, Mitchell Prinstein,PhD)
Objective
Prevalence rates of bipolar disorder may be as high as 11% (Angst et al., 2003); currently, research is being conducted on biologically-based traits, with the goal to find ways to ascertain a person’s risk for bipolar disorder, or to lend greater certainty to a diagnosis. One trait of interest is an individual’s ability to taste phenothioureas, a family of bitter-tasting compounds (Wooding, 2006). The aim of the present study is to determine whether this taste sensitivity has utility as a biomarker for mood disorder risk and, if so, whether emotional reactivity and regulation moderate this relation.
Method
Participants (N=499) were undergraduates at the University of North Carolina at Chapel Hill. Participants completed a series of questionnaires related to their mood, emotion regulation, and family history of psychiatric disorder. Next, participants completed a mood induction paradigm. Finally, participants’ taste sensitivity was measured.
Results
regulation did not differ across groups. Scores on the BDI were related to taste sensitivity (p<.05), but this relation was driven primarily by outliers. Using regression, tasting predicted stronger responses to both positive and negative mood inductions (p<.05). Additionally, the interaction of negative emotion regulation and tasting predicted weaker responses to the mood inductions. Finally, emotion regulation strategies were predictive of both depression and hypomania scores (p<.05). Testing the effect sizes against the zone of indifference (r= ±0.2), only the emotion regulation strategies showed promise as predictors of mood disorder. Discussion
The present study represents the largest sample investigating mood and supertasting. Therefore, the low – or absent – effect size of taste sensitivity in the present analyses sheds doubt on the utility of taste sensitivity as a biomarker for mood disorder risk. However, there were trends to suggest that supertasters are more sensitive to their environment than
Acknowledgements
Table of Contents
List of Tables………..vii
List of Figures………....viii
List of Abbreviations………..ix
Introduction………....10
Objective Measure of Risk……….…11
Supertasting………....13
Mood………..17
Alcoholism……….……19
Mania………..20
Neurotransmitters………22
Bipolar Spectrum and Supertasting……….23
Emotion Reaction………23
Brain structure and function………25
Behavioral inhibition and behavioral activation systems………28
Emotion regulation………..……29
Objective……….30
Hypotheses………..………31
Method………32
Procedure………38
Analytic plan………...…42
Results………43
Preliminary Analyses………...43
Primary Analyses………...45
Discussion………..53
Limitations and future directions……….………..60
Conclusions………61
Appendix A: Study results excluding participants who smoke regularly, or smoked, ate or drank prior to participating………64
List of Tables
Table 1. Correlations between taste sensitivity, number of
tastebuds and outcomes of interest………....66
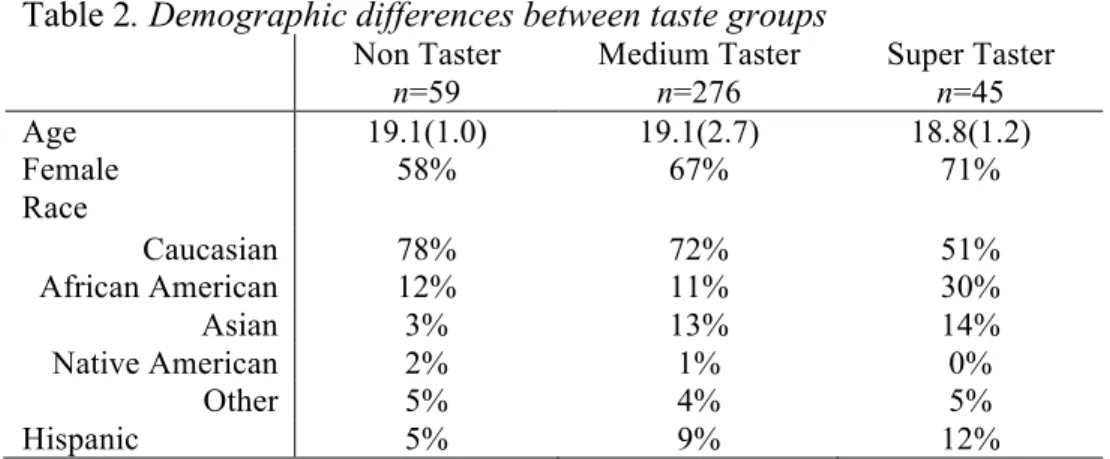
Table 2. Demographic differences between taste groups………...66
Table 3. Differences in treatment seeking across taste groups………...66
Table 4. Differences in familial and self-reported psychiatric disorder……….66
Table 5. Differences in alcohol consumption and consequences………...67
Table 6. Differences in mood induction across taste groups………..67
List of Figures
Figure 1. Counting of tastebuds using food coloring………..68 Figure 2. Distribution of PROP intensity ratings with taste
grouping alternatives considered……….68 Figure 3. Scatterplot of PROP intensity ratings and
number of tastebuds……….69 Figure 4. Cox regression indicating age of onset of emotional
or mood problems………....69 Figure 5. Illustration of BDI POMP score distribution………..70 Figure 6. Comparison of regressing BDI POMP scores on PROP
intensity with and without outliers……….…….70 Figure 7. Interaction of negative emotion regulation and PROP
Does a sensitive palate beget sensitive mood? The relation between supertasting and disordered mood
Mood disorders affect a large proportion of the population; lifetime prevalence rates for depression are estimated at >19% (Kessler et al., 2010) and rates for bipolar spectrum disorders may be as high as 11% (Angst, Gamma, Benazzi, et al., 2003). These disorders are associated with substantial human suffering, as well as cost to society, in the form of lost productivity and healthcare costs (WHO, 2008). Perhaps most concerning is the high rate of suicidal behavior among people with mood disorders; among those with bipolar disorder, up to 50% may attempt suicide and the completion rate is 20 times higher than that of other attempters (Baldessarini & Tondo, 2003; Bostwick & Pankratz, 2000; Goldstein et al., 2005).
Currently, diagnosis relies on clinical interview. Unique to bipolar disorder is the fact that retrospective reporting of symptoms is equally important to the diagnostic formulation as current symptomatology: the clinician must ascertain whether or not both manic and depressive symptoms have ever been present. Unfortunately, many clinicians fail to inquire about previous episodes of mania or depression, or the patient may not accurately remember (Maughan & Rutter, 1997; Youngstrom, 2010; Youngstrom, Birmaher, & Findling, 2008). Though other information – such as family history, prevalence rates, and reports from other informants – may be helpful in improving diagnostic accuracy (Youngstrom & Duax, 2005; Youngstrom & Youngstrom, 2005), these are not often included in an assessment.
Objective Measure of Risk
bias of interpretation. An objective way by which to assess risk for mood disorders would be a valuable addition to the field.
Genes. There is little doubt that genes play an important role in the development of mood disorders, but to date, the identification of genes specific to mood disorders has proved elusive (Hasler, Drevets, Gould, Gottesman, & Manji, 2006). The search for gene candidates for mood disorder is active, but there are hundreds of candidates (Johansson et al., 2001; Smoller & Finn, 2003), and studies have failed to replicate most findings; therefore, there is no consistent support for any one gene or family of genes (Anguelova, Benkelfat, & Turecki, 2003; Cho et al., 2005; Schulze & McMahon, 2009). Someday, a genetic test may be
available for bipolar and other mood disorders, but as yet, that possibility remains elusive. Most agree that bipolar disorder does not result from a homogenous etiology (Hasler, et al., 2006); rather it is the confluence of genetic and environmental risk that results in bipolar disorder (Faraone, Glatt, & Tsuang, 2003; Mick & Faraone, 2009; Serretti & Mandelli, 2008; Smoller & Finn, 2003). The identification of a component implicated in the
gene*environment interplay that can be easily and inexpensively tested would be an
and function, making it difficult to determine whether brain abnormalities are the cause or consequence of bipolar disorder (Savitz & Drevets, 2009). Finally, the brain abnormalities found in people with bipolar disorder can be different in adults and children, which confuses the implications of these findings from a developmental perspective (Pavuluri, O'Connor, Harral, & Sweeney, 2007). At this point, the limited utility of brain structure and function information cannot justify the great expense associated with the fMRI tests or other brain scans necessary to find abnormalities. A biomarker that can be identified quickly, and with limited time and monetary resources is needed.
Supertasting
One biomarker that can be easily and inexpensively measured, and that has been investigated in relation to alcoholism, and to a lesser extent, depression, is taste sensitivity. One’s sensitivity to specific bitter compounds can be easily and inexpensively tested and is linked to a single gene, making it a very promising genetic marker (Wooding, 2006). The evidence of a relation between taste and depression, though intriguing, has not been widely investigated, nor has research expanded to determine whether or not supertasting may also be associated with other mood disorders, such as bipolar disorder. This branch of research has not been developed, but the theory and results to date lend support to the additional
investigation of the relation between one’s taste sensitivity and mood.
Though it may seem like a stretch to propose taste sensitivity as a vulnerability for disordered mood, links between taste and affect are, in fact, well-established (Dess & Edelheit, 1998). Our taste experiences are sent to regions of the brain responsible for
feeling stressed or low, and find that eating these “comfort foods” improves their mood. Food consumption for the purpose of regulating emotion, known as instrumental eating, is found predominantly during negative mood states (Greimel, Macht, Krumhuberc, & Ellgring, 2006; Macht & Simons, 2000). Related, overweight is associated with depression (Petry, Barry, Pietrzak, & Wagner, 2008). Our taste preferences, in turn, are related to our affect and behavior. For example, people who are at high levels of stress or who are depressed, are more sensitive to sweet tastes, are more likely to report unpleasant tastes, and are more likely to be picky eaters (Dess, 1991; Dess & Edelheit, 1998).
TAS2R38. Preference or distaste for some flavors is genetically determined;
knowledge about the genes responsible for specific sensitivities can tell us about a person’s genetic profile without having to subject them to expensive genetic testing. Research has shown that people who are particularly sensitive to the bitter taste associated with
Pepino, Duke, & Reed; Reed et al., 2010). The identification of TAS2R38 has resulted in the initiation of new studies focused on phenotypes related to TAS2R38 and surrounding genes, rather than to taste sensitivity alone (Duffy, Davidson, et al., 2004; Duffy, Peterson, & Bartoshuk, 2004; Wooding, 2006).
Those with a dominant allele T on TAS2R38 will be able to taste the phenothiourea compounds; two dominant Ts will result in a person being a supertaster, someone who is extremely sensitive to phenothioureas. A single T will be a medium taster, someone who can taste phenothioureas, but for whom it is not extremely unpleasant. People, who have two recessive ts are known as nontasters; they cannot taste phenothioureas (Bartoshuk, et al., 1994; Joiner & Perez, 2004). The compounds used most frequently to test for tasting are phenylthiocarbamide (PTC) and 6-n-propylthiouracil (PROP). Recently, PROP has gained favor over PTC because it has no aroma, and it is used as a treatment for hyperthyroidism, so it has been tested for safety by the FDA (DiCarlo & Powers, 1998; Duffy et al., 2010). Studies using the method of supertaster identification described in the present study have consistently shown that about 25% of the population are supertasters, 25% are nontasters, and the remaining 50% are medium tasters (Bartoshuk, et al., 1994; DiCarlo & Powers, 1998; Wooding, 2006). However, it is acknowledged that these groupings may be somewhat
arbitrary (Bartoshuk, et al., 1994; B. J. Tepper, 2008).
2010; Duffy, Peterson, et al., 2004). Interestingly, some prime sources of omega-3 fatty acids are green, leafy vegetables and fish – flavors that supertasters find particularly off-putting; omega-3 deficits have been hypothesized as a risk factor for mood disorders (Hakkarainen et al., 2004; Logan, 2004; Montgomery & Richardson, 2008; Parker et al., 2006). Supertasting has also been linked to a number of physical health issues, including cancer and
cardiovascular disease (Duffy, 2007). Finally, since the 1960s, there has been research linking one’s taste sensitivity to a range of other traits, including personality,
psychopharmacologic reactions, and smoking behaviors (Bartoshuk, et al., 1994; Mascie-Taylor, McManus, MacLarnon, & Lanigan, 1983). Each of these correlates have also been studied in relation to bipolar disorder (Bagby et al., 1997; Hasler, et al., 2006; Kandel et al., 1997).
& Guinard, 2002), since fats are a dense source of easily-stored calories, and would have been beneficial to consume in times when food was not always easily accessible. Though this evolutionary adaption now results in a dislike of many vegetables and a preference for fatty foods, the extreme response to potentially-threatening foods could have been protective in another era.
Mood
A hypothesis, to be explored in the present study, is that supertasting represents a heightened sensitivity, not only to foods, but also to other environmental stimuli. People who are especially sensitive are more likely to react strongly to emotional stimuli, and these reactions may then influence subsequent interactions and reactions, creating something like a domino effect, whereby one’s mood and emotional state are highly affected (out of
proportion to any one stimulus). This may come across as moodiness and irritability, both characteristics of supertasters (Joiner & Perez, 2004), and eventually, act as a trigger to an episode of disordered mood. Dess (1991) also makes an argument for the relation between mood and eating more generally, saying that food is inextricably linked to our social and emotional development, and that our preferences and relationship to food is the product of a complicated interplay between genes and experience – not unlike the development of
disordered mood. In order to begin fleshing out the link between supertasting and disordered mood, the question of whether or not taste sensitivity is related to emotional sensitivity must be answered first.
& Edelheit, 1998; Whittemore, 1986) (cf. Jones, 2009). The ability to taste these compounds is genetic; people with the dominant T allele of the TAS2R38 gene can taste the flavor, whereas those without this allele cannot. Mood disorders are also highly heritable. Among family members of people affected, the rate of bipolar disorder is five times higher than the general population (Hodgins, Faucher, Zarac, & Ellenbogen, 2002; Tsuchiya, Byrne, & Mortensen, 2003). Similarly, the rate of depression among family members of people with major depression is three times higher than otherwise expected (Sullivan, Neale, & Kendler, 2000). The heritability of mood disorder is nonspecific, meaning that family members of people with bipolar disorder are more likely to have not only bipolar disorder, but are also at much higher risk for depression and other psychiatric disorders (DelBello & Geller, 2001). The genetics of mood disorder are more complicated than that of supertasting, which is due to a single gene, but the transmittal of the supertasting allele may be a way to measure a portion of genetic risk, in lieu of a more specific genetic test for mood disorders.
nontasters (Whittemore, 1990). This result has not been further explored, but if replicated, could offer a valuable way of aiding diagnosis in people with early onset mood disorder. The symptoms of mood disorder are often difficult to diagnosis in young people, and there has been a consistent call for objective measures of disordered mood in young people (Mascie-Taylor, et al., 1983). In other studies, familial mood disorder has been associated with an earlier age of onset (Faraone, et al., 2003); therefore, in order to investigate whether or not supertasting might be associated with a more heritable subtype of mood disorder, age of symptom onset and family history of psychiatric illness will be assessed in the present study. Alcoholism
other substances) to alleviate their mood symptoms, resulting in comorbid alcoholism and depression. Though this hypothesis has not been directly investigated, there are other data that offer reason to explore this: women are more sensitive to tastes than men (Bartoshuk, et al., 1994), are more likely to have comorbid depression and disordered eating, and often have comorbid depression and alcoholism (Bartoshuk, et al., 1994; Dawson & Grant, 1998;
DiCarlo & Powers, 1998). If this hypothesis were supported, it could have important implications for diagnosis and treatment.
Mania
Research on eating behaviors and mood has consistently found a relation between negative mood and cravings and eating behaviors, but positive mood does not seem to affect appetite in the same way (Macht & Simons, 2000). However, research on bipolar disorder (or mania) and its relation to supertasting, or eating / appetite more generally, has not been done; therefore, a relation between supertasting and symptoms of mania cannot be assumed.
eating disorder, tend to experience an inability to resist food cravings, a failure to appropriately weigh consequences, and a loss of control when binging. This type of impulsivity, with its focus on immediate rewards, may also be related to previous research suggesting that supertasters are more pleasure-seeking than non-tasters (Joiner & Perez, 2004). Again, there may be a subgroup of people for whom there is a problematic relation between mood and taste that can play out in multiple ways.
Perhaps a more compelling argument for the exploration of the relation between taste and mania is that, when specific depressive symptoms have been explored across tasters and non-tasters, differences that may be indicative of bipolar disorder emerge. Specifically, symptoms associated with atypical depression, often thought to be a prodrome to bipolar disorder (Perugi, Toni, Travierso, & Akiskal, 2003; Stewart et al., 2006), are more common and more severe among tasters than non-tasters (Whittemore, 1990). One of the primary symptoms of atypical depression is craving for dessert foods. Research has shown, across both animal and human models, that some individuals experiencing depressive symptoms will crave sweet and/or fatty foods and often “self-medicate” by indulging in desserts and other sweets (Willner et al., 1998). Interestingly, though the craving for sweets increases, the subjective pleasure of eating the sweet does not, which can lead to over-eating, as the person tries, unsuccessfully, to satiate their craving. The relation between negative emotion and using food as an emotion regulation technique is strong; in previous studies, it has held regardless of individuals’ gender, body weight, or dietary restraint (Macht & Simons, 2000). Furthermore, this association is found in both clinical and community samples; and, though it has not been linked to supertasting, it seems possible that an association exists, given
preference translates to craving, it may be that supertasters are more likely to experience atypical depression and, therefore, are at greater risk for bipolar disorder.
In addition to the symptoms of atypical depression, people who are supertasters and suffer from depression are more likely to have a prolonged course of illness (greater than two years) and to suffer from more severe symptoms (Whittemore, 1990). Early onset depression and recurrent episodes are both signs that a depression may later convert into a bipolar spectrum disorder (Strober et al., 1995).
Neurotransmitters
diagnosis, as people may be medicated with psychotropic drugs before they are assessed for bipolar, which can affect other characteristics associated with the disorder including mood, sleep, and even brain anatomy (Chang, et al., 2005; Pfeifer, Welge, Strakowski, Adler, & Delbello, 2008).
Bipolar Spectrum and Supertasting
Though bipolar disorder and depression are diagnostically distinct, there is evidence to support the idea of a spectrum of mood disorders, without clear boundaries (Akiskal et al., 2000; Angst et al., 2010; Angst, Gamma, Benazzi, et al., 2003; Goto, et al., 2010; Perugi, et al., 2003; Youngstrom, Van Meter, & Perez Algorta, 2010). In fact, many people with bipolar disorder will experience significant episodes of depression, and a commonly-held belief in the field is that bipolar disorder is often misdiagnosed as depression, due to poor assessment of hypomanic symptoms (Akiskal, et al., 2000; Angst, et al., 2010; Angst,
Gamma, Benazzi, et al., 2003; American Psychiatric Association, 2002). Though the research on supertasting and mood is limited to depression, there is good reason to hypothesize that the relation between supertasting and bipolar might, in fact, be stronger. The two most significant reasons are the relation between supertasting and emotional response, which is exaggerated in bipolar disorder, and the relation between supertasting and symptoms of atypical depression that are seen more often in people who also experience periods of hypomania or mania. The exploration of supertasting, in relation to the spectrum of mood disorders, including hypomania and bipolar disorder, is a novel addition to the field. Emotion Reaction
studies of humans have shown a relation between supertasting and tension, stress, and depressive symptoms (Dess & Chapman, 1990; Macht & Mueller, 2007; Mascie-Taylor, et al., 1983; Whittemore, 1986). A growing body of evidence suggests that supertasting is related to a greater readiness to respond to the environment (Macht & Mueller, 2007), an emotional “hair trigger.”
In an important study on the relation between tasting status and emotional reactivity, Macht and Mueller (2007) found that supertasters showed the strongest emotional response to an anger-inducing film clip, when compared to medium tasters and non-tasters. Smaller effects were found for other negative emotions, including fear, tension, and sadness. The findings were consistent for both genders. This result is particularly interesting because it lends credibility to the theory that there is an evolutionary reason for supertasters’ reaction: these individuals are more reactive to emotional stimuli, and may react particularly strongly to negative stimuli across senses. If the same pattern were found among people with mood disorders, it would support the hypothesis that sensitivity to emotional stimuli encountered in every day life may have a greater impact on those at risk for, or diagnosed with, mood
disorders. There is, in fact, a body of research that suggests that stress is a significant risk factor for the onset and maintenance of mood episodes (Cohen, Hammen, Henry, & Daley, 2004; Dienes, Hammen, Henry, Cohen, & Daley, 2006; Garnefski, Kraaij, & Spinhoven, 2001; Johnson & Miller, 1997; Tsuchiya, Byrne, & Mortensen, 2003).
This suggests that whether or not a person is currently in a mood episode, those with bipolar tend to have stronger reaction to emotional stimuli, which may result in negative
consequences. The hypothesis is that stronger emotional reactions seen in people with disordered mood may be attributed, in part, to an overall sensitivity, including taste. Brain structure and function
Amygdala. Though reactions to all emotional stimuli may be related to one’s taste sensitivity, most compelling is the likely relation to negative, threatening stimuli. Data from multiple fields of research, including mood disorder, schizophrenia, emotion regulation, and aggression, implicate the amygdala as the brain’s threat response center, responsible for mood regulation, emotional memory, and rage reactions (Altshuler, Bartzokis, Grieder, Curran, & Mintz, 1998). Across the lifespan, the amygdala shows both structural and
functional abnormalities in people with mood disorders (Blumberg et al., 2005; Chang, et al., 2005; Chang, et al., 2008; DelBello, et al., 2004; Dickstein et al., 2010; Kalmar et al., 2009; Pfeifer, et al., 2008). Interestingly, a recent study showed a strong association between the 5HTTLPR allele (serotonin, like that related above to taste sensitivity) and extreme amygdala
response to perceived threat (Hariri, Tessitore, Mattay, Fera, & Weinberger, 2002). The
authors describe a theory in which the heightened threat response, coupled with
environmental stress, leads to overstimulation of the amygdala, resulting in additional
abnormal function. This process maps nicely onto the phenomenon of exaggerated reactivity
to stress and consequential mood dysregulation described above. Interestingly, in rat studies,
manipulation of the amygdala, (by altering levels of noradrenaline and serotonin) resulted in
altered food preferences among rats, and in impairment of a previously learned taste
for novel vs. familiar foods, and in one’s ability to learn that ingesting certain foods is
associated with sickness, providing further evidence that similar systems may be involved in
taste and mood (Borsini & Rolls, 1984).
Amygdalar function can be measured using fMRI and could offer clues about an
individual’s risk for mood disorder (Chang, et al., 2008; DelBello, et al., 2004; Kalmar, et al.,
2009), but it is expensive and impractical as a diagnostic aid currently. However, if an
association can be made between amygdala dysfunction and taste sensitivity, which is easy
and inexpensive to measure, it could have significant utility.
Limbic system. The amygdala is not the only region of the brain that is related to both taste and mood; relative to the other four senses, the gustatory system is reflected in parts of the brain typically responsible for motivation, emotion, and autonomic processes (Dess & Edelheit, 1998; Norgren, 1985). The primary area of reception for the taste system is the limbic system; the termination points for nerves of the gustatory system are the
amygdala, thalamus, and hypothalamus (Norgren, 1985). The hypothalamus controls both hunger and thirst, it affects how much we eat and when we eat. Lesions of the hypothalamus may result in uncontrolled hunger, or cessation of eating. The hypothalamus is also the center of other body systems implicated in mood disorders. Of these, the hypothalamic control of our circadian rhythms is most important. People with bipolar disorder often experience sleep disturbance coinciding with mood episodes (Geller et al., 2002; Harvey, Mullin, & Hinshaw, 2006), or even chronic circadian rhythm instability, and are sensitive to environmental and other influences on their sleep patterns (Harvey, et al., 2006; Hasler, et al., 2006). This
related to both circadian rhythm instability and bipolar mood recurrence (Benedetti et al., 2003).
The thalamus is responsible for taste detection and recognition (Reilly, 1998), it is implicated in learned taste aversion, and food-related behaviors (e.g., seeking or saving food in the face of an anticipated shortage). Based on the theory, described above, that
supertasting may be an evolutionary artifact related to toxin avoidance, the importance of the thalamus’ roles of learning preferred or aversive foods, along with planning for necessary sustenance are evident. In addition to its role in the several sensory systems, the thalamus is thought to play a crucial role in the communication between the midbrain and the cerebral cortex; in bipolar disorder, the theory is that there is overactivation of subcortical regions, including the thalamus, and insufficient control by the cortex, which leads to dysregulation of mood and emotion (Blumberg et al., 2003; Chang et al., 2004; Chang, et al., 2008; Hariri, et al., 2002). Laboratory studies of the thalamus and its role in taste typically destroy the thalamus’ function through lesions, whereas in people with bipolar disorder, increased activation of the thalamus is often found during mood (both depressed and manic) episodes (Strakowski, DelBello, & Adler, 2005). So, though the thalamus is implicated in both the mood and gustatory systems, current research methods do not accommodate direct testing of the relation.
a way by which to assess and better understand brain abnormalities implicated in bipolar disorder.
Behavioral inhibition and behavioral activation systems
Previous research has shown that tasting sensitivity may interact with other traits, such as personality and temperament (Dess & Edelheit, 1998; Mascie-Taylor, et al., 1983), to make individuals more reactive to emotional stimuli and stress. Perhaps related is evidence suggesting that for people with a temperament characterized by arousability and dominance, stress increases sensitivity to bitter tastes (Dess & Edelheit, 1998). This gives some credence to the theory that trait sensitivity, which may also manifest in arousability, can lead to
heightened reactivity in the face of stress (as one would expect from a threatening stimuli). The behavioral activation (BAS) and behavioral inhibition (BIS) systems are also implicated in excessive reactivity; both are often found to be dysregulated in people with mood
disorders. Specifically, dysregulated BAS may lead to impulsivity and approach behaviors, whereas dysregulated BIS may lead to inappropriate reactions in the face of threat or stress (Alloy, et al., 2008; Johnson, Turner, & Iwata, 2003; Meyer, Johnson, & Winters, 2001). Though BIS and BAS have not been investigated in relation to supertasting, they are well-established relative to bipolar disorder and likely play a role in the overall relation between supertasting, emotional reactivity, and mood disorder.
individual’s reaction may grow out-of-proportion. Rather than an additive effect of multiple stressors, people who tend toward strong reactions may experience a more extreme non-linear increase in their emotion (Macht & Mueller, 2007). This potentially-rapid ramping up of emotion could have implications for the development of disordered mood. Another important factor is the fact that people with mood disorders, in addition to being highly emotional and reactive, often lack the ability to appropriately temper their reactions, leading to the prolonged, extreme moods that characterize the disorder (Henry, 2010; Hlastala et al., 2000; Meyer, et al., 2001).
Emotion regulation
Emotion regulation (ER) plays a key role in the maintenance of euthymic mood; people with mood disorders (depression and bipolar disorder) consistently show mastery of fewer emotion regulation strategies, and a tendency to have poorly regulated emotions (Angst, Gamma, & Endrass, 2003; Dickstein, Brazel, Goldberg, & Hunt, 2009; Green, Cahill, & Malhi, 2007), regardless of mood state (Gross, 1998). Dysfunctional emotion regulation is thought to develop as a result of many of the same factors that contribute to mood disorder, including both heritable, internal traits and external risk factors (Angst, Gamma, & Endrass, 2003; Calkins, 1994; Silk, 2006). One reason people with mood disorders tend to have poor emotion regulation may be that they were not taught good emotion regulation strategies (perhaps due to parental mood disorder)(Calkins, 1994). Another contributor to emotion regulation is the amygdala, in conjunction with the pre-frontal cortex. As described above, people with mood disorders tend to have abnormal
people with mood disorders are less able to effectively moderate those responses, which may lead to other problems, including interpersonal challenges and mood episodes (Yap, Allen, & Sheeber, 2007).
Emotion regulation occurs at multiple levels, within a number of different systems. As a result, there are many ways to measure one’s ER. For the present study, in which
participants are presented with an anticipated stimulus, against which they might be expected to use cognitive methods of emotion regulation, a self-report measure of emotion regulation strategies, the Cognitive Emotion Regulation Questionnaire (Garnefski, Kraaij, & van Etten, 2005; Jermann, Van der Linden, d'Acremont, & Zermatten, 2006), will be used to assess participants’ repertoire and mastery of a set of common emotion regulation strategies.
Emotion regulation should moderate an instinctual overreaction to an emotional stimulus, but if one had poor emotion regulation, the reaction could be explosive. It is not hard to see how the unique characteristics described above – arousability, tendency toward extreme reactions to threat, and an inability to temper emotion – could create a kind of “perfect storm” to initiate disordered mood.
Objective
The broad aim of the present study is to determine whether or not taste sensitivity has utility as a biomarker for propensity towards disordered mood and, if so, whether emotional reactivity to threat and the regulation of that reaction show promise as the mechanism by which disordered mood develops.
provide important information about a specific vulnerability that could inform future
prevention and intervention work. In addition, if people who are both supertasters and suffer from disordered mood are found to be different from others on measures of age of onset and / or family history of psychiatric disorder, this could be an important step toward identifying a subgroup of people for whom sensitivity to the environmental and genetic risk translates more often into psychopathology.
Hypotheses.
• Supertasters will have an earlier age of onset of emotional or behavioral problems than medium and non-tasters.
• Supertasters will have a higher rate of familial psychiatric disorder than medium and non-tasters.
• Supertasters will have higher BDI scores than medium and non-tasters. • Supertasting will predict heightened response to the threat mood induction. • Heightened response to the mood induction will predict increased mood
symptomatology.
• People who are supertasters will be less adept at regulating their emotions.
• The relation between supertasting and mood induction response will be moderated by emotion regulation, such that those who are proficient emotion regulators will react less than predicted by their tasting status.
Method
Participants
Participants (N=499) were undergraduates at the University of North Carolina at Chapel Hill. The study was advertised on the UNC Human Participation in Research website as an opportunity to participate in a study examining individual differences in taste and mood. Participants received course credit in their psychology class in exchange for their participation. Participants’ average age was 19 years, 63% were female. Seventy-one percent of participants identified as Caucasian, 13% as African or African American, 11% as Asian, 1% as Native American, and 4% identified as “Other.”
Studies often come under criticism for the use of college students in investigations of psychopathology (Coyne, 1994; Gotlib, 1984; Vredenburg, Flett, & Krames, 1993). The present study is not about mood disorders per se; it is about the relation between disordered mood and supertasting. There is no reason to think that students are less likely to be
Measures
Study questionnaires were administered online using Qualtrics (Qualtrics Labs Inc., 2009). The order of presentation for the questionnaires was randomized to reduce the potential for confounding effects created by priming or other ordering effects. Computer administration facilitated data management and decreased opportunities for entry mistakes and misplaced data. In addition, given the sensitive nature of some of the questions, computer administration has shown to elicit more honest, less distorted responses from participants than traditional interview formats (Evan & Miller, 1969; Richman, Kiesler, Weisband, & Drasgow, 1999).
Beck Depression Inventory (BDI). The BDI (Beck, Ward, Mendelson, Mock, & Erbaugh, 1961) has been used for almost 50 years as a reliable method for both detecting and measuring the intensity of depression (Beck, Steer, & Carbin, 1988). The BDI was developed based on clinical observations. It consists of 21 items, each indicating a specific symptom or attitude. The items are rated on a 0-3 point scale to provide information regarding the
Hypomanic Checklist (HCL-32). The HCL-32 was developed primarily as a self-report to help clinicians identify hypomanic symptoms in patients presenting with depression. It consists of 32 questions regarding symptoms of hypomania, to which individuals respond “yes” or “no.” In an international validation study of three diverse populations, the HCL-32 had a reliability score of .82 (Cronbach’s alpha). In our sample, the reliability was
comparable, Cronbach’s alpha .80. The HCL performed moderately well at discriminating between participants with MDD and those with bipolar disorder with an area under the curve of .74. Factor analysis revealed two classes of hypomanic symptoms, an active/elated factor and a risk-taking/irritable factor. This is comparable with the structure found in a study of an earlier 20-item version of the HCL (Hantouche, Angst, & Akiskal, 2003) and that associated with the hypomanic symptoms assessed by the Mood Disorder Questionnaire (Benazzi & Akiskal, 2003).
Age of onset. In order to investigate whether or not tasters, who self-identify as having struggled with mood or emotional problems, experienced those difficulties earlier than non-tasters (perhaps indicating a subtype of the disorder) the following questions were posed, following the administration of the BDI and HCL:
• Have you ever seen a mental health professional (psychologist, psychiatrist, counselor) for concerns about your emotions or mood?
• If so, how old were you when you first saw a mental health professional?
• How old were you when you first felt that your mood or emotions became difficult for you?
• How old were you when someone else first noticed or commented that your mood or emotions might be difficult for you (e.g., how old were you when someone asked or suggested that you might be depressed, or suggested that your mood might be unusually high)?
Cognitive Emotion Regulation Questionnaire (CERQ). The CERQ is a reliable and valid method by which to measure individual differences in emotion regulation strategies (Jermann, et al., 2006). The CERQ consists of nine distinct scales – self-blame, other-blame, acceptance, refocus on planning, positive refocusing, rumination, positive reappraisal, putting into perspective, and catastrophizing. The scales with higher scores indicate which cognitive strategies the participant uses most; the scales represent trait emotion regulation strategies, not the specific strategies used during the research session or in some other specific situation. High scores on self-blame, rumination, and catastrophizing are associated with increased risk of psychopathology (e.g., I feel that I am the one to blame for it), high scores on positive refocusing and positive appraisal are thought to be protective (e.g., I think that other people go through much worse experiences) (Garnefski, Kraaij, & Spinhoven, 2002). For the purposes of this study, scores on the negative scales (self-blame, rumination, and catastrophizing) were summed to create a negative index score, similarly, the positive strategy subscales (positive refocusing and positive appraisal) were summed, and the
neutral strategy – will be used in analyses. The reliability (Cronbach’s alpha) of these three scales, in our sample was .82, .83, and .81 respectively.
The measure has been tested on participants ranging in age from early childhood through adulthood and shows consistent reliability and validity (Garnefski & Kraaij, 2006a; Garnefski, et al., 2005). In addition, it can identify differences due to symptoms of
psychopathology in nonclinical samples (Garnefski & Kraaij, 2006b; Jermann, et al., 2006). Specifically, mood disordered participants score more highly on the self-blame,
catastrophizing, and rumination scales than healthy controls (Garnefski & Kraaij, 2006b; Garnefski, et al., 2005).
Family Index of Risk for Mood (FIRM). The FIRM (Perez Algorta et al., 2011) is intended to provide a simple method by which information about study participants’ family history of mental health issues can be gathered without burdening participants or attempting to collect excessive details that might be of questionable reliability. The FIRM was validated in a pediatric bipolar study of 162 families. Parents were presented with an array of questions about mental health history (suicide, depression, mania, hospitalization, or substance use) for each of several relatives (youth’s grandparents, parents, aunts/uncles, siblings, or children), resulting in a total of 25 checkboxes that a respondent could endorse. The brief family history items were well tolerated by families. The data collected showed a strong relation with youth diagnoses of pediatric bipolar disorder and the family history information provided
incremental validity when predicting bipolar diagnoses, even after controlling for other information provided by the same informant.
consequences among young adults. The 24-item scale was derived from a longer version using item response theory to comprehensively an efficiently capture the continuum of alcohol problems without gender bias. The scale includes items about consumption (e.g., “How often in the past 90 days have you been drunk (not just a little high) on alcohol?”) and its consequences (e.g., “I have driven a car when I knew I had too much to drink to drive safely”). Response patterns reliably order participants, with a Rasch model person reliability estimate of 0.82. The Rasch model–based index may be interpreted similarly to other
methods of internal consistency, like Cronbach’s alpha, which was .90 in the present sample. Mood rating scale. There is an active field of research on the best way in which to measure subjective human experiences, like mood. One method, the visual analog mood scale, strikes a nice balance between ease of use and ability to capture individual differences. It has been used successfully in many previous studies assessing the impact of a mood induction (Roiser, et al., 2009; Standage, Ashwin, & Fox, 2010). In the present study, each participant was presented with a question regarding their current mood, (e.g., “How fearful do you feel right now?”) and used a visual measure (a bar that can be completely or not at all filled in) to indicate how much they felt the specified emotion from “not at all” to “very” (Huntsinger, Sinclair, Dunn, & Clore, 2010). Ratings were based on the length (left to right) of the portion of the bar that is filled in, and were quantified automatically by the Qualtrics software
Demographics. Participants were asked about the following demographic
Procedure
Participants signed-up to participate in the study using the University’s Human Participation in Research website. They came to the study lab at a designated time and were told not to eat, drink, chew gum or smoke for at least one hour prior to their session.
Upon arrival at the lab, a trained research assistant guided participants through the informed consent procedure. They were told that their participation was optional, and that they could quit at any time without penalty. Participants were told that their participation would consist of completing a number of questionnaires, watching brief film clips, tasting a test strip, and having their tastebuds counted (by noninvasive method). Participants were told that the test strip was soaked in a chemical compound that has been tested by the FDA and is completely safe. If participants chose not to taste the paper, they were allowed to participate in the rest of the study; no one elected not to taste the paper.
Once informed consent was complete, participants were set-up at a computer and asked to complete the questionnaires on Qualtrics. The BDI and HCL were administered first, the order was random to avoid ordering effects in the results. Following the BDI and HCL, participants answered the appropriate Age of Onset questions, followed by the CERQ and the FIRM.
induction was achieved with the use of a movie clip, combined with the instruction for participants to really notice the intended mood. The average effect size for studies using this method was >.73 for both positive and negative moods (Westermann, et al., 1996).
In keeping with the results of the meta-analysis, a film-based mood induction was used in the study. Participants each watched two film clips; one was intended to induce a dominant / triumphant (positive) response, the other was intended to induce a threat / fear (negative) response. The clips were selected by the author and rated by an independent panel as the most effective for inducing the moods of interest out of a sample of clips.
The clips were presented using online media and were counterbalanced to help ensure that there were no ordering effects. Just prior to the first mood induction, participants rated their mood on the following dimensions:
• Fear (“How fearful do you feel right now?”) • Threat (“How threatened do you feel right now?”) • Anger (“How angry do you feel right now”) • Sadness (“How sad do you feel right now?”) • Happiness (“How happy do you feel right now?”)
• Strong (strong will be used in lieu of dominance; previous work by this group
suggests that dominance is a socially-unacceptable emotion and, therefore, less likely to be endorsed) (“How strong do you feel right now?”)
• Triumph (“How triumphant do you feel right now?”) • Excitement (“How excited do you feel right now?”)
from the post-induction length to determine change for each induction. This mood rating was repeated after each clip. Between inductions, participants were asked to complete a survey of demographic information as a distracter.
Supertasting was tested following the mood induction. The rationale for this sequencing is that supertasters are often reported to have a very strong, visceral reaction to the indicator paper. As such, it is possible that the experience of tasting the bitter compound would affect participants’ mood and subsequent mood ratings. Importantly, previous studies have shown that the measurement of sensitivity to bitter tastes is robust across levels of mood, likely due to its importance evolutionarily (Greimel, et al., 2006).
In order to get an accurate measurement of participants’ taste of the PROP compound, they were instructed not to eat, drink, chew gum, or smoke for an hour before their
appointment. Their adherence to this instruction was asked about and noted (Y/N) in the database. Given that taste sensitivity was measured last, after participants had already been in the lab for nearly an hour, adherence to this rule would be unlikely to have influenced the results.
PROP tasting was determined using paper strips with 50 mmol/l concentration of 6-n-propylthiouracil (Bartoshuk, 2011; Zhao, Kirkmeyer, & Tepper, 2003). Participants were instructed to put the paper on their tongue and to allow it to become saturated with saliva. Rating of the intensity of the taste of the paper was conducted using a labeled magnitude scale (LMS). The LMS is a 100-mm scale with the left side rated “barely detectable” and the right side labeled “strongest imaginable.” Previous studies of supertasting have reliably differentiated between taste groups using the LMS with PROP-soaked paper strips.
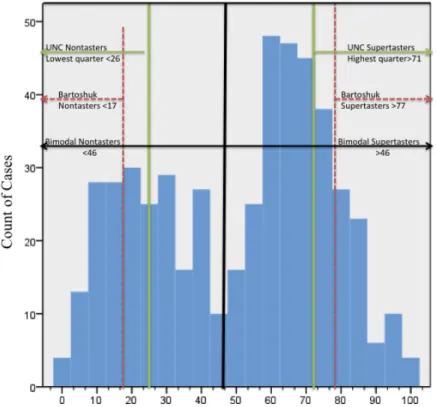
between studies; ratings of <17 mm are consistently associated with nontaster status, whereas supertaster status has been assigned at ratings of >51mm (Tepper, Christensen, & Cao, 2001), >71 (Zhao, et al., 2003) and >78 mm (Bartoshuk, 2011). Medium tasters fall between nontasters and supertasters (Bartoshuk, 2011; Tepper, et al., 2001; Zhao, et al., 2003). Because group assignment metrics vary, the more conservative estimate for supertaster of >78 mm, which was derived from the largest sample (N=5500), and using the same
methodology as the present study, was used in analyses. Additionally, further investigation of taste status, including participants’ physical reaction to the PROP strip was noted in order to investigate the relation between an instinctual, physical response and supertasting status.
Because some research has indicated that taste threshold is not always reliable as a measure of taste sensitivity, a secondary method of measuring supertasting was used in order to corroborate the PROP strip test result (Bartoshuk et al., 2004). This method involves painting the participant’s tongue with blue food coloring. The dye colors the tongue, but not the tastebuds, so they can be easily counted. See Figure 1 (Utermohlen, 2010). Previous research has successfully distinguished between supertasters and nontasters based on a count of ≥25 papillae within a 6mm diameter circle on the anterior region of the tongue
Following the determination of taste sensitivity, participants were debriefed. They were provided with a brief description of the study and its hypotheses and encouraged to ask any questions they might have. Participants were provided with the name and contact
information for the principal investigator and faculty advisor, along with the Psychological Services Clinic, should they wish to discuss the study and / or any concerns about their own mental health.
Analytic plan
Scores from the BDI, HCL-32, and CERQ were converted into a percent of the maximum possible score (POMP). Converting summed scores into percents provides a framework by which to interpret differences (Cohen, Cohen, Aiken, & West, 1999). Scores on the mood induction and PROP intensity were already on a 0-100 scale. Detailed
Results
Preliminary Analyses
Eating, drinking, or smoking prior to the assessment of supertasting may affect the result. This was a relatively minor concern in the present study due to the fact that we assessed supertasting status at the end of the experiment. Participants were asked whether or not they smoke regularly, as well as “Have you eaten in the past hour?” “Have you had anything to drink, other than water, in the past hour?” “Have you smoked in the past hour?” Forty-five people reported being regular smokers, 67 reported eating in the past hour, 47 reported drinking, and 3 reported having a cigarette. The number of smokers per taste group was not different (X2(4)=3.6, p=.47). All analyses were run excluding these people; the
relations between variables did not change. See Appendix A.
which have greater empirical support, were used in all subsequent analyses. Additionally, where appropriate, the PROP intensity rating was included as a continuous variable to detect whether or not sensitivity is associated with the outcomes of interest, regardless of group assignment. Though PROP intensity is not typically included as a continuous variable, research has shown that creating groups by using cut-off scores, in lieu of retaining a continuous variable, reduces power and can result in spurious relations (Cohen & Cohen, 1983; MacCallum, Zhang, Preacher, & Rucker, 2002).
As planned, the number of tastebuds counted was used as a test of the validity of taste groupings. Two research assistants counted each participant’s tastebuds, the reliability
between counts was good (intraclass correlation=.91); the average of the two counts was used. Based on the designation of nontasters having less than 25 tastebuds in a 6mm diameter circle and supertasters having more than 25 (Duffy, Davidson, et al., 2004), 326 people (65%) were designated as supertasters. This is much higher than the prevalence suggested by other studies, in which tastebud count and supertasting group were correlated (rho=.58, p=.05). Perhaps not surprisingly, the correlation between PROP intensity and number of tastebuds (r= -0.04, p=.34) was not significant in our sample. Number of tastebuds was only correlated with outcomes related to alcohol use. See Table 1 and Figure 3.
reaction, rather than PROP intensity, was not a viable alternative.
Due to the apparent lack of relation between the outcomes of interest and tastebud count and physical reaction, as well as the fact that most supertasting research – including research focusing on the serotonergic system – relies on reported taste sensitivity, rather than tastebud count or physical reaction, we decided to focus on PROP sensitivity and the groups thereby implied, rather than tastebud count or physical reaction, in the analyses.
There were no sex differences found between taste groups (X2(2)=4.38, p=.11). See Table 2. Similarly, there were no age differences (p=.95). Some studies have found racial differences in the prevalence of supertasting, with higher estimates of supertasters in China, Japan, and Africa, and lower estimates in India (Tepper, 2008), but recent studies of
American populations have suggested that race does not affect supertasting (Mennella, et al., 2010). In our sample, we found that people who identified as Caucasian were significantly less likely to be supertasters (X2(8)=18.73, p<.05) than other racial groups.
Primary Analyses
Age of onset. In order to test the hypothesis that supertasters would have an earlier age of onset than medium and non-tasters, age of onset was determined by the younger of the two ages reported in the age of onset questionnaire (age at which concern was expressed or age at which services were sought). Forty percent of the sample (n=199) reported having problems related to their mood or emotion at some point. The average age of first concern was 12.76 years. There was no difference in age of onset between taste groups
(F(2,196)=2.04, p=.13). See Table 3.
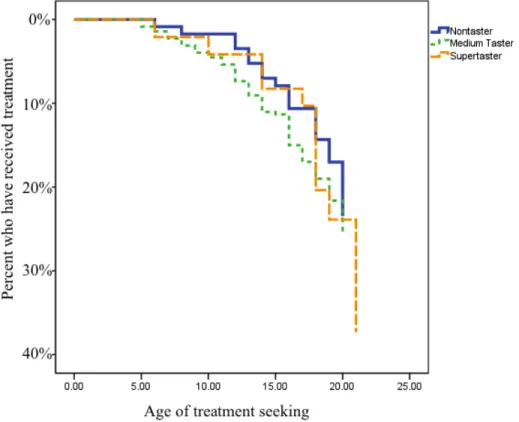
3. Cox regression was used to determine whether or not there was a difference in age of treatment seeking (X2(1)=3.19, p=.07). Substituting taste group with PROP intensity as a continuous predictor, the result remained nonsignificant. See Figure 4.
Family history. In order to test the hypothesis that supertasters have a higher rate of familial psychiatric disorder than medium and non-tasters, data from the FIRM were summed to determine the proportion of relatives affected by mental illness. See Table 4. Forty-two percent of the sample (n=210) reported a family history of mental illness. Chi-squared
analysis was used to determine whether or not there was a difference in the presence (yes/no) of alcoholism, depression, bipolar disorder, psychiatric hospitalization, and suicide in
participants’ families; there were no differences across the taste groups (ps=.15-.84). Kruskall-Wallis was used to determine whether or not there was a difference in the number of affected relatives across tasting groups; there were no significant differences (ps=.16-.96). Additionally, given previous findings related to family histories of depression and alcoholism among supertasters, a combined score of family members with depression and/or alcoholism was compared across groups; no differences were found. Using PROP intensity as a
continuous predictor in a regression analysis to assess whether taste sensitivity predicts overall familial psychiatric disorder, controlling for ethnicity, the result was not significant (p=.64). Because familial depression and alcoholism have been shown to relate to
supertasting in previous studies, these were also assessed using PROP intensity as a continuous variable in regression analyses; PROP intensity was not a predictor of familial depression (p=.44) or alcoholism (p=.32).
supertasters have higher BDI scores than medium and non-tasters, a one way ANOVA was used to assess differences in mean BDI scores across groups. The result indicated that supertasters had significantly higher scores than the other groups (F(2,496)=4.41, p<.01). Levene’s Test of Homogeneity of Variances was also significant, indicating that the within group variances differed significantly; the nontasters and medium tasters had lower average scores, but also significantly less variability in BDI scores than the supertasters. Using Games-Howell post-hoc test, this result was no longer significant (p=.08). Additionally, examination of the distribution of BDI scores revealed seven extreme outliers (more than three times the interquartile range). See Figure 5. Repeating the ANOVA without these data points led to a nonsignificant result (F(2, 489)=1.11, p=.33). After eliminating the outliers, PROP intensity as a continuous variable predicting BDI scores, controlling for ethnicity, was not significant. See Figure 6.
Examination of the HCL POMP scores did not reveal any outliers. The scores ranged from 0 to 93.75 with an average score of 60.01. ANOVA was used to assess differences in mean HCL scores across taste groups; there were no differences in HCL scores
(F(2,496)=1.26, p=.29). Similarly, regressing HCL scores on PROP intensity, controlling for ethnicity, PROP was not a significant predictor.
p=.42). Alcohol consumption was assessed using Kruskal-Wallis; for those under 21,
supertasters drank less frequently (p<.05), consumed more than five drinks on fewer days per week (p<.05), and got drunk less often (p<.05). Supertasters over 21 also drank less
frequently (p<.05), but did not differ on the number of days they drink more than five drinks (p=.15) or on the frequency they get drunk (p<.30). See Table 5.
Regressing alcohol consequences on PROP intensity in the younger age group, was not significant (B= -.06, p=.09). The same was true for the participants over 21 (B= -.06, p=.66). In previous studies (Driscoll, Perez, Cukrowicz, Butler, & Joiner, 2006), gender was found to moderate this relationship, such that female supertasters had more alcohol related consequences; in the present study, for participants under 21, being female predicted fewer consequences overall (B= -4.26, p<.05), but the interaction of PROP intensity and gender was not significant (p=.76) (Aiken, West, & Reno, 1991). The same held true for those over 21. Given the theory that people who are supertasters and have symptoms of depression might be more likely than non-depressed supertasters to use alcohol, alcohol use (sum of z-scored consumption scores) was regressed on PROP intensity and BDI scores, and on the interaction of these two terms. PROP intensity was a significant predictor of alcohol use in those under 21 (B= -.01, p<.02), but not for those over 21 (B= -.03, p<.06). Depression and the interaction of PROP and BDI were not significant predictors. In the full model, for both age groups, less than 2% of the variance in alcohol consumption was explained by BDI scores, PROP intensity, and the interaction term.
post-induction mood) to look for outliers. There were scores in the opposite direction of the intended induction (e.g., increased threat scores following the triumphant mood induction) these 57 responses were eliminated from relevant analyses (Parrott, 1991). Participants’ responses to the triumphant clip and the threatening clip were correlated, r=.47, p<.0001, indicating that people who reacted strongly to one induction, tended to react strongly to the other induction as well. ANOVA was used to assess whether or not a participants’ tasting status could account for the variance in response to (1) the threat-inducing clip and (2) the triumphant clip. There was no difference between groups on the induced triumph score (F(2,448)=.65, p=.52). Similarly, there was no difference in induced threat response (F(2, 486)=1.71, p=.18). See Table 6.
Next, differences in the overall positive (sum of happy, strong, excitement, triumph) and overall negative (sum of fear, anger, threat, sad) mood induced across taste groups were assessed. ANOVA indicated group differences in response to the negative mood induction (F(2,493)=2.98 p=.05). Post-hoc analyses demonstrated that the supertasters responded more strongly than medium tasters. Interestingly, investigating PROP intensity as a predictor of mood induction using regression, controlling for ethnicity, we found that PROP was related to Triumph, (B=0.13, p<.05), Excitement (B=0.11, p<.05) and overall Positive Mood (B=0.09, p<.05), as well as Threat (B=0.14, p<.05)
identified earlier, this result was no longer significant. None of the variables of interest were significant predictors of HCL scores.
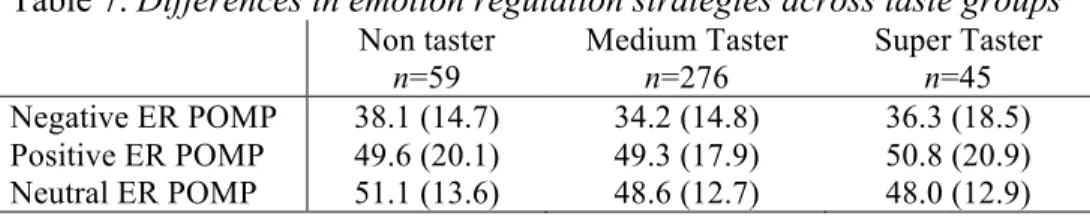
Emotion regulation. Trait emotion regulation strategies were measured using the CERQ self report. In order to reduce the risk of Type I error, the nine subscales were reduced to three index scores (negative, positive, neutral). Both the positive (r=0.66, p<.0001) and negative scales (r=0.30, p<.0001) were correlated with the neutral scale, but were not correlated with each other. Differences in emotion regulation strategy across taste groups were assessed; no significant differences were detected. See Table 7.
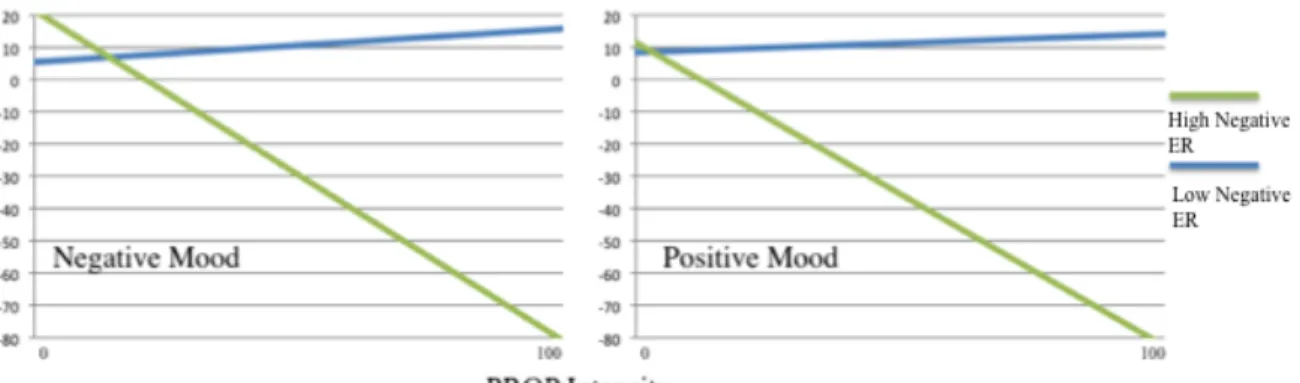
For the hypothesis that the relation between supertasting and mood induction
response would be moderated by emotion regulation, such that higher scores on the positive and neutral CERQ scales would predict less intense response to the mood induction,
Negative mood induction, regressed on PROP intensity, emotion regulation scores, interaction terms for emotion regulation and PROP rating, and the ethnicity covariate, was predicted by PROP intensity (B=.08, p<.05), negative emotion regulation (B=.16, p<.01), positive emotion regulation (B=.17, p<.01), and the interaction term for negative emotion regulation and PROP rating (B= -.01, p<.05). Similarly to the result found for positive mood induction, people sensitive to PROP, who use negative emotion regulation strategies, show less negative mood reactivity. See Figure 7.
Finally, the hypothesis that the relation between mood symptomatology and mood induction is moderated by emotion regulation was assessed using linear regression. Regressing BDI scores on positive and negative mood induction, positive, neutral, and negative emotion regulation strategies, on each of the interaction terms between mood induction and CERQ scales, only emotion regulation – both positive (B= -.07, p<.05) and negative (B= .26, p<.0001) – was a significant predictor. These relations held after excluding the outlier BDI scores. Interestingly, positive emotion regulation was not a significant predictor of HCL scores, but both negative emotion regulation strategies (B= .11, p<.05) and neutral emotion regulation strategies (B= .18, p<.01) predicted increases in HCL scores. This somewhat surprising result may be related to the “sunny,” positive, and the “dark,” negative sides of hypomania; related, we found that positive and neutral emotion regulation is
correlated with the Energy factor of the HCL (r=.18, p<.001), and negative emotion
regulation is correlated with the Problems factor of the HCL (r=.09, p<.05) and the Energy factor (r=.17, p<.001). There were no other significant predictors of HCL scores.
Erdfelder, Lang, & Buchner, 2007), to determine the effect size we were powered to detect. Given our sample size (N=499), alpha=.05, and power .80, we should be able to detect correlations as small as r=±.09. Though it is possible that there are relations between the
variables explored in this study that are smaller than ±09, these would not be likely to make a meaningful difference in the mood outcomes of interest.
Given that the main objective of this study was to determine whether or not supertasting might have utility as an objective measure of risk for mood disorders, we decided to use equivalence testing to determine whether there is potential for any of the indicators of interest to predict either depression (BDI scores) or mania (HCL scores). Equivalence testing, in this case, looks to see whether the relation found between two variables, and its standard error, fall within the zone of indifference (Foody, 2009). For the present study, we decided that the zone of indifference would fall between ±.2; this
Discussion
Overall, the hypotheses related to supertasting as a potential biomarker for mood disorder risk found minimal support. The difference in prevalence of supertasters found in this sample, as compared to the prevalence found in previous studies, may be a factor. However, the grouping of tasters is said to be arbitrary (Bartoshuk, 2011; B. Tepper, 2008), and different criteria have been used to create groups in previous studies (Tepper, et al., 2001; Zhao, et al., 2003). In this sample, the bimodal distribution of the taste intensity data suggests a two, rather than three, group model might better represent the data; however, using a dichotomous grouping did not affect the results. Furthermore, with 60% of the sample qualifying as supertasters under this classification, the value of being designated as a supertaster would be minimal, as it would offer little diagnostic specificity. Using the
intensity rating as a continuous variable preserves the variability of taste sensitivity and should capture a relation between taste sensitivity and the other variables of interest, if one exists. Related, this is the largest sample of the extant studies of mood and supertasting: more than double the size (N=200) needed for adequate power to detect an effect. Therefore, the low – or absent – effect size of taste sensitivity in the present analyses casts doubt on the utility of taste sensitivity as a biomarker for mood disorder risk.
study of supertasting and depression, those people who were supertasters had an earlier age of onset than the depressed people who were nontasters (Whittemore, 1990). This result was not supported; supertasters did not report an earlier age of onset and PROP intensity was not correlated with age of onset. This result may be related, in part, to the age of the sample; the average age is 19, which is not past the window of risk for onset of psychiatric problems. Additionally, taste sensitivity was not related to treatment seeking, which again may be due to the age of the sample and the fact that participants may not yet have the need for
psychiatric treatment. That said, given that the hypothesis was that there would be an early onset – younger than age 18 – it is unlikely that supertasting is related to early risk.
The hypothesis of early onset was predicated on the theory that supertasting might be indicative of familial risk. Specifically, supertasters were hypothesized to have higher rates of mood disorder in their families and to have lower rates of alcoholism. Neither of these results was supported. Similarly, the result from a previous study (Joiner & Perez, 2004) indicating that supertasters are less likely to have familial depression was not found in the present study.
disorder is disappointing, but perhaps not surprising, given the low levels of mood
symptomatology in the present sample (of 499 people, only 22 scored higher than 19 on the BDI, indicating moderate-severe depression) (Beck, et al., 1988; Lasa, Ayuso-Mateos, Vasquez-Barquero, Diez-Manrique, & Dowrick, 2000). It may be that, in a healthy sample, the relation between depression and supertasting is not detectable, or perhaps supertasting is associated with a subtype of mood disorder, just not one characterized by family history of psychiatric illness and early onset of symptomatology. Previous studies have challenged the theory that familial depression is related to supertasting (Joiner & Perez, 2004), pointing out methodological problems in the measurement of familial depression and in the grouping of tasters in studies that found an association (Whittemore, 1986, 1990).
The results related to depressive symptomatology were interesting; the initial relation between the BDI and supertasting (both across groups and using PROP intensity as a
depression and supertasting have used clinical samples, it would be worthwhile to follow-up on the hypotheses related to supertasting and mood disorder in a clinical sample.
Hypotheses related to mania were strictly exploratory; no previous examination of mania and supertasting has been published. There was no relation found between reports of elevated mood and supertasting groups or PROP intensity rating. The theory that high rates of impulsivity and pleasure-seeking (Joiner & Perez, 2004) seen among supertasters might be related to similar characteristics of [hypo]mania was not directly supported. However, there may be a confound related to the sample; overall, the scores on the HCL 32 were quite high and 43% of the sample rated their mood as “generally higher” than other people. Items asking about confidence, sociability, energy, sexual activity, and being distractible may tap into characteristics of college students, as much as they do symptoms of mania. Further evidence that the high scores were not due to mania is that items related to impairment were rated in the opposite direction of symptom ratings; participants reported that others were not concerned about their “high” episodes, and that these periods tend to last just 1-3 days, below the duration criteria for hypomania. Similar to the results with the measure of depression, it may be that this sample did not have an adequate level of manic symptoms to relate to supertasting; this hypothesis should be pursued in a clinical sample, in order to reach a more definitive conclusion.
One of the few hypotheses supported in this study was that supertasters would be more likely to avoid alcohol. We found that supertasters drank less frequently than