COMPLEXITY, UNCERTAINTY, AND THE STATUS QUO
Andrew H. Tyner
A dissertation submitted to the faculty at the University of North Carolina at Chapel Hill in partial fulfillment of the requirements for the degree of Doctor of Philosophy in the
Department of Political Science.
Chapel Hill 2018
Approved by:
c
2018
ABSTRACT
Andrew H. Tyner: Complexity, Uncertainty, and the Status Quo (Under the direction of Timothy J. Ryan)
TABLE OF CONTENTS
LIST OF TABLES ... vii
LIST OF FIGURES ... ix
CHAPTER 1: COMPLEXITY AND THE STATUS QUO IN REFORM DEBATES ... 1
Status Quo Bias and Resistance to Reform ...2
Uncertainty, Risk Aversion, and Status Quo Bias ... 3
Fostering Uncertainty Through Complexity ... 4
Hypotheses ... 6
Design ...7
Congressional Text Data ...8
Mining Congressional Speech ...9
Dependent Variables ...12
Independent Variables ... 12
Validating and Clustering Topics ... 13
Results ... 16
Attention to Specific Topics ... 19
Discussion and Conclusion ...21
References ... 23
CHAPTER 2: GOAL CLARITY, COMPLEXITY, AND ISSUE ENGAGEMENT IN DIRECT DEMOCRACY ... 26
Goal Clarity in Policy Reform Disputes ...28
Owned and Unowned Policy Goals ... 31
Clarity and Complexity in Direct Democracy ... 33
Variables ...35
Study 1: Results ...38
Study 2: Data and Design ... 44
Dependent Variables ...47
Independent Variables ... 48
Study 2: Results ...49
Discussion and Conclusion ...52
References ... 55
CHAPTER 3: COMPLEX POLITICAL DEBATES, ATTITUDE STRENGTH, AND POLITICAL ACTION ...58
Complexity of Issue Presentations ... 59
Complexity, Issue Considerations, and Attitude Strength ...60
The Conditional Effect of Complexity ...62
Attitude Strength and Political Participation ... 63
Hypotheses ...65
Study 1: Design ...65
Study 2: Design ...67
Variables ...68
Results ... 73
Discussion and Conclusion ...79
References ... 81
APPENDIX 1A: TEXT REPRESENTATION SELECTION ... 83
APPENDIX 1B: ADDITIONAL TABLES AND FIGURES ... 85
APPENDIX 2A: ADDITIONAL TABLES AND FIGURES ...88
APPENDIX 2B: LIST OF PROPOSALS (STUDY 2) ... 93
APPENDIX 3A: ISSUE ARGUMENTS ...95
LIST OF TABLES
Table 1.1: Summary statistics of one-minute floor speeches ... 10
Table 1.2: Estimated topics by substantive similarity ... 11
Table 2.1: Distribution of ballot characteristics across clarity scores ... 39
Table 2.2: Respondents are more likely to vote on all measures and support non-ideological measures as their goals become clearer ... 40
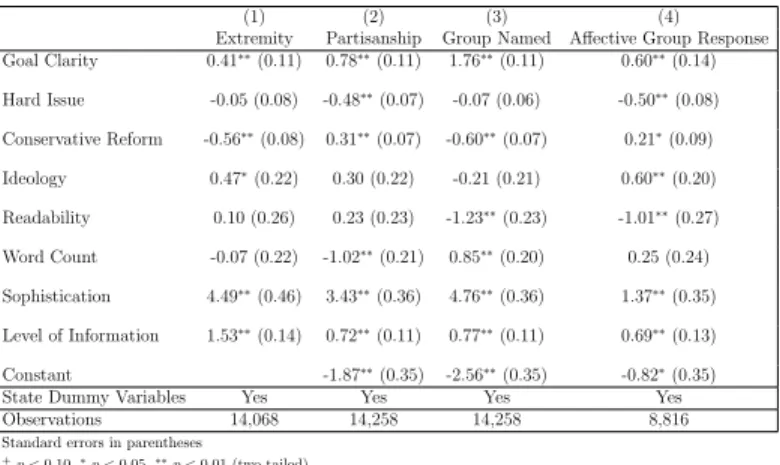
Table 2.3: Clear goals make ideological measures seem more ideologically extreme, partisan, and relevant to salient social groups ... 44
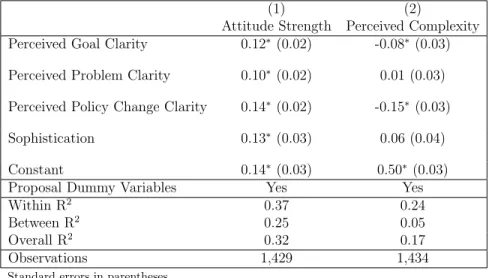
Table 2.4: Perceived goal clarity makes issue attitudes stronger and makes reform seem less complex ...50
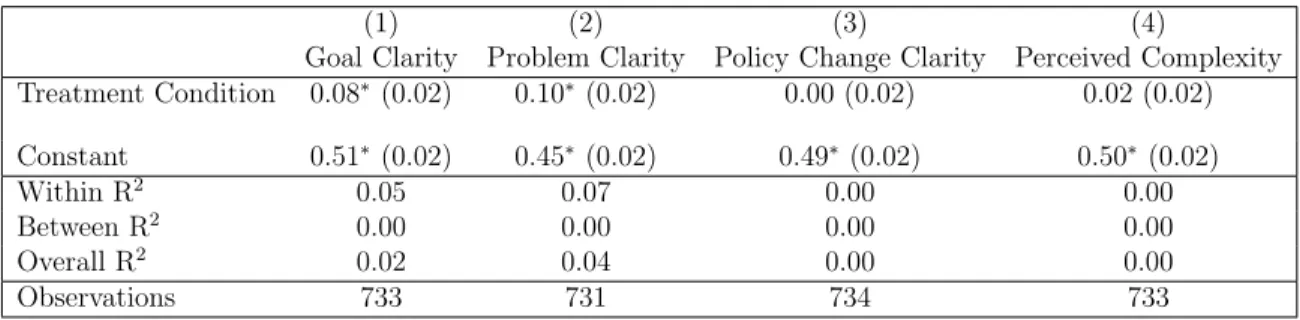
Table 2.5: Experimental manipulation worked as intended for three out of the four dependent variables: goal clarity, problem clarity, and policy change clarity, but not perceived complexity ... 51
Table 2.6: Goal clarity treatment inconsistently makes attitudes stronger ...52
Table 3.1: Political sophisticates maintain more consistent reactions to issue debates .... 72
Table 3.2: Political sophisticates are better able to counterargue incongruent political information ... 74
Table 3.3: The effect of complexity on ARD weakens as the proportion of arguments correctly identified (PCI) increases ...74
Table 3.4: Consistent reactions to a debate’s arguments strengthen issue attitudes ...76
Table 3.5: The ability to counterargue incongruent political information conditions the effect of complexity on attitude strength ...77
Table 3.6: Stronger attitudes predict greater willingness to participate politically ... 78
Table A1.3: Complexity and proportion of top topic by party and time ... 85
Table A1.4: Effect of party on attention to topics ... 85
Table A1.5: Effect of party on complexity across topic models (unclustered) ...86
Table A1.6: Effect of party and time on complexity across topic models (unclustered) ... 86
support non-ideological measures as their goals become clearer
(Student-coded goal clarity scores.) ...88
Table A2.9: Clear goals make ideological measures seem more ideologically extreme, partisan, and relevant to social groups (Student-coded goal clarity scores.) ...89
Table A2.10: Models corresponding to Figure 2.2 (Student-coded goal clarity scores.) ... 90
Table A2.11: Correlations of three perceived clarity measures (Study 2) ...90
Table A2.12: VIF scores and tolerances of three perceived clarity measures (Study 2) ....90
Table A2.13: Clear goals treatment condition increased perceived goal and problem clarity in both topics (Study 2) ...91
Table A2.14: Model corresponding to Figure 2.3 ...91
Table A2.15: Models corresponding to Figure 2.4 ... 92
Table A3.7: The effect of attitude strength on action is robust across four of the five action items ... 99
Table A3.8: Replication of Table 3.2 accounting for heteroskedasticity ...99
Table A3.9: Replication of Table 3.3 with studies separated out ...100
LIST OF FIGURES
Figure 1.1: Correlations among estimated topics ... 14
Figure 1.2: Complexity by party and time ...17
Figure 1.3: Proportion of speech covered by most prevalent topic ... 18
Figure 1.4: Proportion of top topic by party and time ... 19
Figure 1.5: Effect of party (Democrat) on attention to topics ...20
Figure 2.1: Conservative ideology better predicts vote choice when goals are clear ... 42
Figure 3.1: Theory of complex issue presentations ... 64
Figure 3.2: Effect of correct identification on ARD by sophistication ... 73
Figure 3.3: Effect of complexity on ARD weakens as PCI increases ...75
Figure 3.4: Effect of complexity on attitude strength by PCI ... 77
Figure A1.6: Complexity by party and time (unclustered) ...87
Figure A2.2: Replication of Figure 2.1 with student-coded goal clarity scores ...89
Figure A2.3: Probability of seeing proposal as partisan ...91
Complexity and the Status Quo in Reform Debates: Congressional Rhetoric on the Affordable Care Act
Political elites compete through their rhetoric to shape the public’s view of proposed policy reforms, particularly on highly salient issues (Baumgartner, Berry, Hojnacki, Leech & Kimball 2009). Supporters and opponents of reform each make their case to the public, with supporters hoping to either win approval for reform or at least not invite public resistance. Opponents hope to disquiet the public enough that supporters get scared off from further progress and reform efforts stall out. Both sets of elites strategically select arguments to achieve these outcomes (Riker 1986, Holian 2004, Jerit 2008, H¨anggli & Kriesi 2012).
One advantage that opponents of reform have over supporters is the public’s preference for the status quo. Existing theory has identified a status quo bias in human decision-making – a bias that exists alongside and rests on people’s aversion to risk and uncertainty (Eidelman & Crandall 2009). All else equal, status quo arrangements seem less risky and more certain in people’s minds than reform, which means that reform proposals need to clear an extra hurdle relative to the status quo to achieve widespread support: they need to advance a worthy goal while also posing a minimal risk in people’s minds.
quo bias by focusing people’s attention on only a few aspects of reform. Further, these as-pects are often highly agreeable. Thus, even beyond the individual frames that elites select to bolster their side, elites’ goals should shape the overall structure of the debate.
In this paper, I test the hypothesis that supporters and opponents of reform pursue differ-ent rhetorical strategies in issue reform debates. Supporters keep debates simple by focusing narrowly on a small set of arguments, while opponents make debates complex by spreading their attention widely across more arguments. Further, supporters focus more attention on gains relative to losses, and opponents take the opposite approach.
I find support for these expectations by topic modeling speeches on health care reform delivered by members of the House of Representatives between February 2009 and the end of March 2010. This procedure allows me to identify each of the main arguments about reform that were raised over the course of the debate. I find that Democrats – who were supporters of reform in this debate – spread their attention across comparatively fewer arguments than Republicans, who were opponents of reform. Furthermore, Democrats emphasized potential gains while Republicans stressed potential losses, as predicted. Thus, in this paper I show that elites’ goals influence both the content and the structure of issue debates.
Status Quo Bias and Resistance to Reform
I categorize political elites into two groups. Supporters of reform seek to change the policy status quo. Opponents of reform seek to maintain policy as it is. Each pursues a distinct rhetorical strategy in issue reform debates.
in favor of the status quo has been used to explain the challenges of achieving reform on both policy and procedural matters (Zink & Dawes 2015, MacKuen, Marcus, Neuman & Keele 2007).
Extensive research also demonstrates that most people hold an aversion to risks and potential losses (Tversky & Kahneman 1974). Risk aversion affects many aspects of people’s lives, including their political behavior. Individuals who are risk-averse are less supportive of challengers than incumbents in elections and demonstrate lower support for policy reforms that are perceived to be risky (Eckles, Kam, Maestas & Schaffner 2014, Kam & Simas 2012, Ehrlich & Maestas 2010, Eckles & Schaffner 2011).
Risk and loss aversion complement the status quo bias discussed above and help support it. Potential losses that follow reform loom larger than potential gains, reinforcing the dangers that attend altering the status quo (Arceneaux 2012). Thus, reform efforts that seem risky will face an uphill battle in gaining public support. As such, status quo bias and the risk aversion that underlies it represent some of the strongest tools opponents of reform have to undermine policy reform efforts.
Uncertainty, Risk Aversion, and Status Quo Bias
Fostering uncertainty about the consequences of reform is an effective way to activate both risk aversion and status quo bias. When the consequences of reform are in doubt, potential losses are more likely to outweigh potential gains. The known is preferable to the unknown, such that certain problems with the status quo can seem less troubling than uncer-tain risks of change (Fernandez & Rodrik 1991). Feeling unceruncer-tain is an aversive experience for most people, leading them to find ways to resolve uncertainty as efficiently as possible (Van den Bos et al. 2009). Managing one’s sense of uncertainty is a basic human motive, and people will take steps to restore confidence in their own judgments and assuage doubts when such feelings arise (Van den Bos & Lind 2002).
quan-tity, so even if aspects of it are unfavorable, its continuation does not foster the same level of uncertainty as reform proposals. Accordingly, risk-averse citizens are more com-fortable with known outcomes than probabilistic outcomes in political decisions (Kam & Simas 2010, Ortoleva 2010). Therefore, uncertainty over outcomes should lead citizens to oppose political reform, even when the status quo is recognized to be a problem.
Status quo bias as discussed here should be distinguished from a more general conserva-tive bias. Jost and Amodio (2012) review a host of psychological and physiological differences between liberals and conservatives and note that conservatives display less tolerance for ambi-guity and uncertainty than liberals, as well as less motivation to attain a cognitively complex understanding of reality. Acknowledging that ideology itself is a bulwark against feelings of uncertainty (Jost & Amodio 2012, 55-6), they argue that conservatism is distinguished by its particular appeal to people who are anxious in the face of uncertainty.
All the same, I propose that uncertainty should activate status quo bias for all citizens, not just conservatives. It may be that conservatives experience greater uncertainty than liberals in response to the same stimuli, or that conservatives require less uncertainty to activate status quo bias. Even so, that uncertainty will lead to status quo bias should be common to both liberals and conservatives alike. As such, raising uncertainty should serve to derail reform efforts by making the status quo seem more palatable relative to the proposed reform than it otherwise would be.
Fostering Uncertainty Through Complexity
of many different aspects of a proposal leads to cross-cutting evaluations of the proposal and an overload of information. Both outcomes should raise people’s uncertainty about reform.
Supporters of reform want to focus on the problems at hand, the solutions that will directly address the problem, and the goals that will be achieved by implementing that so-lution (Entman 2007). Opponents of reform want to make issues seem more complex by following two strategies. First, they spread their attention across a wide range of arguments by introducing a diverse array of considerations and dimensions of debate. Previous research has argued that elites will add a dimension to the debate when they are losing support in an attempt to flip the outcome (Riker 1990). Spreading attention across a wide range of arguments introduces many more criteria into a decision context, which can cause disengage-ment from the decision process and a reversion to the status quo (Barker & Hansen 2005). Further, all attempts to fit a high-dimensional political reality to a low-dimensional deci-sion context inevitably leave important considerations out of the equation (Jones, Talbert & Potoski 2003). Reducing dimensions is necessary to limit uncertainty and allow decisions to be made. By extension, political elites who want to raise uncertainty should attempt to increase the dimensionality of the issue debate.
As a second way of increasing complexity, elites can focus on the costs, unintended con-sequences, and the process of political reform itself. Discussing these aspects of reform activates risk and loss aversion directly by raising considerations about costs and losses. It also complicates the simplified policy narrative of the reform supporters, in which there is a clearly identified problem, a solution readily at hand, and lofty goals that will be achieved by implementing that solution (Entman 2007). Opponents of reform want to infuse the issue debate with complicating considerations to disrupt this simple narrative.1 Taking attention
away from exclusively problems and goals thus makes the debate more complex.
In addition to supporting or opposing reform, the time period within the debate should
shape how complex elites make their issue presentations. Opponents of reform should use more complexity earlier in a debate than later. As the debate wears on and arguments are used repeatedly across communication platforms, opponents gain a better sense of which arguments are gaining traction in the media and within the mass public. Opponents should focus their attention more centrally on the arguments they perceive as most effective in the later stages of the debate, and the list of talking points should narrow down accordingly.
By contrast, supporters should focus narrowly early in the debate on problems with the status quo and goals of political reform, resulting in the simple issue presentation discussed above. Over time, supporters are compelled to respond to the arguments presented by op-ponents that seem effective. The result is that supporters’ attention has to be spread more broadly as the debate enters the late stages, as they focus both on the problems and goals that represent the core of their rhetorical strategy and attempt to counter the most effective arguments presented by the opponents of reform.
To summarize, political debates are shaped by people’s status quo bias and risk aversion. Complex rhetoric activates both features of human decision-making. Thus, political elites in favor of reform should adopt simple rhetorical strategies focused on gains from reform or losses from inaction. Opponents of reform should adopt complex rhetorical strategies that employ many distinct arguments and that focus on potential losses from reform, since they hope to raise uncertainty and, by extension, risk aversion and status quo bias.
Hypotheses
This theory leads to a set of hypotheses about the different rhetorical strategies pursued by supporters and opponents of reform:
• H1: Opponents of reform should rely on a wider range of arguments in an issue debate than supporters of reform.
• H3: The range of arguments used by supporters of reform during an issue debate should increase over time.
• H4: Supporters of reform should focus more on problems and goals than opponents of reform.
• H5: Opponents of reform should focus more on costs, unintended consequences, and the process of political reform itself than supporters of reform.
Design
I test these hypotheses on the rhetoric of members of the U.S. House of Representatives during the 2009-2010 health care reform debate, which resulted in passage of the Affordable Care Act in March 2010. This issue debate is well suited to test my hypotheses for three reasons. First, it was a highly salient debate that dominated coverage for long stretches of time. Even politically disengaged citizens could be expected to know something about the issue from the high volume of coverage. While some issue debates might be confined to a smaller political class, members of Congress were almost certainly tailoring their talking points to reach the broader mass public. Second, the debate spanned well over a year, which allows me to test my time-dependent second and third hypotheses. Third, expanding health care coverage has long been a Democratic policy priority. Its fixture in partisan conflict over the decades supports my assumption that both sides of the debate had coordinated their talking points prior to and during the debate.
Relying on the rhetoric of U.S. House members has a number of advantages. First, as highly visible elites with a range of communication platforms at their disposal, House mem-bers help set the political agenda for both the media and the mass public (McCombs 2013). The topics they focus on become the public’s focus. The talking points that members promote become the pool of arguments that the media and public draw on in their own discussions of an issue.
allows us to see how the rhetoric of political elites changes across time as the debate proceeds through different stages. Finally, each House member in the data is affiliated with either the Democratic or the Republican Party. In the context of a major legislative debate, that affiliation allows us to assign each speaker the status of supporter or opponent of reform.
I rely on House floor speeches in the following analyses. Floor speeches have two advan-tages over other forms of public rhetoric for hypothesis-testing. First, they are written by House members themselves (or at least by members of their staff), so they represent their motivations and intentions in a distilled form. This contrasts with other communication for-mats like television or radio appearances, where their comments are at least partially shaped by the questions they receive. Second, floor speeches are long enough documents that the full range of arguments that a member of Congress wants to use can be included. Because I want to measure all of the arguments that a member thinks are necessary, it is important that members are not artificially constrained by the time they are allotted to speak or the questions they are asked to respond to, both of which apply during media appearances.2
Congressional Text Data
I use text data from the one-minute speeches delivered on the floor of the House of Rep-resentatives (or printed directly to the Congressional Record) from February 2009 through March 21, 2010. The speeches were identified through a supervised topic model implemented by the original collector of the speech data (Hughes 2016). 11,333 of the full set of 43,880 one-minute speeches delivered between 1989 and 2012 were hand-coded according to Baum-gartner and Jones’ Policy Agendas Project (PAP) major-topic coding scheme and were used to train the model on which the remaining speeches were classified.
I draw exclusively on the speeches that were classified as belonging to the Health topic between February 2009 and March 2010. Further, I have attempted to remove speeches with
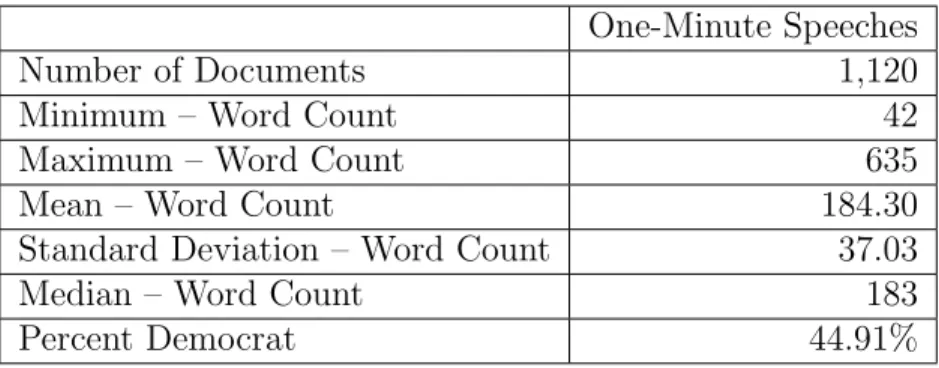
titles that do not correspond to health care reform. A full set of descriptive statistics about the resulting 1,120 one-minute speeches is contained in Table 1.1. The table demonstrates that there is a fairly even distribution of speeches across the two parties and that, on average, speeches are about the length of a long paragraph.
Table 1.1: Summary statistics of one-minute floor speeches.
One-Minute Speeches
Number of Documents 1,120
Minimum – Word Count 42
Maximum – Word Count 635
Mean – Word Count 184.30
Standard Deviation – Word Count 37.03
Median – Word Count 183
Percent Democrat 44.91%
The speeches represented in this table are all of the one-minute floor speeches delivered in the U.S. House about health care reform between February 3, 2009 and March 21, 2010.
Mining Congressional Speech
proportion of each document that belongs to each topic in the corpus (Roberts, Stewart & Airoldi 2016).
The output from fitting the STM is a collection of topics that produced the corpus and a list of words that have a high probability of being associated with each topic. Each document in the corpus receives a topic distribution that indicates the proportion of the document that was produced by each discovered topic (Roberts, Stewart & Airoldi 2016). These per-document proportions can be used to determine how concentrated or spread out each document author’s attention is across topics, which I use as a measure of each document’s complexity. This is discussed in greater detail below.
Testing the fourth and fifth hypotheses requires looking at the content of each topic instead of simply the distribution of the document across topic memberships. Since no topic labels are provided to the model at the outset in unsupervised learning, deciphering the unifying theme of each generated topic happens after model estimation. This process relies on researcher interpretation of each topic’s vocabulary. To aid the interpretation of topics, each word in a topic’s vocabulary is assigned a FREX (FRequency-EXclusivity) score that incorporates a word’s frequency within a topic as well as its exclusivity to that topic. Since the FREX index incorporates both elements, higher scores indicate that a word is particularly characteristic of that specific topic (Airoldi & Bischof 2015). The set of each topic’s words with the highest FREX scores indicate what the topic is about.
Finally, one of the more consequential decisions that the researcher needs to make when fitting an unsupervised topic model is the number of topics that should be estimated (Blei 2012). This is especially true for the present analysis, where the number of topics that the speakers can draw from directly impacts how concentrated or diffuse their topic attention is. As is the case with labeling estimated topics, there are no specific rules to follow when selecting the number of topics, though in general the number of topics should increase as the size of the corpus increases (Roberts et al. 2014).
of one-minute floor speeches delivered between February 3, 2009 – the earliest date that a speech about health care reform was given in the 111th Congress – and March 21, 2010. I surveyed a range of text representations and number of topics before determining the 40-topic unigram representation to be best. My discussion of those procedures is contained in Appendix 1A. Table 1.2 organizes the 40 estimated topics by underlying idea.
Table 1.2: Estimated Topics by Substantive Similarity
Category Topic Numbers
Status Quo Problems 2, 8, 9, 18, 19, 20, 22, 23, 33, 36
Goals 5, 7, 11, 14, 24, 26, 27, 40
Process 4, 16, 29
Cuts & Costs 3, 32, 35
Partisanship & Media Coverage 6, 12, 17, 21, 37
Big Government 1, 13, 25, 30
Constituents 31, 39
Small Business 34
Public Option 10
Unsure/Unlabeled 15
Unsure/Unlabeled 38
Goals (non-ACA) 28
Each number corresponds to a topic estimated from the 40-topic structural topic model referenced throughout the Results section. The groupings in this table represent clusters of similar topics.
I have minimized my manipulation of the floor speeches as much as possible. Three exceptions should be noted. First, I include only terms that appear at least five times in the corpus. Excluding terms that rarely appear ensures that idiosyncratic language and misspellings are not categorized into a topic. Second, I exclude a set of terms that show up frequently but that have no substantive relevance to political issues generally or health care specifically. These include the names of all the representatives serving in the 111th Congress who authored one of the speeches in the data, the name and abbreviation of every state, and a short list of additional terms.3 Finally, Joe Wilson (R-SC) delivered many speeches
in the dataset and ended each one, regardless of topic, with the same phrase: “God bless the troops and we will never forget 9/11.” The frequent repetition of this phrase causes it to show up as a distinct topic in most models, so I have deleted the phrase in the dataset whenever it appears.
Dependent Variables
Complexity: Complexity is the main dependent variable of the study, and it is measured by the distribution of attention across the topics of a speech. I calculate complexity as a Shannon’s diversity index score. Scores on the index are higher when the elements in a given unit (i.e. a floor speech) are evenly spread among many categories and lower when elements are concentrated narrowly into a small number of categories. In the context of the health care debate, each category is one of the estimated topics and an element is the proportion of a document about that topic. The formula for the diversity index is as follows, where p refers to the proportion of a document i devoted to topic j:
H =−
j X
i=1
(pij ∗ln(pij))
In a 10-topic model, for example, the index accounts for all ten topics’ proportions. In a 20-topic model, all 20 topics’ proportions are used. The variable is scaled 0-1. Higher values indicate greater complexity.
Topic Proportion: The proportion of a speech devoted to each of the topics is used to calculate the measure of complexity described immediately above. It is also a dependent variable in its own right, since H4 and H5 predict that supporters and opponents of reform will focus on different topics.
Independent Variables
Party: In the 2009-2010 health care debate, I consider all Democrats to be supporters of reform and all Republicans to be opponents of reform. Accordingly, I use a dummy variable indicating the speaker’s political party to measure which side of the debate the speaker represents. The variable is coded 1 when the speaker is a Democrat and 0 when she is a Republican.
Validating and Clustering Topics
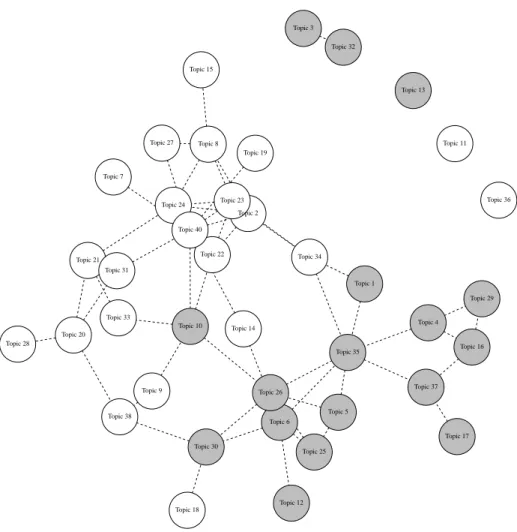
To validate that the topics produced by the unsupervised approach are meaningful, I plot the correlations among estimated topics below. White nodes represent topics where Democrats have a higher mean proportion, meaning they spend more time on average on that topic than Republicans. Grey nodes represent topics where Republicans have the higher mean. A dotted line connecting two topics means their correlation is above zero at any level of statistical significance.
Figure 1 plots these correlations. The figure provides evidence that the topics are clus-tering as expected, thus providing evidence that the STM is detecting meaningful topics. My theory suggests that supporters and opponents of reform should focus on different topics (i.e. Democrats should focus more on the goals of reforming health care). If the party of the speaker can predict topic use in this way, then topics that receive relatively more atten-tion from Democrats should correlate with one another, and topics that receive relatively more attention from Republicans should do the same. Figure 1.1 reveals this to be the case. Further, the correlations among topics make substantive sense, since talking points on the same topic are correlated. For example, topics 3 and 32 in the upper right corner of the figure are both about potential cuts to existing programs that might result from the reform proposal. The topics are correlated, as expected, and both are more frequently discussed by Republicans than Democrats.
Figure 1.1: Correlations Among Estimated Topics Topic 1 Topic 2 Topic 3 Topic 4 Topic 5 Topic 6 Topic 7 Topic 8 Topic 9 Topic 10 Topic 11 Topic 12 Topic 13 Topic 14 Topic 15 Topic 16 Topic 17 Topic 18 Topic 19 Topic 20
Topic 21 Topic 22
Topic 23 Topic 24 Topic 25 Topic 26 Topic 27 Topic 28 Topic 29 Topic 30 Topic 31 Topic 32 Topic 33 Topic 34 Topic 35 Topic 36 Topic 37 Topic 38 Topic 40
estimated topics prevents a clean hypothesis test.
To address this limitation, the 40 topics produced by the 40-topic model were narrowed down to 12 topics by combining together similar ideas. The resulting clustered topics are listed in Table 1.2 above. Categorizing topics like this departs from the data-driven approach of unsupervised learning, but it is necessary if the number and diversity of argument types is going to be properly measured. Clustering topics by the underlying argument they are making brings more substantive expertise to the analysis than a strictly unsupervised mod-eling approach would allow.
I have made a series of decisions that make the ensuing analyses more conservative against finding support for my hypotheses. First, I have intentionally been generous in categorizing Republican talking points together to concentrate their attention: the “costs” topic was com-bined with two topics on potential cuts that could result from reform. Further, Republican talking points about biased media coverage were grouped under a more general partisanship topic.
Given my theoretical focus on status quo bias, I group all topics focused on problems with the status quo into one category. Differences do emerge among these topics: some focus on sad stories of struggling constituents, others on the problem of pre-existing health conditions, and others still on rising premiums. Still, all are united by the theme that the current system is broken, and I classify them together accordingly. The analyses below all rely on the 12 clustered topics since the 12 offer more substantive and coherent arguments in this particular policy debate. For robustness, I have tested H1-3 without clustering in a variety of configurations and generally found support for them.4
Results
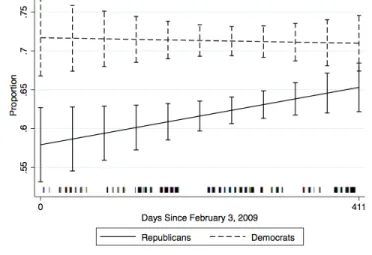
In the analyses below, I compare the complexity of Democratic and Republican speeches in two ways. Each test is OLS regression with three covariates: party of the speaker, the number of days since February 3, 2009 (the first date in the dataset), and an interaction between the two. The predicted value of the dependent variable is then plotted by party across the 411 days in the dataset with 95% confidence intervals. Dashed lines and confi-dence intervals represent Democratic estimates; solid lines and conficonfi-dence intervals represent Republican estimates.
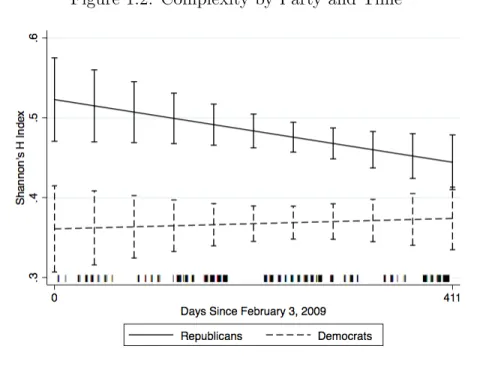
Figure 1.2 plots the predicted Shannon’s diversity index scores by party across the time period of the debate. As discussed above, index scores are highest when each constituent topic covers an equal proportion of the overall speech. As such, higher index scores for a speech indicate greater dispersion of attention across topics, meaning greater complexity. The figure provides supportive evidence for H1: Republican speeches, on average, are more complex than Democratic speeches. This is particularly the case early in the debate, where a switch from a Democratic representative to a Republican representative moves the speech over 16 percentage points up the complexity scale. The gap between the two parties’ speeches narrows over the course of the debate, as suggested by the sign and near significance at the 0.10 level of party and time’s interaction (p=0.11; see Table 1.3 for more detail). By March 2010, a switch from a Democratic to a Republican speech represents just a 7 percent increase in the complexity scale. Notably, Figure 1.2 reveals that the complexity gap narrows because Republican speeches get simpler – not because Democratic speeches become more complex. This pattern of evidence thus supports H1 and H2, but not H3.
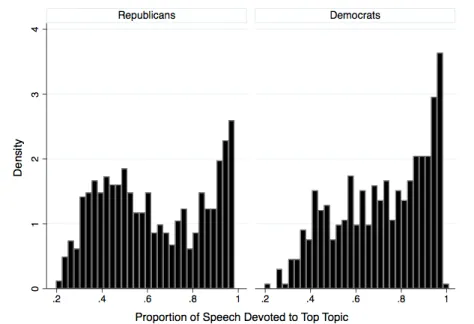
own most prevalent topic. Prevalent topics that account for a large portion of the speech crowd out other topics, which simplifies the speech. Accordingly, this proportion measure correlates strongly and negatively with the Shannon’s diversity index scores (-0.97).
Figure 1.2: Complexity by Party and Time
Figure 1.3: Proportion of Speech Covered by Most Prevalent Topic
This figure is derived from a linear regression model where the dependent variable is complexity of a speech as measured with a Shannon’s diversity index score. The index score has been re-scaled 0-1 with 1 representing the highest level of complexity. The estimates in this figure are drawn from Model 1 in Appendix 1B’s Table 1.3. The distribution of speeches across days is displayed by the hash marks on the bottom of the figure.
Figure 1.3 demonstrates that Democratic speeches are more concentrated near the upper end of the distribution. This suggests that, relative to Republican speeches, Democratic speeches tend to be dominated by a single topic. Indeed, only 20% of Democratic speeches had a top topic that covered less than 50% of a speech, compared to 37% of Republican speeches.
This leaves little room for consideration of multiple ideas in a single speech. Figure 1.4: Proportion of Top Topic by Party and Time
This figure is derived from a linear regression model where the dependent variable is the proportion of a speech devoted to its top topic. The estimates in this figure are drawn from Model 2 in Appendix 1B’s Table 1.3. The distribution of speeches across days is displayed by the hash marks on the bottom of the figure.
Attention to Specific Topics
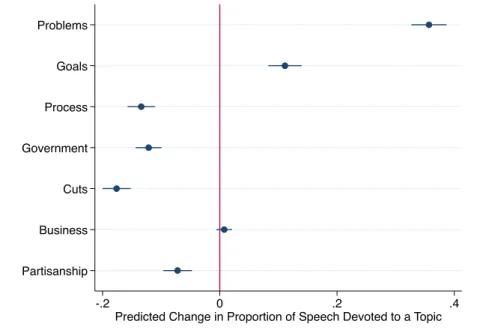
Figure 1.5: Effect of Party (Democrat) on Attention to Topics
Problems
Goals
Process
Government
Cuts
Business
Partisanship
-.2 0 .2 .4
Predicted Change in Proportion of Speech Devoted to a Topic
The plotted coefficients represent the effect of moving from the Republican to the Democratic Party on the proportion of a speech devoted to each topic cluster. Each coefficient is derived from a separate linear regression model where the sole independent variable is the political party of the speaker and the dependent variable is the proportion of the speech devoted to the topic.
As predicted, Democrats – the supporters of reform in the health care debate – give more attention to problems and goals than Republicans, who are the opponents of reform. Further, the negative coefficients on party in the process model and partisanship model suggest that Republicans spend more time discussing the process of policy reform than Democrats. The coefficient on party from the cuts model – which, again, combines together discussion of costs with cuts – also demonstrates that Republicans spend more time discussing this topic than Democrats. Finally, the topic underlying the government model is discussion of the expansion of the federal government and the dangers of an increased bureaucracy that would result from the reform proposal. As expected, discussion of this unintended consequence of reform is more prevalent among Republicans than Democrats.
a discussion of the goals of reform, the two topics account for nearly 68% of the average Democratic speech, compared with only 21% of the average Republican speech.
This suggests that Democrats pursued a clear strategy in the health care reform debate: focus most of the public’s attention on the ongoing health care crisis and underscore the need to achieve lofty reform goals. Republicans largely avoided these talking points. Instead, they focused on many different topics that diverted attention from the importance of reform. These strategies align well with what my theory of elite debate predicts – namely, the use and avoidance of complexity to, respectively, activate and undermine status quo bias.
Discussion and Conclusion
Political elites tailor their communication to suit their goals. On policy reform, support-ers and opponents have different goals and, consequently, pursue different communication strategies. Supporters of reform want to keep discussion of reform simple by focusing on a small set of arguments – chiefly the problems with the status quo and the goals of reform. Opponents of reform want to add complexity to the discussion by bringing up a wider range of arguments and discussing complicating considerations like costs, cuts, and complaints about the reform process. I have provided evidence in this paper for each of these expecta-tions by classifying the range of arguments used in a recent national debate.
that citizens will retreat from their demands for change (Tyner 2017).
My results demonstrate that supporters and opponents of reform largely focus on dif-ferent aspects of reform over the course of a debate. Normatively, this departs from what we hope elite debates will accomplish. We want elites to engage in a back and forth about the merits and pitfalls of reform so that the public can become better informed about all of the relevant considerations. By challenging the other side’s points, elites can help point the public toward the truth. Unfortunately, national policy debates fall short of this ideal. Each side focuses on their favored talking points and largely ignores the considerations raised by the other side.
REFERENCES
Airoldi, Edoardo M & Jonathan M Bischof. 2015. “A regularization scheme on word occur-rence rates that improves estimation and interpretation of topical content.” Journal of the American Statistical Association (just-accepted):00–00.
Arceneaux, Kevin. 2012. “Cognitive biases and the strength of political arguments.” Amer-ican Journal of Political Science 56(2):271–285.
Barker, David C & Susan B Hansen. 2005. “All things considered: Systematic cognitive processing and electoral decision-making.” Journal of Politics 67(2):319–344.
Baumgartner, Frank R, Jeffrey M Berry, Marie Hojnacki, Beth L Leech & David C Kimball. 2009.Lobbying and policy change: Who wins, who loses, and why. University of Chicago Press.
Blei, David M. 2012. “Probabilistic topic models.”Communications of the ACM55(4):77–84. Eckles, David L & Brian F Schaffner. 2011. “Risk tolerance and support for potential military
interventions.” Public Opinion Quarterly 75(3):533–544.
Eckles, David L, Cindy D Kam, Cherie L Maestas & Brian F Schaffner. 2014. “Risk attitudes and the incumbency advantage.” Political Behavior 36(4):731–749.
Ehrlich, Sean & Cherie Maestas. 2010. “Risk orientation, risk exposure, and policy opinions: The case of free trade.”Political Psychology 31(5):657–684.
Eidelman, Scott & Christian S Crandall. 2009. A psychological advantage for the status quo. In Social and psychological bases of ideology and system justification, ed. John T. Jost, Aaron C. Kay & Hulda Thorisdottir. Oxford University Press pp. 85–106.
Eidelman, Scott & Christian S Crandall. 2012. “Bias in favor of the status quo.”Social and Personality Psychology Compass 6(3):270–281.
Eidelman, Scott, Christian S Crandall & Jennifer Pattershall. 2009. “The existence bias.” Journal of Personality and Social Psychology 97(5):765–775.
Eidelman, Scott, Jennifer Pattershall & Christian S Crandall. 2010. “Longer is better.” Journal of Experimental Social Psychology 46(6):993–998.
Entman, Robert M. 2007. “Framing bias: Media in the distribution of power.” Journal of communication57(1):163–173.
Fernandez, Raquel & Dani Rodrik. 1991. “Resistance to reform: Status quo bias in the presence of individual-specific uncertainty.” The American economic review pp. 1146– 1155.
Holian, David B. 2004. “He’s stealing my issues! Clinton’s crime rhetoric and the dynamics of issue ownership.”Political Behavior 26(2):95–124.
Hughes, Tyler. 2016. “Assessing minority party influence on partisan issue attention in the US House of representatives, 1989–2012.” Party Politics p. 1354068816654323.
Jerit, Jennifer. 2008. “Issue framing and engagement: Rhetorical strategy in public policy debates.” Political Behavior 30(1):1–24.
Jones, Bryan D, Jeffery Talbert & Matthew Potoski. 2003. “Uncertainty and Political Debate: How the Dimensionality of Political Issues Gets Reduced in the Legislative Process.” Uncertainty in American Politics pp. 118–138.
Jost, John T & David M Amodio. 2012. “Political ideology as motivated social cognition: Behavioral and neuroscientific evidence.” Motivation and Emotion36(1):55–64.
Kahneman, Daniel, Jack L Knetsch & Richard H Thaler. 1991. “Anomalies: The endow-ment effect, loss aversion, and status quo bias.” The Journal of Economic Perspectives 5(1):193–206.
Kam, Cindy D & Elizabeth N Simas. 2010. “Risk orientations and policy frames.” The Journal of Politics 72(02):381–396.
Kam, Cindy D & Elizabeth N Simas. 2012. “Risk attitudes, candidate characteristics, and vote choice.” Public Opinion Quarterly p. nfs055.
MacKuen, Michael, George E Marcus, W Russell Neuman & Luke Keele. 2007. “The third way: The theory of affective intelligence and American democracy.” The affect effect: Dynamics of emotion in political thinking and behaviorpp. 124–151.
McCombs, Maxwell. 2013. Setting the agenda: The mass media and public opinion. John Wiley & Sons.
Nowlin, Matthew C. 2015. “Modeling Issue Definitions Using Quantitative Text Analysis.” Policy Studies Journal .
Ortoleva, Pietro. 2010. “Status quo bias, multiple priors and uncertainty aversion.” Games and Economic Behavior 69(2):411–424.
Riker, William H. 1986. The Art of Political Manipulation. Yale University Press.
Riker, William H. 1990. “Heresthetic and rhetoric in the spatial model.” Advances in the spatial theory of voting 46:50.
Roberts, Margaret E, Brandon M Stewart & Edoardo M Airoldi. 2016. “A model of text for experimentation in the social sciences.”Journal of the American Statistical Association (just-accepted):1–49.
Tversky, Amos & Daniel Kahneman. 1974. “Judgment under uncertainty: Heuristics and biases.” science185(4157):1124–1131.
Tyner, Andrew. 2017. “The Effect of Complex Political Debates on Attitude Strength and Political Action.” Presented at the Midwest Political Science Association meeting in Chicago, IL.
Van den Bos, Kees & E Allan Lind. 2002. “Uncertainty management by means of fairness judgments.” Advances in experimental social psychology 34:1–60.
Van den Bos, Kees et al. 2009. “The social psychology of uncertainty management and system justification.”Social and psychological bases of ideology and system justification pp. 185–209.
Goal Clarity, Complexity, and Issue Engagement in Direct Democracy
Empowering citizens to vote directly on legislation is a long-standing tradition in Amer-ican politics. By removing legislators from their mediating role between the public and policy, states allow citizens to directly engage with the trade-offs and uncertainties at the heart of lawmaking. Researchers disagree about the public’s suitability for this task, par-ticularly since the consequences of many ballot measures are often extensive. Nevertheless, recent years have seen an increase in ballot initiatives and referenda across the states. In the 2016 general election, voters across 34 states considered 154 ballot measures on topics as diverse as the minimum wage, solar energy, and higher education administration. Almost 40% were decided by a margin smaller than 15 points, illustrating that a small number of voters’ decisions can be consequential to policy outcomes.1
That citizens can ably make judicious policy decisions is far from obvious. Indeed, the American public is notoriously disinterested and disengaged from politics. A common expla-nation offered for the public’s political disinterest is the complexity of contemporary politics. Political issues and arcane institutional rules are seen as too complicated for the average citi-zen to follow. This helps explain the public’s interest in campaigns relative to policy-making and, within policy-making, the greater interest in symbolic issues relative to more technical issues (Nicholson 2003). If the political issues that citizens are asked to consider are too complex, then we should not expect direct democracy to generate optimal policy solutions. A subtle but important distinction exists between an issue’s inherent complexity and whether citizens perceive the issue to be complex. The latter depends on how the issue is conveyed to the public. Even on issues that involve highly technical solutions and widespread
disagreement about the appropriate policy instruments, the public’s attention can be drawn toward or away from complicating aspects of the issue. Voters’ decisions on policy issues can be made simpler or more complex by the kinds of considerations that come to the fore.
Herein, I argue that the policy goals of a reform proposal are a key consideration that can help simplify voters’ decision-making. Policy goals convey what a reform proposal is trying to accomplish, and they often involve a social outcome that many citizens consider important. The goals of a reform proposal are relatively easy to evaluate, since voters need only ask themselves whether they find the social outcome to be agreeable. When the reform goals constitute voters’ primary consideration about a proposal, voters should be more able and willing to deliver policy decisions about it.
Clearly conveyed policy goals in the text of ballot measures should make citizens more likely to participate in direct democracy and more likely to support reform when they do so. Voters should be more willing to participate because clearly conveyed goals make issues seem less complex and strengthen citizens’ attitudes about the underlying issue. They should also be more willing, on average, to support reform when they understand the measure’s goals, because agreeable goals help voters overcome status quo bias. Further, voters’ political pre-dispositions should be more predictive of their decision when the goals of reform are clear, because voters more easily see how their predispositions line up to the ballot measure.
I test these expectations through two studies. First, I analyze voter behavior on a set of 81 ballot measures appearing across 13 states in the 2012 general election, where I find evidence that clear goals make citizens more likely to participate, more likely to support reform, and better able to align the issue to their predispositions. In a second study, I con-struct an original survey with an embedded experiment to test two mechanisms underlying my theory: perceiving the policy goals of reform to be clear should make ballot measures seem less complex and should make citizens’ attitudes about the measures stronger. I find support for both expectations.
proposals. They simplify the decision context and help voters see policy issues in terms of familiar lines of political conflict. This allows voters to develop policy attitudes and hold them with enough confidence to apply these attitudes to their vote choices. This study thus demonstrates the behavioral effects of a key piece of information – namely, how clearly the policy goals of reform are conveyed to voters. In turn, understanding how this feature of ballot measures affects citizen response provides leverage on larger questions about issue mobilization in the mass public.
Goal Clarity in Policy Reform Disputes
I argue that an important factor determining how citizens will understand and respond to a ballot measure is the clarity of its goals. Any reform of the policy status quo is designed to achieve at least one social or political goal. These can range from reducing recidivism in the criminal justice system, to strengthening charter schools, to ensuring the fiscal solvency of public goods. Policy goals represent the starting point of most debates over issue reforms. They are the best argument that supporters of reform can make to the public: there’s a worthy goal that we can achieve, and the policy instrument before you will help achieve it. Accordingly, reform supporters campaign vigorously to promote a reform’s policy goals and the problems they will directly address, while opponents focus on anything else (Tyner 2016). Policy goals are identifiable by three characteristics.
welfare and equity. As terminal goals, welfare and equity require no justification – they speak for themselves. Policy goals, by contrast, often require justification. Thus, citizens could plausibly agree or disagree with a particular policy goal.
Second, policy goals are purposeful since they refer to a higher political end. On ballot measures, a subtle but important distinction exists between the policy goal and what the measure directly accomplishes. Often the latter is clearly stated, such that the direct effect of a ballot measure is clear, even when the purpose of that effect is unclear. One exam-ple from the analysis below is a ballot measure to allow a single, named company to open one casino in a specific county in the state. What this measure is aiming to accomplish is clear – opening a casino in a specific location – but why it is happening is left unstated. A measure’s goals are about the why: they are the answer a proponent would give if they were asked why they were supporting it. Goals are what one finds in party platforms and campaign websites: supporting public education, eliminating fraud and waste in government programs, or reducing reliance on fossil fuels. Opening a single location in a single county will never find itself on a campaign website or party platform. Goals, by contrast, address an important social concern.
Finally, policy goals address widely recognized public concerns. As such, they are mo-tivating. They provide a reason for citizens to participate that goes beyond civic duty. In elections, goals are the promises that parties and politicians make to voters, and they un-derlie the exchange of support between them. On a ballot measure, goals convey why the specific policy changes contained in the measure should be supported in the first place. Pol-icy goals are central to political decision-making (Stone 2012).
of abstaining. Accordingly, voters should be more likely to vote on a ballot measure when they better comprehend the goals it is aiming to accomplish.
On ballot measures, a primary way that voters come to understand reform goals is the text of the measure itself. For many voters, their first encounter with the measure is in the voting booth, so any considerations about the goals of reform have to derive from what they read. The text of a ballot measure can make its purpose relatively clear or unclear. The goal clarity of a ballot measure increases as the policy goals underlying the measure are articulated more explicitly or as the goals can be more easily deduced from the ballot text. As an example, the following ballot measure from Michigan in 2012 has a relatively clear goal: “Proposal 12-3, the Renewable Energy Amendment, would require utilities to obtain at least 25% of their electricity from clean renewable energy sources, which are wind, solar, biomass, and hydropower, by 2025.” The goal of the measure is made explicit by its name: the promotion of renewable energy. Even without the name, voters should be able to deduce the purpose of the measure from the specific policy change it would effect. By contrast, the underlying goal of the following ballot measure from Arizona is relatively unclear: “Proposi-tion 117 sets a limit on the annual percentage increase in property values used to determine property taxes to no more than 5% above the previous year, and establishes a single limited property value as the basis for determining all property taxes on real property, beginning in 2020.” Nowhere in the text of the measure is the ultimate policy goal made explicit. Further, only voters with a high level of sophistication will comprehend that the purpose of the measure is to lower the overall property tax rate.
no basis for developing a position. Thus, she will be more likely to abstain from the vote. Further, competing considerations about a policy issue can make citizens uncertain and prompt political disengagement (Zaller & Feldman 1992). In the context of ballot measures, considerations that pull voters in both directions can cause them to abstain from voting on the measure. A clear policy goal enables voters to look for just enough information to provide a confident decision without performing an exhaustive information search or ef-fortful processing (Simon 1985, Lavine, Johnston & Steenbergen 2012). When the policy goal is important enough to a voter to prompt a strong reaction, competing considerations about the measure can be more easily dismissed. In this way, clear policy goals simplify decision-making by allowing for satisficing behavior.
• H1: Voters should be more likely to vote on a ballot measure when its goals are clearer.
Owned and Unowned Policy Goals
Clear goals should prompt citizens to vote on a ballot measure instead of abstaining. Whether they vote to support or oppose it depends on the content of the goal. For policy goals that are unassociated with a particular party, clear policy goals should increase support for reform. For policy goals that are the subject of partisan conflict, clearly conveyed policy goals should help voters register a vote choice that aligns with their political predispositions. Policy goals vary by how closely they are aligned with a party or an ideological camp. Some goals have become owned by one party over time – for example, limiting access to firearms or reducing the regulatory burden on businesses. By contrast, other goals share a consensus across political divisions, such as fostering economic growth (Egan 2013). The distinction between ideological and shared goals is distinct from but closely related to the difference between position and valence issues (Fiorina 1981).
biases their preferences in favor of maintain existing arrangements over pursuing alternatives (Eidelman & Crandall 2012, Kahneman, Knetsch & Thaler 1991). Individuals’ preferences for precedent and their tendency to see changes (and the people seeking them) as extreme and unreasonable make their default position opposition to change, particularly when they feel uncertainty about it (Fernandez & Rodrik 1991). This owes, in part, to people’s ten-dency to misperceive changes to the status quo as overly drastic (Enelow & Hinich 1984). Bias in favor of the status quo has been used to explain the challenges of achieving reform on policy preferences, procedural matters, and election outcomes (Eckles, Kam, Maestas & Schaffner 2014, Kam & Simas 2012, Zink & Dawes 2015, MacKuen, Marcus, Neuman & Keele 2007).
Status quo bias will be particularly strong when the goals of reform are unclear. The uncertainty of change can be tolerated when the goals of reform are worthy enough. When there is no clear goal guiding the reform, the certainty of the status quo should win out. Without an active reason to support a reform effort – an active reason that would be pro-vided by clearly understanding a reform’s goals – voters’ status quo bias will cause them to default toward opposing it. When a ballot measure’s goal is both clearly understood and shared across political divisions, voters should respond by supporting it.
• H2: For ballot measures with shared goals, goal clarity increases support for reform.
Allen 1980). Voters want their political decisions to align with their longer-standing political commitments. Accordingly, party and group cues often influence voter decision-making on ballot measures (Boudreau & MacKenzie 2014, Lupia 1994).
In the absence of group cues in the text of a ballot measure, voters must rely on other features of the text to determine whether they should support or oppose it. Clearly con-veyed ideological goals help voters make this decision by providing a strong signal about the partisan or ideological agenda behind the measure. Even an unsophisticated voter will know that a measure to restrict abortion rights was generated by conservatives and Republicans. Thus, if clear ideological goals help voters connect their predispositions to ballot measures, voters’ predispositions should be more predictive of their vote choice when goals are clear.
• H3: For ballot measures with ideological goals, goal clarity helps citizens vote in line with their predispositions.
Clarity and Complexity in Direct Democracy
Above, I propose that goal clarity is an important characteristic that determines how citizens evaluate ballot measures. A necessary step in developing the case that goal clarity guides such decisions is to distinguish it from other ballot characteristics that might influence voting decisions – particularly characteristics that shape how complex a ballot measure seems. Here, I conceptually distinguish goal clarity from two prominent concepts in the direct democracy literature. Later, I assess their empirical relationships.
reform on hard issues (Hessami 2016).
A second related concept is the presentation of the ballot text. The word count and readability of a ballot measure often serve as measures of its complexity (Reilly & Richey 2011, Milita 2015). The former has been found to decrease willingness to vote on measures. Similarly, longer ballots that include many propositions interfere with voters’ ability to translate their policy preferences into a vote choice (Selb 2008). Researchers have also found that framing measures in terms of protections versus rights and in terms of repealing an existing policy can decrease support for reform. These frames also make those who would otherwise support reform abstain, effects that are as strong or stronger on easy issues than hard issues (Hastings & Cann 2014, Burnett & Kogan 2015).
Taken together, these studies demonstrate that the content and presentation of a ballot measure shape voter behavior. What these studies of complexity miss, though, is the question that voters ask themselves first when considering a ballot measure: namely, are the goals of this measure worth supporting or opposing? Hard issues and lengthy ballot texts might make it more difficult for a voter to think through the consequences of a measure, but that does not mean the measure is inscrutable. With a clear policy goal guiding their considerations, voters can register a confident vote choice about easy and hard issues alike.
Study 1: Data and Design
To test the expectations articulated above, I turn to the 2012 ANES Direct Democracy study, a two-wave panel that was administered shortly before and after the 2012 general election. 5,415 participants were recruited from 13 states that had measures on the ballot that year. Respondents were shown the measures’ texts and asked a series of questions about each one. The number of ballot measures each respondent saw depended on their state, ranging from 2 to 11.
how clearly the goals are conveyed. Because the 81 ballot measures vary by issue area and goal clarity, the expectations from both theories can be simultaneously tested.
By including questions about each ballot measure’s ideological, partisan, and group as-sociations, the ANES data also allow the mechanisms behind my theory of participation and support to be tested. Further, the ANES data provide questions necessary for both a political sophistication control variable and a measure of symbolic ideology. Finally, by fo-cusing on real ballot measures that most respondents had the chance to learn about and vote on outside of the survey environment, this study has a particularly high degree of external validity.
Variables
Above, I suggest that the clarity of a ballot measure’s goals affects citizens’ decisions to participate in the direct democracy process. It also affects their decisions to support or oppose the measure. I rely on two variables from the ANES to measure these concepts. Issue participation is measured as a dichotomous variable indicating whether a respondent voted on the ballot measure (1) or abstained (0). Support for reform is a dichotomous variable indicating whether the respondent voted in favor of (1) or against (0) a particular measure. Only respondents who voted at all on the ballot measure are included in this variable.
that the direct effect of a measure is clear, even when its purpose is unclear. One example from the data analyzed below is a proposal to allow a single, specific company to open one casino in a specific county in the state (Arkansas). What this ballot measure is aiming to accomplish is clear – opening a casino in a specific location in Arkansas – but why it is happening is left unstated.2
As I note above, I also wish to account for other ballot characteristics that might de-termine voters’ decisions, and which will help assess the distinctiveness of my goal clarity measure. The first of these is whether an issue is easy or hard, which I include as a dummy variable in the analyses below. The definitions of easy or hard are borrowed from Ellis and Stimson (2012): social issues are easy and economic issues are hard. This definition is po-tentially simplistic, particularly on ballot measures that mix elements of both. Even so, it remains a useful generalization. I classify a measure as economic if the underlying issue is about regulation of economic conduct or the management of public goods and programs, and I classify a measure as social if the issue is about the regulation of personal, non-economic conduct. Social issues also include law and order ballot measures and other measures that feature culturally salient issues. Ballot measures that focus primarily on procedural reforms are neither social nor economic. I classify them as hard because they fit the definition of hard issues that Carmines and Stimson (1980) lay out in their original article.
Because citizens’ voting decisions are also shaped by the ideological tilt of the ballot mea-sure, I include a variable assessing the direction of policy reform that takes three categories. The excluded category is that the policy reform is neither liberal nor conservative. The non-excluded categories are that reform pushes policy in a liberal direction and that reform pushes policy in a conservative direction. A ballot measure is considered to move policy in a liberal direction if it addressed traditional concerns of the political left (e.g. raising revenues
and tax rates; greater financial support for welfare programs and public education; broaden-ing access to marijuana). A measure is considered to move policy in a conservative direction if it addressed traditional concerns of the political rights (e.g. capping public revenues and lower tax rates; limiting access to abortion; adopting a more punitive approach to combat-ting crime). A measure is considered to move policy in neither direction if it addresses a policy concern unassociated with the left or right (e.g. reorganizing government operations to make them run more efficiently). Ballot measures that address concerns of both the left and the right are also categorized as neither.
It is also important to account for respondent-level characteristics that help determine vote choice, and which might interact with ballot characteristics. As such, I measure how informed the respondent is about each measure they read and each respondent’s ideology. I also include an additional control for political sophistication, discussed below.
Respondents reported how informed they were about each ballot measure they saw on a 1-5 scale, where 5 indicates the highest level of information about a measure (rescaled to 0-1 below). This independent variable thus varies both by individual and by ballot measure. I include this self-reported variable to account for differences in the campaign environment surrounding each ballot measure. Presumably some of the measures received more attention from media outlets and statewide political organizations than others. Further, voters’ un-derstanding of a measure should increase as media and campaign attention increases, which should make them more comfortable voting on it instead of abstaining. Since partisan ballot measures are more likely to be subject to organized campaigning, controlling for respondents’ level of information addresses this potential confound.
Beyond these central predictors, I also include a range of additional ballot-level and individual-level controls. To account for other measures of complexity in the direct democ-racy literature, I control for each ballot measure’s word count and readability3. I also control
for respondents’ level of political sophistication4 and the state where each respondent lives5.
The dependent variables discussed above are either dichotomous or categorical. In the analyses to follow, I run a series of logistic or ordered logistic regression models to test my hypotheses. Each model includes random effects for individual respondents to account for any clustering, since each respondent answered questions about more than one ballot measure. The central independent variable in each model is goal clarity, per my theory.
Study 1: Results
Above, I discuss how goal clarity is conceptually distinct from other ballot features that might determine citizens’ responses. Of course, even if there is a conceptual line to be drawn, it is important to establish that goal clarity is empirically distinguishable from these other factors. I begin by assessing whether goal clarity empirically separates enough to be considered as an independent predictor of how citizens respond to ballot measures.
Table 2.1 shows the distribution across clarity scores of four ballot measure-level control variables. The measures of word count and readability are evenly distributed across the
3Readability is measured by reverse coding the text’s Flesch–Kincaid grade level score, which is a com-monly accepted measure of the reading level required for comprehension. It is calculated as (0.39*(total words/total sentences) + 11.8*(total syllables/total words) - 15.59). Higher scores indicate the ballot mea-sure is easier to comprehend.
4Political sophistication is measured as each respondent’s ability trait score (θ), which is extracted from a three-parameter IRT model of 11 binary items about respondents’ political knowledge and participation: correct answers to four knowledge questions (length of term for a U.S. Senator; the purpose of Medicare; the relative amount of federal spending on foreign aid; and the party controlling the U.S. House); participation in six political activities (voting in the 2012 general election; signing an online petition; signing a paper petition; calling into a radio or TV program about a political issue; sending a social media message about a political issue; and writing to a newspaper or magazine about a political issue); and correctly identifying the Democratic Party as relatively liberal and the Republican Party as relatively conservative
three levels of goal clarity. Further, the goal clarity of ballot measures featuring a hard issue varies considerably, though measures with easy issues tend to also have clearer goals. Easy issues are often highly salient, focused on symbolic concerns, and long-standing features on the national political agenda (Ellis & Stimson 2012). Accordingly, it is more difficult to mask the underlying goal of an easy issue reform than a reform of a hard issue. All the same, Table 2.1 demonstrates that my goal clarity variable measures something different than these other measures of complexity.
Table 2.1: Distribution of ballot characteristics across clarity scores.
Clarity = 0 (unclear) Clarity = 0.5 Clarity = 1 (clear)
Easy issue 0 3 16
Hard issue 22 14 26
Readability above median 12 6 23
Readability below median 10 11 19
Word count above median 10 12 18
Word count below median 12 5 24
Liberal reform 2 3 21
Conservative reform 1 8 8
Neither liberal nor conservative 19 6 13
Turning to the hypotheses, the prediction in H1 is that voters will be more likely to vote on a ballot measure as its goals become clearer. Model 1 in Table 2.2 shows evidence in support of this hypothesis. The dependent variable is voting on a measure, instead of abstaining, and it is estimated as a logistic regression model with random effects for respondents.
The coefficient on the goal clarity variable, as expected, is positive and statistically significant, indicating that clearer goals increase the likelihood of voting. Substantively, a change in goal clarity from 0 to 1 increases the predicted probability of voting on a ballot measure by 3.6 percentage points.6 In line with expectations, respondents are also less
likely to vote on hard issues and are more likely to vote on measures as their own political sophistication and level of information about the measure increase. In contrast to claims from the literature, readability has no effect on likelihood of voting, and increasing the word