CAROLINA POPULATION CENTER | CAROLINA SQUARE - SUITE 210 | 123 WEST FRANKLIN STREET | CHAPEL HILL, NC 27516 Funding Acknowledgements: This report was funded by grant R01 HD073342 from the Eunice Kennedy Shriver National Institute of Child Health and Human Development (NICHD). Data for this study come from Add Health, a program project directed by Kathleen Mullan Harris and designed by J. Richard Udry, Peter S. Bearman, and Kathleen Mullan Harris at the University of North Carolina at Chapel Hill, and funded by grant P01-HD31921 from NICHD, with cooperative funding from 23 other federal agencies and foundations. Special acknowledgment is due Ronald R. Rindfuss and Barbara Entwisle for assistance in the original design. Information on how to obtain the Add Health data files is available on the Add Health website (http://www.cpc.unc.edu/addhealth). Additional support was received from the Population Research Training grant (T32 HD007168) and the Population Research Infrastructure Program (P2C HD050924) awarded to the Carolina Population Center at The University of North Carolina at Chapel Hill by NICHD.
Add Health Documentation
Polygenic Scores (PGSs) in the
National Longitudinal Study
of Adolescent to Adult Health
(Add Health) –
Release 1
Report prepared by
David B. Braudt
Kathleen Mullan Harris
Table of Contents
Overview ...4
Data ...5
Genome-wide Data ...5
Ancestry Specific Samples ...5
Methods ...7
Polygenic Scores ...7
Ancestry-specific Principal Components ...8
A Note on Raw PGSs ...8
Using Add Health PGSs ...9
Citing this Document and Data ...9
Polygenic Scores ... 12
Coronary Artery Disease ... 13
Myocardial Infarction ... 15
Plasma Cortisol ... 17
Low-density Lipoprotein (LDL) Cholesterol ... 19
High-density Lipoprotein (HDL) Cholesterol ... 21
Total Cholesterol ... 23
Triglycerides ... 25
Type II Diabetes (2012) ... 27
Type II Diabetes (2014) ... 29
Body Mass Index ... 31
Waist Circumference ... 33
Waist-to-Hip Ratio ... 35
Height ... 37
Menarche ... 39
Menopause ... 41
Number of Children Ever Born ... 43
Age at First Birth ... 45
Ever/Current Smoker ... 47
Number of Cigarettes per day ... 49
Extraversion ... 51
3
Attention-Deficit/Hyperactivity Disorder (2017) ... 55
Bipolar Disorder ... 57
Major Depressive Disorder (2013) ... 59
Major Depressive Disorder (2018) ... 61
Schizophrenia ... 63
Mental Health Cross Disorder ... 65
Alzheimer’s Disease ... 67
Educational Attainment (2016) ... 69
4
Overview
Research has shown that many outcomes of interest in the health, behavioral, and social sciences are influenced by genetics (Domingue et al. 2016; Plomin et al. 2016; Turkheimer 2000). For most human
traits/behaviors, commonly referred to as phenotypes, it appears that the genetic influence on the phenotype is highly polygenic; i.e., there is no single gene that can account for the association between genetic variance and the outcome. Instead, the influence of genetics on the phenotype appears to be due to many small associations across thousands, and possibly millions, of individual single-nucleotide polymorphisms (SNPs, pronounced snips) (Chabris et al. 2015). Polygenic Scores allow researchers to avoid the methodological complexities of including thousands, or millions, of covariates in their analyses by condensing, into a single measure, the associations between individual SNPs and the phenotype of interest (Plomin, Haworth, and Davis 2009).
Polygenic Scores (PGSs), sometimes referred to as polygenic risk scores or genetic risk scores, represent a general measure of the influence of additive genetics on a specific phenotype. The calculation of PGSs relies on summary statistics from genome-wide association studies (GWASs) to create a weighted sum of the associations between allele frequencies at individual SNPs and the associated phenotype. The estimated associations, i.e. beta-coefficients, for each SNP from a GWAS, conducted on a large independent sample, are multiplied by the allele frequencies of the same SNPs for individuals in the sample for which the PGS is being created. This process yields a hypothesis free measure of the cumulative additive genetic influences on the phenotype being studied. PGSs are hypothesis free because they aggregate the individual associations between SNPs and the phenotype, thus removing the possibility of investigating links between specific biological/genetic pathways and the phenotype. While the hypothesis free nature of PGSs dilutes the ability to detect biological pathways, it allows researchers to capture the broad influence of genetics in various analyses (Belsky and Israel 2014; Dudbridge 2016).
5
Data
Add Health is an ongoing nationally representative longitudinal study of adolescents in the U.S. who were in grades 7-12 in 1994-5. Wave I (1994-5, 79% response rate) included a sample of 80 high schools and 52 middle schools chosen from a stratified sample according to region, urbanicity, school size, school type, and racial and ethnic composition with probability of selection proportional to size. With five waves of data—Wave II (1996, 89% response rate), Wave III (2001-2, 77% response rate), Wave IV (2008, 80% response rate), and Wave V (2016-18, in the field)—and information on adolescents’ fellow students, school administrators, parents, siblings, friends, and romantic pairs, as well as extensive longitudinal geospatial data on neighborhood measures such as income, poverty, unemployment, the availability and use of health services, crime, religious membership, and social programs, Add Health represents one of the richest longitudinal studies of health and behavior in the U.S. available today. For more information on the Add Health study design see Harris (2013).
Genome-wide Data
As part of the Wave IV data collection, saliva samples were obtained from consenting participants (96% of Wave IV respondents). Approximately 12,200, or 80% of those participants, consented to long-term archiving and were consequently eligible for genome-wide genotyping. Genotyping was done on two Illumina platforms, with approximately 80% of the sample genotyping performed with the Illumina Omni1-Quad BeadChip and 20% genotyped with the Illumina Omni2.5-Quad BeadChip. After quality control procedures, genotyped data are available for 9,974 individuals (7,917 from the Omni1 chip and 2,057 from the Omni2 chip) on 609,130 SNPs common across both genotyping platforms (Highland, Heather M.; Avery, Christy L.; Duan, Qing; Li, Yun; Mullan Harris, Kathleen 2018). For more information on the genotyping and quality control procedures see the Add Health GWAS QC report online
at: http://www.cpc.unc.edu/projects/addhealth/documentation/guides/copy_of_AH_GWAS_QC.pdf.
Ancestry Specific Samples
To account for population stratification,1 we restrict the Add Health genotyped sample to four genetic ancestry groups: European ancestry, African ancestry, Hispanic ancestry, and East Asian ancestry. To identify
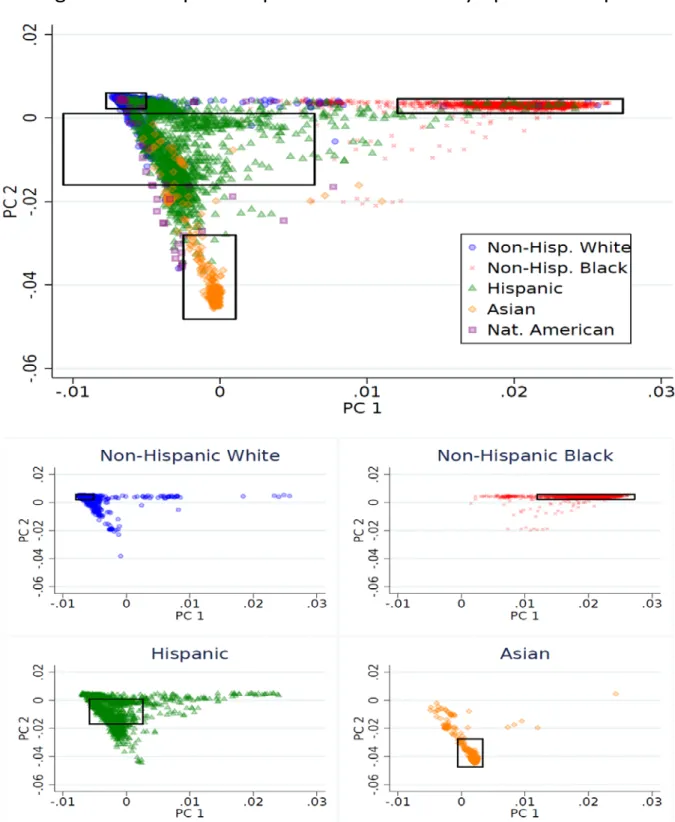
respondents in these four genetic ancestry groups we use principal component analysis on all unrelated members of the full Add Health genotyped sample and project those estimates onto the small remainder of related individuals. Figure 1 provides a visual depiction of this process with the respective cut-offs for inclusion in the genetic ancestry groups are represented by the black rectangles.
Each ancestry group is defined by distance from the mean of the first two principal components of the genetic data as shown in Figure 1. To be included in the Hispanic, East Asian, and European ancestry groups
1 Population stratification refers to differences in genetic variation between geographical ancestry groups. Due to the
6
Figure 1: Principal Components and Ancestry-Specific Samples
7 individuals must be within +/- 1 standard deviation of the mean of the first two principal components of the genetic data estimated from all individuals in the Add Health genome-wide data who self-identified as Hispanic, Asian, and non-Hispanic White respectively. To be included in the African ancestry group individuals must be within +/- 2 standard deviation of the mean of the first principal component and +/- 1 standard deviation of the mean of the second principal component estimated from all individuals in the genome-wide data who self-identified as non-Hispanic Black. While genetic ancestry and self-self-identified race/ethnicity are strongly
correlated (0.89), they are two separate constructs (see footnote 1). Consequently, not all individuals included in a given ancestry may self-identify or be socially-identified as the same race and/or ethnicity as other
members of their ancestry group. Table 1 provides a depiction of the resulting sample sizes for each genetic ancestry group and their correspondence to self-identified race/ethnicity.
As a sensitivity analysis, we repeated the above process using group specific medians of the first two principal components of the genetic data as centroids instead of group means. While sample sizes for the four ancestry groups using the median as the centroid were comparable to those using the means of the principal components as centroids, in all cases, using the mean as the centroid resulted in larger sample size. Given the slight increase in sample size, we define within Add Health genetic ancestry groups as distance from the mean of the first two principal components of the genotyped data.
Table 1: Add Health Polygenic Score Sample Sizes by Genetic Ancestry
AncestrySelf-Identified Race/Ethnicity European African East Asian Hispanic Total
Non-Hispanic White 5,644 5 0 105 5,754
Non-Hispanic Black 0 1,939 0 1 1,940
Native American 14 2 0 7 23
Asian 0 1 422 26 449
Hispanic 70 27 15 849 961
Missing 0 2 0 0 0
Total Sample Size 5,728 1,976 437 988 9,129
Methods
Polygenic Scores
We calculate polygenic scores (PGSs) following the procedure outlined in Dudbridge (2013). PGSs are a weighted sum of the regression coefficient for each SNP from an independent GWAS for each phenotype and allele frequencies for the same SNPs in the Add Health genome-wide data. For example, the raw PGS of educational attainment for an individual, 𝑖𝑖, is calculated as:
8 𝑃𝑃𝑃𝑃𝑃𝑃𝐸𝐸𝐸𝐸𝐸𝐸𝑖𝑖=� 𝛽𝛽𝑗𝑗𝑃𝑃𝑆𝑆𝑃𝑃𝑖𝑖𝑗𝑗
𝑘𝑘
𝑗𝑗=1
where, 𝑃𝑃𝑆𝑆𝑃𝑃𝑖𝑖𝑗𝑗 is the allele frequency of the 𝑗𝑗𝑡𝑡ℎ SNP for the 𝑖𝑖𝑡𝑡ℎ individual and 𝛽𝛽𝑗𝑗 is the estimated association between SNP 𝑗𝑗 and the number of years of education completed as reported in the GWAS summary statistics based on an independent sample (i.e. if a GWAS included Add Health, the GWAS is re-estimated excluding the Add Health sample and beta-weights from the re-estimated GWAS are used in Equation 1). To automate this process, we use a modified version of the PRSice wrapper for R within the PLINK software package (Chang et al. 2015). Once calculated, the raw PGSs are standardized (𝜇𝜇𝑃𝑃𝑃𝑃𝑃𝑃 = 0∧ 𝜎𝜎𝑃𝑃𝑃𝑃𝑃𝑃= 1) within ancestry groups. The standardization of PGSs within ancestry groups is done to account for between group population stratification. To control for within group population stratification, we recommend that researchers include at least the first five ancestry-specific principal components of the genome-wide data in all analyses using PGSs. It should be noted that these are imperfect controls, and PGSs should be re-calculated using GWAS weights for specific ancestry groups when such GWAS become available.
Ancestry-specific Principal Components
Ancestry-specific principal components are estimated following a similar procedure to the general principal components, with the sample restricted to individuals in the respective genetic ancestry groups. The process used starts with the genetic ancestry groups defined above, randomly removes one sibling of any sibling pairs in the data, estimates the first 20 principal components for all unrelated individuals in the ancestry specific sample, and then projects those principal components onto the small number of related individuals within each ancestry group.
A Note on Raw PGSs
We report a few descriptive statistics as well as density plots of the raw PGSs for each phenotype as calculated in Equation (1) above. While this information is presented for clarity and to ensure transparency, a few
comments must be made on comparing raw PGSs between phenotypes and/or datasets.
9 Similar to the above, comparing raw PGSs for two different traits, even if calculated from the same genome-wide sample, is not advised due to the fact that scores are dependent upon the weights from different GWASs. While there is considerable homogeneity between GWASs in how they are estimated, the type and number of controls, and method of meta-analysis, not all GWAS follow the same methodology, nor do they use the same sets of data. Consequently, it’s unclear what, if any, substantive meaning comparisons of raw PGSs for different phenotypes may have.
Using Add Health PGSs
Add Health is releasing PGSs for European, African, Hispanic, and East Asian genetic ancestry groups. However, researchers should be aware that PGSs for individuals not of the same ancestry group(s) as the GWAS from which summary statistics are retrieved may be less predictive (Martin et al. 2017; Ware et al. 2017). While there are several proposed explanations for this difference in predictive ability, one important reason is a lack of statistical power to account for population stratification between the ancestry group for which the PGS is calculated and the ancestry group(s) included in the GWAS. To help account for potential bias due to
population stratification and/or differences in genetic structure within ancestry groups we include the first ten ancestry-specific principal components of the genetic data with the PGSs. It is strongly recommended that researchers perform analyses separately by ancestral groups or, at the very least, include the first five ancestry-specific principal components as covariates in analyses using these PGSs (Price et al. 2006).
In order to minimize the risk of deductive disclosure, the order of the ancestry-specific principal components (PCS) of the genetic data are randomized in sets of five. Therefore, PCs must be included as sets: PC1-PC5, PC6-PC10, PC11-PC15, PC16-PC20 if any of the PCs of a set are included in analyses. For example, if a research wishes to include the first two ancestry-specific PCs as covariates in their analyses (i.e. PC1 and PC2) they must also include PC3-PC5.
Citing this Document and Data
Please include the following citation in any report, publication, and/or presentation based on the data in this release of the Add Health PGSs as well as the citation for the reference GWAS:
10
References
Belsky, Daniel W. and Salomon Israel. 2014. “Integrating Genetics and Social Science: Genetic Risk Scores.”
Biodemography and Social Biology 60(2):137–55.
Benjamin, Daniel J. et al. 2012. “The Promises and Pitfalls of Genoeconomics.” Annual Review of Economics
4(1):627–62.
Bolton, Jennifer L. et al. 2014. “Genome Wide Association Identifies Common Variants at the
SERPINA6/SERPINA1 Locus Influencing Plasma Cortisol and Corticosteroid Binding Globulin.” PLOS Genetics 10(7):e1004474.
Braudt, David B. forthcoming. “Sociogenomics in the 21st Century: An Introduction to the History and Potential of Genetically Informed Social Science.” Sociology Compass.
Chabris, Christopher F., James J. Lee, David Cesarini, Daniel J. Benjamin, and David I. Laibson. 2015. “The Fourth Law of Behavior Genetics.” Current Directions in Psychological Science 24(4):304–312.
Chang, Christopher C. et al. 2015. “Second-Generation PLINK: Rising to the Challenge of Larger and Richer Datasets.” GigaScience 4:7.
Conley, Dalton. 2016. “Socio-Genomic Research Using Genome-Wide Molecular Data.” Annual Review of Sociology 42(1):275–99.
Conley, Dalton and Jason Fletcher. 2017. The Genome Factor : What the Social Genomics Revolution Reveals
about Ourselves, Our History, and the Future. Princeton: Princeton University Press.
Domingue, Benjamin W. et al. 2016. “Genome-Wide Estimates of Heritability for Social Demographic Outcomes.” Biodemography and Social Biology 62(1):1–18.
Dudbridge, Frank. 2016. “Polygenic Epidemiology: Polygenic Epidemiology.” Genetic Epidemiology 40(4):268– 72.
Dudbridge, Frank. 2013. “Power and Predictive Accuracy of Polygenic Risk Scores” edited by N. R. Wray. PLoS Genetics 9(3):e1003348.
Harris, Kathleen Mullan. 2013. “The Add Health Study: Design and Accomplishments.” Chapel Hill: Carolina
Population Center, University of North Carolina at Chapel Hill.
Highland, Heather M.; Avery, Christy L.; Duan, Qing; Li, Yun; Mullan Harris, Kathleen. 2018. “Quality Control Analysis of Add Health GWAS Data.”
Martin, Alicia R. et al. 2017. “Human Demographic History Impacts Genetic Risk Prediction across Diverse Populations.” The American Journal of Human Genetics.
Omi, Michael and Howard |. Winant. 1994. Racial Formation in the United States : From the 1960s to the 1990s. 2nd ed. New York: Routledge.
11 Plomin, Robert, Claire MA Haworth, and Oliver SP Davis. 2009. “Common Disorders Are Quantitative Traits.”
Nature Reviews Genetics 10(12):872.
Price, Alkes L. et al. 2006. “Principal Components Analysis Corrects for Stratification in Genome-Wide Association Studies.” Nature Genetics 38(8):904–9.
Turkheimer, Eric. 2000. “Three Laws of Behavior Genetics and What They Mean.” Current Directions in Psychological Science 9(5):160–164.
12
Polygenic Scores
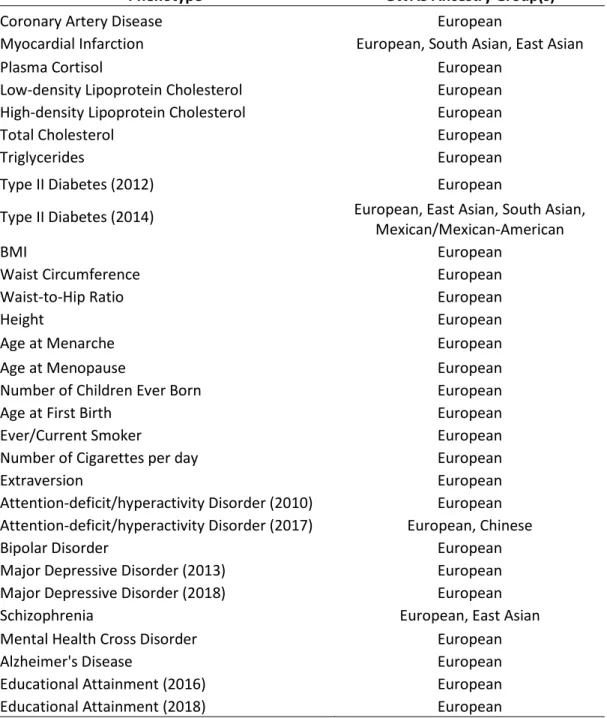
In the following section we provide descriptions of each polygenic score (PGS) as well as the source of the GWAS summary statistics. In Table 2 we provide a list of phenotypes for which Add Health is releasing PGSs along with the ancestry group(s) included in the discovery GWAS analyses. Please read the section entitled “Using Add Health PGSs” in the introductory portion of this document prior to conducting any analyses using the provided PGSs.
Table 2: PGS Phenotypes and Ancestry Groups included in the Respective GWAS
Phenotype GWAS Ancestry Group(s)
Coronary Artery Disease European
Myocardial Infarction European, South Asian, East Asian
Plasma Cortisol European
Low-density Lipoprotein Cholesterol European
High-density Lipoprotein Cholesterol European
Total Cholesterol European
Triglycerides European
Type II Diabetes (2012) European
Type II Diabetes (2014) European, East Asian, South Asian, Mexican/Mexican-American
BMI European
Waist Circumference European
Waist-to-Hip Ratio European
Height European
Age at Menarche European
Age at Menopause European
Number of Children Ever Born European
Age at First Birth European
Ever/Current Smoker European
Number of Cigarettes per day European
Extraversion European
Attention-deficit/hyperactivity Disorder (2010) European Attention-deficit/hyperactivity Disorder (2017) European, Chinese
Bipolar Disorder European
Major Depressive Disorder (2013) European
Major Depressive Disorder (2018) European
Schizophrenia European, East Asian
Mental Health Cross Disorder European
Alzheimer's Disease European
Educational Attainment (2016) European
13
Coronary Artery Disease
GWAS Summary Statistic Source: Schunkert, Heribert et al. 2011. “Large-Scale Association Analysis Identifies 13 New Susceptibility Loci for Coronary Artery Disease.” Nature Genetics 43(4):333–38.
GWAS Ancestry Group(s): European
The PGSs for coronary artery disease (CAD) were created using results from a 2011 study conducted by the Coronary ARtery DIsease Genome wide Replication and Meta-analysis (CARDIoGRAM) consortium. The GWAS meta-analysis files are publicly available and can be downloaded from: http://www.cardiogramplusc4d.org.
The coronary artery disease GWAS meta-analysis consisted of 14 studies with a total of 22,233 individuals with CAD (cases) and 64,762 without CAD (controls) of European descent imputed to the HapMap3 CEU panel. Replication was performed in a sample of 56,682 individuals (approximately half cases and half controls). Study-specific GWAS adjusted for age of onset of CAD (cases) or age of recruitment (controls), gender, and genetic principal components.
The Add Health PGSs for CAD are standardized (mean=0, standard deviation = 1) within ancestry groups to control for population stratification. To give researchers an idea of the underlying raw PGS, we present a few descriptive statistics and density plots for the unstandardized PGSs below. Please read the section entitled “Using Add Health PGSs” in the introductory portion of this document prior to conducting any analyses using the provided PGSs.
PGS Summary Statistics by Ancestry
Group N Min Max Median Mean SE (mean)
14
Coronary Artery Disease
European ancestry raw PGS distribution
Hispanic ancestry raw PGS distribution
African ancestry raw PGS distribution
15
Myocardial Infarction
GWAS Summary Statistic Source: Nikpay, Majid et al. 2015. “A Comprehensive 1,000 Genomes-Based Genome-Wide Association Meta-Analysis of Coronary Artery Disease.” Nature Genetics 47(10):1121–30.
GWAS Ancestry Group(s): European (77%), South Asian (13% - India and Pakistan), East Asian (6% - China and Korea), Hispanic and/or African American (4%).
The PGSs for myocardial infarction were created using 2015 results from a subgroup analysis of coronary artery disease conducted by the Coronary ARtery DIsease Genome wide Replication and Meta-analysis
(CARDIoGRAM) consortium. The GWAS meta-analysis files are publicly available and can be downloaded from: http://www.cardiogramplusc4d.org.
The GWAS is a meta-analysis of 48 studies of mainly European, South Asian, and East Asian, descent (as described above) imputed using the 1000 Genomes phase 1 v3 training set with 38 million variants. The study included 60,801 coronary artery disease cases and 123,504 controls. Case status was defined by an inclusive coronary artery disease diagnosis (for example, myocardial infarction, acute coronary syndrome, chronic stable angina or coronary stenosis of >50%). MI subgroup analysis was performed in cases with a reported history of MI (approximately 70% of the total number of cases).
The Add Health PGSs for myocardial infarction (MI) are standardized (mean=0, standard deviation = 1) within ancestry groups to control for population stratification. To give researchers an idea of the underlying raw PGS, we present a few descriptive statistics and density plots for the unstandardized PGSs below. Please read the section entitled “Using Add Health PGSs” in the introductory portion of this document prior to conducting any analyses using the provided PGSs.
PGS Summary Statistics by Ancestry
Group N Min Max Median Mean SE (mean)
16
Myocardial Infarction
European ancestry raw PGS distribution
Hispanic ancestry raw PGS distribution
African ancestry raw PGS distribution
17
Plasma Cortisol
GWAS Summary Statistic Source: Bolton, Jennifer L. et al. 2014. “Genome Wide Association Identifies Common Variants at the SERPINA6/SERPINA1 Locus Influencing Plasma Cortisol and Corticosteroid Binding Globulin.” PLOS Genetics 10(7):e1004474.
GWAS Ancestry Group(s): Western European
The PGSs for plasma cortisol were created using results from a 2014 GWAS conducted by the CORtisol NETwork (CORNET). The GWAS meta-analysis files are available through CORNET by request only.
The discovery phase of the meta-analysis included 12,597 participants aged 14-102 of western European descent from 11 studies. The replication sample consisted of 2,795 participants from three independent cohorts: Raine Study (n=797), ET2DS (n=1,069), and MrOS-Sweden (n=929) (Bolton et al. 2014:8). Analyses were adjusted for age and sex. Additional sensitivity analyses showed no difference when time of sampling was included as a covariate.
The Add Health PGSs for plasma cortisol (PI) are standardized (mean=0, standard deviation = 1) within ancestry groups to control for population stratification. To give researchers an idea of the underlying raw PGS, we present a few descriptive statistics and density plots for the unstandardized PGSs below. Please read the section entitled “Using Add Health PGSs” in the introductory portion of this document prior to conducting any analyses using the provided PGSs.
PGS Summary Statistics by Ancestry
Group N Min Max Median Mean SE (mean)
18
Plasma Cortisol
European ancestry raw PGS distribution
Hispanic ancestry raw PGS distribution
African ancestry raw PGS distribution
19
Low-density Lipoprotein (LDL) Cholesterol
GWAS Summary Statistic Source: Willer, Cristen J. et al. 2013. “Discovery and Refinement of Loci Associated with Lipid Levels.” Nature Genetics 45(11):1274–83.
GWAS Ancestry Group(s): European
The PGSs for low-density lipoprotein cholesterol (LDL) were created using results from a 2013 GWAS conducted by the Global Lipids Genetics Consortium (GLGC). The GWAS meta-analysis files are publically available
from: http://csg.sph.umich.edu/willer/public/lipids2013/.
The discovery phase of the meta-analysis included 188,577 individuals of European ancestry from 45 studies, while the replication sample consisted of 7,898 individuals of non-European descent. Lipid levels were
measured after eight or more hours of fasting with individuals taking lipid lowering medication excluded from the study. Study-specific GWAS adjusted for age, age-squared, sex, and genetic principal components.
The Add Health PGSs for LDL are standardized (mean=0, standard deviation = 1) within ancestry groups to control for population stratification. To give researchers an idea of the underlying raw PGS, we present a few descriptive statistics and density plots for the unstandardized PGSs below. Please read the section entitled “Using Add Health PGSs” in the introductory portion of this document prior to conducting any analyses using the provided PGSs.
PGS Summary Statistics by Ancestry
Group N Min Max Median Mean SE (mean)
20
Low-density Lipoprotein Cholesterol (LDL)
European ancestry raw PGS distribution
Hispanic ancestry raw PGS distribution
African ancestry raw PGS distribution
21
High-density Lipoprotein (HDL) Cholesterol
GWAS Summary Statistic Source: Willer, Cristen J. et al. 2013. “Discovery and Refinement of Loci Associated with Lipid Levels.” Nature Genetics 45(11):1274–83.
GWAS Ancestry Group(s): European
The PGSs for high-density lipoprotein cholesterol (HDL) were created using results from a 2013 GWAS conducted by the Global Lipids Genetics Consortium (GLGC). The GWAS meta-analysis files are publically available from: http://csg.sph.umich.edu/willer/public/lipids2013/.
The discovery phase of the meta-analysis included 188,577 individuals of European ancestry from 45 studies, while the replication sample consisted of 7,898 individuals of non-European descent. Lipid levels were
measured after eight or more hours of fasting with individuals taking lipid lowering medication excluded from the study. Study-specific GWAS adjusted for age, age-squared, sex, and genetic principal components.
The Add Health PGSs for HDL are standardized (mean=0, standard deviation = 1) within ancestry groups to control for population stratification. To give researchers an idea of the underlying raw PGS, we present a few descriptive statistics and density plots for the unstandardized PGSs below. Please read the section entitled “Using Add Health PGSs” in the introductory portion of this document prior to conducting any analyses using the provided PGSs.
PGS Summary Statistics by Ancestry
Group N Min Max Median Mean SE (mean)
22
High-density Lipoprotein Cholesterol (HDL)
European ancestry raw PGS distribution
Hispanic ancestry raw PGS distribution
African ancestry raw PGS distribution
23
Total Cholesterol
GWAS Summary Statistic Source: Willer, Cristen J. et al. 2013. “Discovery and Refinement of Loci Associated with Lipid Levels.” Nature Genetics 45(11):1274–83.
GWAS Ancestry Group(s): European
The PGSs for total cholesterol were created using results from a 2013 GWAS conducted by the Global Lipids Genetics Consortium (GLGC). The GWAS meta-analysis files are publically available
from: http://csg.sph.umich.edu/willer/public/lipids2013/.
The discovery phase of the meta-analysis included 188,577 individuals of European ancestry from 45 studies, while the replication sample consisted of 7,898 individuals of non-European descent. Lipid levels were
measured after eight or more hours of fasting with individuals taking lipid lowering medication excluded from the study. Study-specific GWAS adjusted for age, age-squared, sex, and genetic principal components.
The Add Health PGSs for total cholesterol (TC) are standardized (mean=0, standard deviation = 1) within ancestry groups to control for population stratification. To give researchers an idea of the underlying raw PGS, we present a few descriptive statistics and density plots for the unstandardized PGSs below. Please read the section entitled “Using Add Health PGSs” in the introductory portion of this document prior to conducting any analyses using the provided PGSs.
PGS Summary Statistics by Ancestry
Group N Min Max Median Mean SE (mean)
24
Total Cholesterol (TC)
European ancestry raw PGS distribution
Hispanic ancestry raw PGS distribution
African ancestry raw PGS distribution
25
Triglycerides
GWAS Summary Statistic Source: Willer, Cristen J. et al. 2013. “Discovery and Refinement of Loci Associated with Lipid Levels.” Nature Genetics 45(11):1274–83.
GWAS Ancestry Group(s): European
The PGSs for triglycerides were created using results from a 2013 GWAS conducted by the Global Lipids Genetics Consortium (GLGC). The GWAS meta-analysis files are publically available and can be downloaded from: http://csg.sph.umich.edu/willer/public/lipids2013/.
The discovery phase of the meta-analysis included 188,577 individuals of European ancestry from 45 studies, while the replication sample consisted of 7,898 individuals of non-European descent. Lipid levels were
measured after eight or more hours of fasting with individuals taking lipid lowering medication excluded from the study. Study-specific GWAS adjusted for age, age-squared, sex, and genetic principal components.
The Add Health PGSs for triglycerides (TG) are standardized (mean=0, standard deviation = 1) within ancestry groups to control for population stratification. To give researchers an idea of the underlying raw PGS, we present a few descriptive statistics and density plots for the unstandardized PGSs below. Please read the section entitled “Using Add Health PGSs” in the introductory portion of this document prior to conducting any analyses using the provided PGSs.
PGS Summary Statistics by Ancestry
Group N Min Max Median Mean SE (mean)
26
Triglycerides (TG)
European ancestry raw PGS distribution
Hispanic ancestry raw PGS distribution
African ancestry raw PGS distribution
27
Type II Diabetes (2012)
GWAS Summary Statistic Source: Morris, Andrew P. et al. 2012. “Large-Scale Association Analysis Provides Insights into the Genetic Architecture and Pathophysiology of Type 2 Diabetes.” Nature Genetics 44(9):981–90.
GWAS Ancestry Group(s): European
The PGSs for Type II Diabetes 2012 were created using GWAS meta-analysis results from a 2012 study conducted by the DIAbetes Genetics Replication and Meta-analysis (DIAGRAM) Consortium. The GWAS meta-analysis files are available from: http://www.diagram-consortium.org/downloads.html.
The discovery meta-analysis consists of 12,171 T2D cases and 56,862 controls across 12 studies of populations of European descent. The replication meta-analysis consisted of 22,669 cases and 58,119 controls from studies of European populations and 1,178 cases and 2,472 controls from a study of Pakistani populations (Pakistan Risk of Myocardial Infarction Study). The authors note that they found little evidence of heterogeneity in SNP effects between European and Pakistani ancestry groups (p.981). Study-specific GWAS adjusted for age of onset (cases) or age of recruitment (controls), gender, and genetic principal components. Additionally, the results of each GWAS were corrected for residual population structure using the genomic control inflation factor, as reported in Supplementary Table 1 of Morris et al. (2012).
The Add Health PGSs for Type II Diabetes 2012 (T2D_2012) are standardized (mean=0, standard deviation = 1) within ancestry groups to control for population stratification. To give researchers an idea of the underlying raw PGS, we present a few descriptive statistics and density plots for the unstandardized PGSs below. Please read the section entitled “Using Add Health PGSs” in the introductory portion of this document prior to conducting any analyses using the provided PGSs.
PGS Summary Statistics by Ancestry
Group N Min Max Median Mean SE (mean)
28
Type II Diabetes 2012
European ancestry raw PGS distribution
Hispanic ancestry raw PGS distribution
African ancestry raw PGS distribution
29
Type II Diabetes (2014)
GWAS Summary Statistic Source: Mahajan, Anubha et al. 2014. “Genome-Wide Trans-Ancestry Meta-Analysis Provides Insight into the Genetic Architecture of Type 2 Diabetes Susceptibility.” Nature Genetics 46(3):234–44.
GWAS Ancestry Group(s): European (Ncase = 12,171, Ncontrol = 56,862), East Asian (Ncase = 6,952, Ncontrol = 11,865), South Asian (Ncase = 5,561, Ncontrol = 14,458), Mexican/Mexican American (Ncase = 1,804, Ncontrol = 779).
The PGSs for Type II Diabetes 2014 were created using GWAS meta-analysis results from a 2014 study
conducted by the DIAbetes Genetics Replication and Meta-analysis (DIAGRAM) Consortium, the Asian Genetic Epidemiology Network Type 2 Diabetes (AGEN-T2D) Consortium, the South Asian Type 2 Diabetes (SAT2D) Consortium, the Mexican American Type 2 Diabetes (MAT2D) Consortium, and the Type 2 Diabetes Genetic Exploration by Next-generation sequencing in multi-Ethnic Samples (T2D-GENES) Consortium. The GWAS meta-analysis files are publically available from: http://www.diagram-consortium.org/downloads.html.
The discovery meta-analysis consists of 26,488 T2D cases and 83,964 controls in populations of European, East Asian, south Asian, and Mexican and Mexican American descent as described above. The replication meta-analysis consisted of 21,491 cases and 55,647 controls in populations of European descent. Study-specific GWAS adjustments varied, but largely included: age, sex, and cohort.
The Add Health PGSs for Type II Diabetes 2014 (T2D_2014) are standardized (mean=0, standard deviation = 1) within ancestry groups to control for population stratification. To give researchers an idea of the underlying raw PGS, we present a few descriptive statistics and density plots for the unstandardized PGSs below. Please read the section entitled “Using Add Health PGSs” in the introductory portion of this document prior to conducting any analyses using the provided PGSs.
PGS Summary Statistics by Ancestry
Group N Min Max Median Mean SE (mean)
30
Type II Diabetes 2014
European ancestry raw PGS distribution
Hispanic ancestry raw PGS distribution
African ancestry raw PGS distribution
31
Body Mass Index
GWAS Summary Statistic Source: Locke, Adam E. et al. 2015. “Genetic Studies of Body Mass Index Yield New Insights for Obesity Biology.” Nature 518(7538):197–206.
GWAS Ancestry Group(s): European
PGSs for body mass index BMI were created using results from a 2015 GWAS conducted by the Genetic
Investigation of ANthropometric Traits (GIANT) consortium. The GWAS meta-analysis files are publicly available from: http://portals.broadinstitute.org/collaboration/giant/index.php/GIANT_consortium_data_files.
Joint GWAS and Metabochip meta-analysis was performed on a sample of 332,206 (Ngwas = 234,069; Nmeta = 88,137) individuals of European descent from 114 studies. Additional covariates controlled for during the meta-analysis include: age, the second order polynomial of age, sex, and genetic principal components. The measures of BMI include clinical measurements as well as self-reported BMI.
The Add Health BMI are standardized (mean=0, standard deviation = 1) within ancestry groups to control for population stratification. To give researchers an idea of the underlying raw PGS, we present a few descriptive statistics and density plots for the unstandardized PGSs below. Please read the section entitled “Using Add Health PGSs” in the introductory portion of this document prior to conducting any analyses using the provided PGSs.
PGS Summary Statistics by Ancestry
Group N Min Max Median Mean SE (mean)
32
BMI
European ancestry raw PGS distribution
Hispanic ancestry raw PGS distribution
African ancestry raw PGS distribution
33
Waist Circumference
GWAS Summary Statistic Source:
Shungin, Dmitry et al. 2015. “New Genetic Loci Link Adipose and
Insulin Biology to Body Fat Distribution.”
Nature
518(7538):187–96.
GWAS Ancestry Group(s): European
PGSs for waist circumference were created using results from a 2015 study conducted by the Genetic
Investigation of ANthropometric Traits (GIANT) consortium. The GWAS meta-analysis files are publicly available from: http://portals.broadinstitute.org/collaboration/giant/index.php/GIANT_consortium_data_files.
A GWAS meta-analysis was performed on a sample of 142,762 individuals of European descent from 57 studies, and separately in a Metabochip (MC) meta-analysis on a sample of 67,326 individuals of European descent from 44 studies. A joint GWAS and MC meta-analysis was then conducted on 210,088 individuals of European descent. Additional covariates in both GWAS and MC analyses included: age, the second order polynomial of age, study-specific covariates as necessary, and BMI.
The Add Health PGSs for waist circumference (WC)are standardized (mean=0, standard deviation = 1) within ancestry groups to control for population stratification. To give researchers an idea of the underlying raw PGS, we present a few descriptive statistics and density plots for the unstandardized PGSs below. Please read the section entitled “Using Add Health PGSs” in the introductory portion of this document prior to conducting any analyses using the provided PGSs.
PGS Summary Statistics by Ancestry
Group N Min Max Median Mean SE (mean)
34
Waist Circumference
European ancestry raw PGS distribution
Hispanic ancestry raw PGS distribution
African ancestry raw PGS distribution
35
Waist-to-Hip Ratio
GWAS Summary Statistic Source:
Shungin, Dmitry et al. 2015. “New Genetic Loci Link Adipose and
Insulin Biology to Body Fat Distribution.”
Nature
518(7538):187–96.
GWAS Ancestry Group(s): European
PGSs for waist-to-hip ratio were created using results from a 2015 study conducted by the Genetic
Investigation of ANthropometric Traits (GIANT) consortium. The GWAS meta-analysis files are publicly available from: http://portals.broadinstitute.org/collaboration/giant/index.php/GIANT_consortium_data_files.
GWAS meta-analysis was performed on a sample of 142,762 individuals of European descent from 57 studies, and separately in a Metabochip (MC) meta-analysis on a sample of 67,326 individuals of European descent from 44 studies. A joint GWAS and MC meta-analysis was then conducted on 210,088 individuals of European descent. Additional covariates in both GWAS and MC analyses included: age, the second order polynomial of age, study-specific covariates as necessary, and BMI.
The Add Health PGSs for waist-to-hip ratio (WHR) are standardized (mean=0, standard deviation = 1) within ancestry groups to control for population stratification. To give researchers an idea of the underlying raw PGS, we present a few descriptive statistics and density plots for the unstandardized PGSs below. Please read the section entitled “Using Add Health PGSs” in the introductory portion of this document prior to conducting any analyses using the provided PGSs.
PGS Summary Statistics by Ancestry
Group N Min Max Median Mean SE (mean)
36
Waist-to-Hip Ratio
European ancestry raw PGS distribution
Hispanic ancestry raw PGS distribution
African ancestry raw PGS distribution
37
Height
GWAS Summary Statistic Source: Wood, Andrew R. et al. 2014. “Defining the Role of Common Variation in the Genomic and Biological Architecture of Adult Human Height.” Nature Genetics 46(11):1173–86.
GWAS Ancestry Group(s): European
PGSs for height were created using results from a 2014 study conducted by the Genetic Investigation of ANthropometric Traits (GIANT) consortium. The GWAS meta-analysis files are publicly available
from: http://portals.broadinstitute.org/collaboration/giant/index.php/GIANT_consortium_data_files.
The meta-analysis included 253,288 individuals of European descent from 79 studies imputed to HapMap II. Replication was performed in a sample of 80,067 individuals of European descent. Height was measured as sex standardized height. Additional covariates in GWAS analyses included age and genetic principal components.
The Add Health PGSs for height are standardized (mean=0, standard deviation = 1) within ancestry groups to control for population stratification. To give researchers an idea of the underlying raw PGS, we present a few descriptive statistics and density plots for the unstandardized PGSs below. Please read the section entitled “Using Add Health PGSs” in the introductory portion of this document prior to conducting any analyses using the provided PGSs.
PGS Summary Statistics by Ancestry
Group N Min Max Median Mean SE (mean)
38
Height
European ancestry raw PGS distribution
Hispanic ancestry raw PGS distribution
African ancestry raw PGS distribution
39
Menarche
GWAS Summary Statistic Source: Perry, John R. B. et al. 2014. “Parent-of-Origin-Specific Allelic Associations among 106 Genomic Loci for Age at Menarche.” Nature 514(7520):92–97.
GWAS Ancestry Group(s): European
PGSs for age at menarche were created using results from a 2014 study conducted by the Reproductive Genetics (ReproGen) consortium. The GWAS meta-analysis files are publicly available
from: http://www.reprogen.org/data_download.html.
The discovery meta-analysis included 132,989 women of European descent from 58 studies. Women who reported their age at menarche as less than 9 years or greater than 17 years old were excluded from the analysis. Analyses adjusted for birth year in order to account for secular trends in menarche timing, study-specific genomic control inflation factors, and relatedness between individuals when necessary.
The Add Health PGSs for age at menarche are standardized (mean=0, standard deviation = 1) within ancestry groups to control for population stratification. To give researchers an idea of the underlying raw PGS, we present a few descriptive statistics and density plots for the unstandardized PGSs below. Please read the section entitled “Using Add Health PGSs” in the introductory portion of this document prior to conducting any analyses using the provided PGSs.
PGS Summary Statistics by Ancestry
Group N Min Max Median Mean SE (mean)
40
Menarche
European ancestry raw PGS distribution
Hispanic ancestry raw PGS distribution
African ancestry raw PGS distribution
41
Menopause
GWAS Summary Statistic Source: Day, Felix R. et al. 2015. “Large-Scale Genomic Analyses Link Reproductive Aging to Hypothalamic Signaling, Breast Cancer Susceptibility and BRCA1-Mediated DNA Repair.” Nature Genetics 47(11):1294–1303.
GWAS Ancestry Group(s): European
PGSs for age at menarche were created using results from a 2014 study conducted by the Reproductive Genetics (ReproGen) consortium. The GWAS meta-analysis files are publicly available
from: http://www.reprogen.org/data_download.html.
The ReproGen meta-analysis included 69,360 women of European descent from 50 studies imputed to HapMap Phase 2. GWAS analyses included study specific controls and the top principal components of the genetic data. In all studies, age at naturally occurring menopause is self-reported. Age at menopause is defined as the age at last occurring menstrual period followed by 12 consecutive months of amenorrhea.
The Add Health PGSs for age at menopause are standardized (mean=0, standard deviation = 1) within ancestry groups to control for population stratification. To give researchers an idea of the underlying raw PGS, we present a few descriptive statistics and density plots for the unstandardized PGSs below. Please read the section entitled “Using Add Health PGSs” in the introductory portion of this document prior to conducting any analyses using the provided PGSs.
PGS Summary Statistics by Ancestry
Group N Min Max Median Mean SE (mean)
42
Menopause
European ancestry raw PGS distribution
Hispanic ancestry raw PGS distribution
African ancestry raw PGS distribution
43
Number of Children Ever Born
GWAS Summary Statistic Source: Barban, Nicola et al. 2016. “Genome-Wide Analysis Identifies 12 Loci Influencing Human Reproductive Behavior.” Nature Genetics 48(12):1462–72.
GWAS Ancestry Group(s): European
PGSs for the number of children ever born were created using pooled results for men and women from a 2016 study conducted as part of the Sociogenome project (http://www.sociogenome.com/). The GWAS meta-analysis files are publicly available
from: ftp://ftp.ebi.ac.uk/pub/databases/gwas/summary_statistics/BarbanN_27798627_GCST003796.
The meta-analysis included 343,072 individuals of European descent above age 44 for women and 54 for men from 62 studies. Additional covariates include age, the second order polynomial of age, the third order polynomial of age, and genetic principal components.
The Add Health PGSs for number of children ever born (NEB) are standardized (mean=0, standard deviation = 1) within ancestry groups to control for population stratification. To give researchers an idea of the underlying raw PGS, we present a few descriptive statistics and density plots for the unstandardized PGSs below. Please read the section entitled “Using Add Health PGSs” in the introductory portion of this document prior to conducting any analyses using the provided PGSs.
PGS Summary Statistics by Ancestry
Group N Min Max Median Mean SE (mean)
44
Number of Children Ever Born
European ancestry raw PGS distribution
Hispanic ancestry raw PGS distribution
African ancestry raw PGS distribution
45
Age at First Birth
GWAS Summary Statistic Source: Barban, Nicola et al. 2016. “Genome-Wide Analysis Identifies 12 Loci Influencing Human Reproductive Behavior.” Nature Genetics 48(12):1462–72.
GWAS Ancestry Group(s): European
PGSs for the age at first birth were created using pooled results for men and women from a 2016 study
conducted as part of the Sociogenome project (http://www.sociogenome.com/). The GWAS meta-analysis files are publicly available
from: ftp://ftp.ebi.ac.uk/pub/databases/gwas/summary_statistics/BarbanN_27798627_GCST003795.
The meta-analysis included 251,151 individuals of European descent who had a biological child at the time of interview from 62 studies. Additional covariates include age, the second order polynomial of age, the third order polynomial of age, and genetic principal components.
The Add Health PGSs for age at first birth (AFB) are standardized (mean=0, standard deviation = 1) within ancestry groups to control for population stratification. To give researchers an idea of the underlying raw PGS, we present a few descriptive statistics and density plots for the unstandardized PGSs below. Please read the section entitled “Using Add Health PGSs” in the introductory portion of this document prior to conducting any analyses using the provided PGSs.
PGS Summary Statistics by Ancestry
Group N Min Max Median Mean SE (mean)
46
Age at First Birth
European ancestry raw PGS distribution
Hispanic ancestry raw PGS distribution
African ancestry raw PGS distribution
47
Ever/Current Smoker
GWAS Summary Statistic Source: Furberg, Helena et al. 2010. “Genome-Wide Meta-Analyses Identify Multiple Loci Associated with Smoking Behavior.” Nature Genetics 42(5):441–47.
GWAS Ancestry Group(s): European
The PGSs for current/ever smoker were created using results from a 2010 GWAS conducted by the Tobacco and Genetics (TAG) Consortium. The GWAS meta-analysis files are publicly available
from: https://www.med.unc.edu/pgc/results-and-downloads.
The discovery phase of analysis included 74,053 individuals of European descent. The replication of the 15 most significant genetic regions included 143,023 individuals. Individuals who were recorded as having ever been regular smokers were defined as those who reported having smoked at least 100 cigarettes during their lifetime, and never regular smokers were defined as those who reported having smoked between 0 and 99 cigarettes during their lifetime. GWAS analyses controlled for imputed allele dosage for a SNP and if the individual was classified as a case in the primary study. If the primary study was case-control in design and the phenotype being studied was known to be associated with smoking, the GWAS adjusted for case status to reduce potential confounding. Analyses were run and meta-analyzed separately for males and females.
The Add Health current/ever smoker (Evrsmk) are standardized (mean=0, standard deviation = 1) within ancestry groups to control for population stratification, but to give researchers an idea of the underlying raw PGS, we present a few descriptive statistics and density plots for the unstandardized PGSs below. Please read the section entitled “Using Add Health PGSs” in the introductory portion of this document prior to
conducting any analyses using the provided PGSs.
PGS Summary Statistics by Ancestry
Group N Min Max Median Mean SE (mean)
48
Ever/Current Smoker
European ancestry raw PGS distribution
Hispanic ancestry raw PGS distribution
African ancestry raw PGS distribution
49
Number of Cigarettes per day
GWAS Summary Statistic Source: Furberg, Helena et al. 2010. “Genome-Wide Meta-Analyses Identify Multiple Loci Associated with Smoking Behavior.” Nature Genetics 42(5):441–47.
GWAS Ancestry Group(s): European
The PGSs for the number of cigarettes smoked per day were created using results from a 2010 GWAS
conducted by the Tobacco and Genetics (TAG) Consortium. The GWAS meta-analysis files are publicly available from: https://www.med.unc.edu/pgc/results-and-downloads.
The discovery phase of analysis included 74,053 individuals of European descent. The replication of the 15 most significant genetic regions included 143,023 individuals. The number of cigarettes smoked per day was
reported as either the average number of cigarettes smoked per day or the maximum number of cigarettes smoked in a single day (see the online methods). GWAS analyses controlled for imputed allele dosage for a SNP and if the individual was classified as a case in the primary study. If the primary study was case-control in design and the phenotype being studied was known to be associated with smoking, the GWAS adjusted for case status to reduce potential confounding. Analyses were run and meta-analyzed separately for males and females.
The Add Health cigarettes smoked per day (CPD)are standardized (mean=0, standard deviation = 1) within ancestry groups to control for population stratification, but to give researchers an idea of the underlying raw PGS, we present a few descriptive statistics and density plots for the unstandardized PGSs below. Please read the section entitled “Using Add Health PGSs” in the introductory portion of this document prior to
conducting any analyses using the provided PGSs.
PGS Summary Statistics by Ancestry
Group N Min Max Median Mean SE (mean)
50
Number of Cigarettes per Day
European ancestry raw PGS distribution
Hispanic ancestry raw PGS distribution
African ancestry raw PGS distribution
51
Extraversion
GWAS Summary Statistic Source: van den Berg, Stéphanie M. et al. 2016. “Meta-Analysis of Genome-Wide Association Studies for Extraversion: Findings from the Genetics of Personality Consortium.” Behavior Genetics 46(2):170–82.
GWAS Ancestry Group(s): European
The PGSs for extraversion were created using results from a 2016 study by the Genetics of Personality Consortium (GPC). Summary statistics are publicly available from: www.tweelingenregister.org/GPC/.
The discovery meta-analysis included 63,030 individuals of European descent from 29 cohorts. The replication analysis consisted of 9,783 individuals, also of European descent, from a single cohort. All cohorts imputed SNPs based on the 1000 genomes reference panel (1000G). Additional study-specific covariates included sex, age, and ancestry principal components of the genetic data. Extraversion was measured as a continuous latent variable as described in van den Berg et al. (2014).
The Add Health PGSs for Extraversion are standardized (mean=0, standard deviation = 1) within ancestry groups to control for population stratification. To give researchers an idea of the underlying raw PGS, we present a few descriptive statistics and density plots for the unstandardized PGSs below. Please read the section entitled “Using Add Health PGSs” in the introductory portion of this document prior to conducting any analyses using the provided PGSs.
PGS Summary Statistics by Ancestry
Group N Min Max Median Mean SE (mean)
European ancestry 5728 -43.87 30.38 -12.37 -12.27 0.12 African ancestry 1976 -42.10 7.68 -17.30 -17.53 0.16 Hispanic ancestry 988 -54.19 8.11 -23.29 -23.16 0.33 Asian ancestry 437 -59.13 -16.55 -38.94 -39.22 0.39
References:
52
Extraversion
European ancestry raw PGS distribution
Hispanic ancestry raw PGS distribution
African ancestry raw PGS distribution
53
Attention-Deficit/Hyperactivity Disorder (2010)
GWAS Summary Statistic Source: Neale, Benjamin M. et al. 2010. “Meta-Analysis of Genome-Wide Association Studies of Attention-Deficit/Hyperactivity Disorder.” Journal of the American Academy of Child & Adolescent Psychiatry 49(9):884–97.
GWAS Ancestry Group(s): European
The PGSs for attention-deficit/hyperactivity disorder 2010 were created using results from a 2010 GWAS conducted by the ADHD subgroup of the Psychiatric GWAS Consortium. The GWAS meta-analysis files are publicly available from: http://www.med.unc.edu/pgc/results-and-downloads (pgc.adhd.full.2012-10.txt).
The meta-analysis included 2,064 trios, 896 cases, and 2,455 controls from four projects: (1) the Children’s Hospital of Philadelphia (CHOP), (2) phase I of the International Multisite ADHD Genetics Project (IMAGE), (3) phase II of IMAGE (IMAGE II), and (4) the Pfizer funded study from the University of California, Los Angeles, Washington University, and the Massachusetts General Hospital (PUWMa). Measures of attention deficit disorder were harmonized across samples and were based on a combination of semi-structured interviews and parent and/or teacher report on questionnaires (see Neale et al., p. 3-5, 2010).
The Add Health PGSs for attention-deficit/hyperactivity disorder 2010 (ADHD_2010) are standardized (mean=0, standard deviation = 1) within ancestry groups to control for population stratification. To give researchers an idea of the underlying raw PGS, we present a few descriptive statistics and density plots for the unstandardized PGSs below. Please read the section entitled “Using Add Health PGSs” in the introductory portion of this document prior to conducting any analyses using the provided PGSs.
PGS Summary Statistics by Ancestry
Group N Min Max Median Mean SE (mean)
54
Attention Deficit Disorder 2010
European ancestry raw PGS distribution
Hispanic ancestry raw PGS distribution
African ancestry raw PGS distribution
55
Attention-Deficit/Hyperactivity Disorder (2017)
GWAS Summary Statistic Source: Demontis, Ditte et al. 2017. “Discovery Of The First Genome-Wide Significant Risk Loci For ADHD.” BioRxiv 145581.
(This is a pre-print version of the study which is currently in press. http://orca.cf.ac.uk/110923/)
GWAS Ancestry Group(s): European (Ncases = 19,099; Ncontrols = 34,194), Han Chinese (Ncases = 1,040; Ncontrol = 963); Multi-ethnic (PUWMa sample with N = 78)
The PGSs for attention-deficit/hyperactivity disorder 2017 PGSs were created using results from a 2017 BioRxiv preprint from the Lundbeck Foundation Initiative for Integrative Psychiatric Research (iPSYCH) and Psychiatric Genetics Consortium (PGC). The GWAS meta-analysis files are publicly available
from: http://www.med.unc.edu/pgc/results-and-downloads (Download ADHD GWAS - June 2017).
The discovery meta-analysis included 55,374 individuals (20,183 cases and 35,191 controls) from 12 studies of mixed ancestry while the replication sample included 93,916 individuals from two cohorts of multiple ancestry groups. Additional covariates included study specific controls and genetic ancestry principal components.
The Add Health PGSs for attention-deficit/hyperactivity disorder 2017 (ADHD_2017) are standardized (mean=0, standard deviation = 1) within ancestry groups to control for population stratification. To give researchers an idea of the underlying raw PGS, we present a few descriptive statistics and density plots for the unstandardized PGSs below. Please read the section entitled “Using Add Health PGSs” in the introductory portion of this document prior to conducting any analyses using the provided PGSs.
PGS Summary Statistics by Ancestry
Group N Min Max Median Mean SE (mean)
56
Attention Deficit Disorder 2017
European ancestry raw PGS distribution
Hispanic ancestry raw PGS distribution
African ancestry raw PGS distribution
57
Bipolar Disorder
GWAS Summary Statistic Source: Psychiatric GWAS Consortium Bipolar Disorder Working Group. 2011. “Large-Scale Genome-Wide Association Analysis of Bipolar Disorder Identifies a New Susceptibility Locus near ODZ4.” Nature Genetics 43(10):977–83.
GWAS Ancestry Group(s): European
The PGSs for bipolar disorder were created using results from a 2011 GWAS conducted by the Bipolar Disorder working group of the Psychiatric GWAS Consortium. The GWAS meta-analysis files are publicly available from: http://www.med.unc.edu/pgc/results-and-downloads (pgc.bip.2012-04.zip).
The discovery phase of the meta-analysis included 7,481 cases and 9,250 controls. The replication phase of the 34 most significant genetic regions identified in the discovery phase was conducted in a sample of 4,496 cases and 42,422 controls. Samples were drawn from 11 studies (see Table 1 and supplemental materials, from the original publication). All analyses adjusted for the top five principal components of the genetic data and study fixed effects. Bipolar disorder was measured as diagnoses of either: bipolar disorder type 1, bipolar disorder type 2, schizoaffective disorder bipolar, and a few cases with other bipolar diagnoses (p. 997).
The Add Health PGSs for bipolar disorder (BP) are standardized (mean=0, standard deviation = 1) within ancestry groups to control for population stratification, but to give researchers an idea of the underlying raw PGS, we present a few descriptive statistics and density plots for the unstandardized PGSs below. Please read the section entitled “Using Add Health PGSs” in the introductory portion of this document prior to
conducting any analyses using the provided PGSs.
PGS Summary Statistics by Ancestry
Group N Min Max Median Mean SE (mean)
58
Bipolar Disorder
European ancestry raw PGS distribution
Hispanic ancestry raw PGS distribution
African ancestry raw PGS distribution
59
Major Depressive Disorder (2013)
GWAS Summary Statistic Source: Ripke, Stephan et al. 2013. “A Mega-Analysis of Genome-Wide Association Studies for Major Depressive Disorder.” Molecular Psychiatry 18(4):497–511.
GWAS Ancestry Group(s): European
The PGSs for major depressive disorder 2013 were created using results from a 2013 GWAS conducted by the Major Depressive Disorder Working Group of the Psychiatric GWAS Consortium. The GWAS meta-analysis files are publicly available from: https://www.med.unc.edu/pgc/results-and-downloads.
The MDD GWAS combined meta-analysis included 9,240 cases and 9,519 controls (N=18,759). The replication sample consisted of 6,783 cases and 50,695 controls. Study level fixed effects and the first five genetic principal components were included as covariates. Analyses were also stratified by sex, recurrent MDD, recurrent early-onset MDD, age of early-onset, pre-pubertal early-onset MDD, and latent classes of MDD criteria.
The Add Health major depressive disorder 2013 (MDD_2013) are standardized (mean=0, standard deviation = 1) within ancestry groups to control for population stratification. To give researchers an idea of the underlying raw PGS, we present a few descriptive statistics and density plots for the unstandardized PGSs below. Please read the section entitled “Using Add Health PGSs” in the introductory portion of this document prior to conducting any analyses using the provided PGSs.
PGS Summary Statistics by Ancestry
Group N Min Max Median Mean SE (mean)
60
Major Depressive Disorder 2013
European ancestry raw PGS distribution
Hispanic ancestry raw PGS distribution
African ancestry raw PGS distribution
61
Major Depressive Disorder (2018)
GWAS Summary Statistic Source: Wray, Naomi R. et al. 2018. “Genome-Wide Association Analyses Identify 44 Risk Variants and Refine the Genetic Architecture of Major Depression.” Nature Genetics 50(5):668–81.
GWAS Ancestry Group(s): European
The PGSs for major depressive disorder 2018 were created using results from a 2018 GWAS conducted by the Major Depressive Disorder Working Group of the Psychiatric GWAS Consortium. The GWAS meta-analysis files are publicly available from: https://www.med.unc.edu/pgc/results-and-downloads.
The MDD 2018 GWAS combined meta-analysis included 135,458 cases and 344,901 controls (N = 480,359) from 35 studies of individuals of European descent. Due to data sharing restrictions from 23andMe, the PGSs are based on summary statistics that exclude the 23andMe cohort (Ncase = 75,607; Ncontrols = 231,747). MDD is cases are based on meeting standard criteria for major depressive disorder.
The Add Health PGSs for major depressive disorder 2018 (MDD_2018) are standardized (mean=0, standard deviation = 1) within ancestry groups to control for population stratification. To give researchers an idea of the underlying raw PGS, we present a few descriptive statistics and density plots for the unstandardized PGSs below. Please read the section entitled “Using Add Health PGSs” in the introductory portion of this document prior to conducting any analyses using the provided PGSs.
PGS Summary Statistics by Ancestry
Group N Min Max Median Mean SE (mean)
62
Major Depressive Disorder 2018
European ancestry raw PGS distribution
Hispanic ancestry raw PGS distribution
African ancestry raw PGS distribution
63
Schizophrenia
GWAS Summary Statistic Source: Ripke, Stephan et al. 2014. “Biological Insights from 108 Schizophrenia-Associated Genetic Loci.” Nature 511(7510):421–27.
GWAS Ancestry Group(s): European and East Asian [Japan, Singapore, Hong Kong and Sichuan China] (Ncases = 1,866; Ncontrols = 3,418)
The PGSs for schizophrenia were created using results from a 2014 GWAS conducted by the Schizophrenia Working Group of the Psychiatric Genomics Consortium (PGC). The GWAS meta-analysis files are publicly available from: https://www.med.unc.edu/pgc/results-and-downloads.
The schizophrenia GWAS combined meta-analysis included 36,989 cases and 113,075 controls (N=150,064) from individuals of European and East Asian descent. The replication sample consisted of 1,513 cases and 66,236 controls from individuals of European descent. To enable acquisition of large samples, some of the participating groups ascertained cases via clinician diagnosis rather than a research-based assessment. Genetic principal components and study fixed effects were included as covariates.
The Add Health schizophrenia (SCZ) are standardized (mean=0, standard deviation = 1) within ancestry groups to control for population stratification. To give researchers an idea of the underlying raw PGS, we present a few descriptive statistics and density plots for the unstandardized PGSs below. Please read the section entitled “Using Add Health PGSs” in the introductory portion of this document prior to conducting any analyses using the provided PGSs.
PGS Summary Statistics by Ancestry
Group N Min Max Median Mean SE (mean)
64
Schizophrenia
European ancestry raw PGS distribution
Hispanic ancestry raw PGS distribution
African ancestry raw PGS distribution
65
Mental Health Cross Disorder
GWAS Summary Statistic Source: Cross-Disorder Group of the Psychiatric Genomics Consortium. 2013. “Identification of Risk Loci with Shared Effects on Five Major Psychiatric Disorders: A Genome-Wide Analysis.” Lancet (London, England) 381(9875):1371–79.
GWAS Ancestry Group(s): European
The PGSs for mental health cross-disorder were created using results from a 2013 GWAS conducted by the Cross Disorder working group of the Psychiatric GWAS Consortium. The GWAS meta-analysis files are publicly available from: http://www.med.unc.edu/pgc/results-and-downloads (pgc.cross.full.2013-03.zip).
The discovery phase of the meta-analysis included 33,342 cases and 27,888 controls. Disorders that were counted as cases (DSM-III-R or DSM-IV criteria) included autism spectrum disorder,
attention-deficit/hyperactivity disorder, bipolar disorder, major depressive disorder, and schizophrenia.
The Add Health PGSs for mental health cross-disorder (XDIS) are standardized (mean=0, standard deviation = 1) within ancestry groups to control for population stratification. To give researchers an idea of the underlying raw PGS, we present a few descriptive statistics and density plots for the unstandardized PGSs below. Please read the section entitled “Using Add Health PGSs” in the introductory portion of this document prior to conducting any analyses using the provided PGSs.
PGS Summary Statistics by Ancestry
Group N Min Max Median Mean SE (mean)