Effect of ARRA Expiration on the Diet Quality of Low-Income Americans
Alice Olive Brower
Honors Thesis
Department of Economics
The University of North Carolina at Chapel Hill
April 2019
Approved by:
Effect of ARRA Expiration on the Diet
Quality of Low-Income Americans
Alice Olive Brower
Department of Economics, The University of North Carolina at Chapel Hill
Abstract
Food stamp benefits to low-income families were reduced in 2013, but little is known about the reduction’s impact on diet quality. To explore the mechanisms behind diet quality changes, this paper specifies the demand for sugar, saturated fat, encouraged and discouraged calories according to economic theory. Regression results indicate that diet quality is resistant to change, even when benefits are reduced which is consistent with other literature such as Waeher et al (2015). Results suggest that changing SNAP benefits alone will not significantly affect the diet quality of affected families.
Key words: SNAP, ARRA Expiration, Diet Quality, Nielsen Homescan
1
Introduction
Effects of ARRA Expiration on the Diet Quality of Low-Income Americans 2
determine health outcomes. Better understanding of the mechanisms behind these links is important for designing effective policy measures to combat obesity-related illnesses.
The research in this thesis examines the effect of an exogenous policy change on several aspects of nutritional intake. Specifically, it explores how the nutrition profiles of low-income households’ change when there is an exogenous decrease in monetary assistance for food though the federal Supplemental Nutrition Assistance Program (SNAP). The approach of this paper is twofold. First, the paper defines a theoretical model of the forward-looking dynamic decisions of households regarding dietary intake. The theoretical model is used to derive the determinants of household demand. Second, the structural demand equation is estimated using household panel data on quarterly food purchases in order to evaluate the effect of SNAP benefit changes. The theoretical model seeks to explain the observed diet profiles of individuals solving a constrained lifetime utility maximization problem. Theory suggests that optimal food consumption may be influenced by both simple and complex relationships. As an example of a simple relationship, high prices may dissuade consumption of particular food items such as fresh fruits and vegetables. As an example of a complex relationship, past consumption of sugary beverages may create addiction to sugar which may impact consumption decisions today. While there is more complexity in the theoretical model than can be tested in the empirical model, its presentation allows for a discussion of mechanisms behind the empirical relationships observed through regression analyses.
The empirical analysis uses commercially-available Nielson Homescan Data. This data set includes information on food purchases of households from 2000 to 2015, linked to food panel data that detail the exact calories and micro and macro nutrients of every food purchased. The research sample is limited to observations from 2010 to 2014 (a few years pre and post an exogenous SNAP benefit decrease in 2013). The exogenous change in monetary assistance allows us to identify the benefit elasticity of nutritional intake of participating households. More generally, this research seeks to quantify theoretically-relevant determinants of food consumption.
2
Literature Review
Effects of ARRA Expiration on the Diet Quality of Low-Income Americans 3
decade, some studies have found obesity rates leveling off and declining for some subsets of the domestic population (Ng, S. and Popkin, B., 2012). This deceleration may be the result of concerted efforts over the past 10 years to combat obesity and to discuss the role of sugar-sweetened beverages in health decline. The particular polices and mechanisms of this deceleration and the diet changes it implies, however, have yet to be elucidated.
Access to food and habit formation have been suggested as potential mechanisms driving inequality in diet profiles and relevant to diet change. First, contrary to common assumptions, research has found that limited access to healthy foods does not entirely explain differences in diet quality (Bronnenberg, Dubé and Genzkow, 2012). Hanbury et al. (2015) found that even if access were completely equal across households, two-thirds of existing disparities in diet quality would remain. Second, habit persistence may explain a household’s chosen diet. Bronnenberg, Dubé and Genzkow (2012) find that consumers’ willingness to pay for brands (as opposed to a generic or taste equivalent) is the result of past experiences. Quality of diet profiles may display a similar relationship and therefore be resistant to change. Existing research on these mechanisms suggests that changes to households’ diets are rare (Bronnenberg, Dubé and Genzkow, 2012; Nord M. and Prell, M., 2011), leaving open the question of the best mechanism to remedy obesity prevalence domestically.
2.1
ARRA and SNAP Benefit Research
The Supplemental Nutrition Assistance Program (SNAP) is the largest government program aiding qualified low-income households with food purchases in the United States. For an average family of five earning the maximum eligible income, SNAP benefits increase available income by 15 percent. In 2009, SNAP benefits were increased for every household through the American Recovery and Reinvestment Act (ARRA), which was implemented to provide temporary assistance to families adversely impacted by the recession. Post-ARRA implementation, Nord and Prell (2011) found that median SNAP benefits increased by 17 percent. This exogenous increase in benefits has been used as a natural experiment to study the prevalence of food insecurity by several authors (Nord, M. and Prell, M.; Waehrer, G., Deb, P., and Decker, S.L., 2015). These authors found a causal link between increases in SNAP benefits and households’ reliable ability to pay for adequate amounts of food. In 2013, ARRA expired, and SNAP benefits were reduced by 5.4 percent of the maximum benefit (Valizadeh and Smith, 2018).
Effects of ARRA Expiration on the Diet Quality of Low-Income Americans 4
expenditures (Waehrer et al., 2015). The authors found inconsistent evidence of the impact of such changes on diet quality, as measured using the 2005 Healthy Eating Index (Waehrer et al.., 2015). Using a sample containing all education levels, increases in SNAP benefits were not associated with changes in diet quality. However, for households with less than a high school education, diet quality declined by 9 percent at the 25th percentile of the index. Waehrer et al. (2015) suggest that increasing SNAP benefits did not consistently improve diet quality; instead, the policy reinforced existing food consumption habits, especially for households with poor diet quality.
2.2
Contribution to the Literature
This research contributes to the literature in two key ways. First, it applies a uniquely economic lens to questions that are usually addressed through a public health or epidemiological lens and contributes to the sparse literature on theoretical models of individual and household dietary demand.
Secondly, this research contributes to literature on the impacts of ARRA on diet quality, which has been addressed by only one other paper. It contributes to the body of literature by revisiting the questions of Waeher et al. (2015) with different data. Waehrer et al. (2015) used cross-sectional survey diet recall data to address the impact of ARRA on diet quality. Cross-sectional survey recall data are considered less reliable in food studies because respondents have a hard time recalling exactly what they ate sometime later and because it is hard to create reliable nutritional information from a list of foods eaten without knowing the exact food and brand. Without information on the nutritional content of foods, a full picture of nutrition from a diet cannot be ascertained. As these authors suggest, "longitudinal data on program participation and dietary intake would enable more precise estimates of the effects of increasing SNAP benefits on the dietary outcomes of program participants". Therefore, this paper uses Nielson Homescan data, to examine the impact of an exogenous decrease in benefits.
3
Theoretical and Empirical Motivation
Effects of ARRA Expiration on the Diet Quality of Low-Income Americans 5
Discussion of how the household aggregates the utility of family members is outside the scope of this model. In what follows, capital letters represent the household vector of individual consumption and characteristics, while lower case letters represent an individual within a given household.
Because food is necessary for survival and is an important determinant of health, the model focuses on the quantity and quality of food consumed. Health is relevant to individual decision making for several reasons. Individuals may value health because it impacts utility. They may also value health because it determines the amount of time available for various activities (e.g., employment, leisure, consumption). Lastly, health today may influence health next period; that is, health evolves and is a durable good. For these reasons, consumption of other health inputs that may be substitutes for or complements of food intake in health production is discussed.
For the individual, utility is gained from general consumption (𝑐𝑐𝑡𝑡 ), leisure
(𝑙𝑙𝑡𝑡) and food ( 𝑓𝑓𝑡𝑡), as well as medical care (𝑚𝑚𝑡𝑡) and “non-medical care, non-food”
health inputs ( 𝑛𝑛𝑡𝑡), which influence heath evolution.1 Many different food types
can be consumed. Consumed amounts of each food type 𝑗𝑗 = 1, … 𝐽𝐽 is denoted 𝑓𝑓𝑖𝑖𝑡𝑡𝑗𝑗. For expositional purposes, food is grouped into two categories “good” and “bad” (i.e., 𝑓𝑓𝑡𝑡𝑔𝑔 , 𝑓𝑓𝑡𝑡𝑏𝑏). Likewise, non-medical care non-food health inputs (𝑛𝑛𝑡𝑡𝑘𝑘, 𝑘𝑘 = 1 … 𝐾𝐾)
may be consumed and are grouped into two main categories “good” and “bad”.2 Per period utility of individual i is denoted
𝑢𝑢
𝑖𝑖𝑡𝑡= �𝑐𝑐
𝑡𝑡, 𝑓𝑓
𝑡𝑡𝑔𝑔, 𝑓𝑓
𝑡𝑡𝑏𝑏, 𝑚𝑚
𝑡𝑡, 𝑛𝑛
𝑡𝑡𝑔𝑔, 𝑛𝑛
𝑡𝑡𝑏𝑏𝑙𝑙
𝑡𝑡�ℎ
𝑡𝑡, 𝑥𝑥
𝑡𝑡, 𝐶𝐶
𝑡𝑡−1−), 𝑡𝑡 = 1, … , 𝑇𝑇
Preference shifters may alter the marginal utility of inputs. Observed heterogeneity includes health (ℎ𝑡𝑡), demographics (𝑥𝑥𝑡𝑡), and past consumption of
non-general goods. For notational simplicity this past consumption is denoted
𝐶𝐶𝑡𝑡−= �𝑓𝑓𝑡𝑡1, … , 𝑓𝑓𝑡𝑡𝐽𝐽, 𝑚𝑚𝑡𝑡, 𝑛𝑛𝑡𝑡1, … , 𝑛𝑛𝑡𝑡𝐾𝐾�∀𝑡𝑡. One’s history of consumption of food and
non-food, as well as medical care (𝑚𝑚𝑡𝑡), capture potential habituation or addiction.
I contend that food choice would display reinforcement, withdrawal and tolerance representative of other addictive goods, as outlined by Becker and Murphy (1988). Household utility is the sum of the utility of all individuals in the household, weighted by their relative importance. The weight of each household member is denoted 𝜃𝜃𝑖𝑖𝑡𝑡𝑖𝑖 which depends on individual characteristics (𝑥𝑥𝑡𝑡). Household utility is
1Individual subscripts are omitted, unless important for aggregating to the household level. 2An example of a good medical, food item might be exercise. An example of a bad
Effects of ARRA Expiration on the Diet Quality of Low-Income Americans 6
defined as 𝑈𝑈𝑡𝑡= ∑𝑆𝑆𝑖𝑖=1𝜃𝜃𝑖𝑖𝑡𝑡𝑢𝑢𝑖𝑖𝑡𝑡, where S is the total number of family members, or
household size. Amounts of utility input are constrained by a household budget constraint, which simply adds up the per person contributing income and expenditures. For individual i a representative budget constraint is
P𝑡𝑡𝑓𝑓𝑔𝑔𝑓𝑓𝑡𝑡𝑔𝑔+ P𝑡𝑡𝑓𝑓𝑏𝑏𝑓𝑓𝑡𝑡𝑏𝑏+ 𝑃𝑃𝑡𝑡𝑚𝑚 m𝑡𝑡+ P𝑡𝑡𝑛𝑛𝑔𝑔𝑛𝑛𝑡𝑡𝑔𝑔+ P𝑡𝑡𝑛𝑛𝑏𝑏𝑛𝑛𝑏𝑏𝑡𝑡 + 𝑐𝑐𝑡𝑡= 𝑤𝑤𝑡𝑡× 𝑒𝑒𝑡𝑡+ 𝑁𝑁𝑡𝑡+ 𝐵𝐵𝑡𝑡
where the price of general consumption is normalized to one. Total household income comes from hourly wages (𝑤𝑤𝑡𝑡) times the number of working hours (𝑒𝑒𝑡𝑡),
non-earned income (𝑁𝑁𝑡𝑡) and government benefits (𝐵𝐵𝑡𝑡). Wages are a function of
current health (ℎ𝑡𝑡), work experience (∑𝑡𝑡𝑡𝑡′=11[𝑒𝑒𝑡𝑡−1′ > 0]) and education (𝑒𝑒𝑒𝑒𝑢𝑢𝑐𝑐𝑡𝑡).
Each individual in a household is also time constrained by the total time (𝒥𝒥) that may be spent working (𝑒𝑒𝑡𝑡), relaxing (𝑙𝑙𝑡𝑡), doing good (𝑞𝑞𝑛𝑛𝑡𝑡𝑔𝑔) and bad (𝑞𝑞𝑛𝑛𝑡𝑡𝑏𝑏) things
for health, and preparing and consuming good (𝑞𝑞𝑓𝑓𝑡𝑡𝑔𝑔) and bad (𝑞𝑞𝑓𝑓
𝑡𝑡𝑏𝑏) food.
Therefore, the time constraint is
𝒥𝒥 = 𝑒𝑒𝑡𝑡+ 𝑙𝑙𝑡𝑡+ 𝑞𝑞𝑓𝑓𝑡𝑡𝑔𝑔𝑓𝑓𝑡𝑡𝑔𝑔+ 𝑞𝑞𝑓𝑓𝑡𝑡𝑏𝑏𝑓𝑓𝑡𝑡
𝑏𝑏+ 𝑞𝑞
𝑚𝑚𝑡𝑡𝑚𝑚𝑡𝑡+ 𝑞𝑞𝑛𝑛𝑡𝑡𝑔𝑔𝑛𝑛𝑡𝑡𝑔𝑔+ 𝑞𝑞𝑏𝑏𝑡𝑡𝑏𝑏𝑛𝑛𝑡𝑡
𝑏𝑏
where the vector 𝑞𝑞𝑡𝑡= [𝑞𝑞𝑓𝑓𝑡𝑡𝑔𝑔, 𝑞𝑞𝑓𝑓𝑡𝑡𝑏𝑏, 𝑞𝑞𝑚𝑚𝑡𝑡, 𝑞𝑞𝑛𝑛𝑡𝑡𝑔𝑔, 𝑞𝑞𝑛𝑛𝑡𝑡𝑏𝑏] represents time prices or the time
required for acquiring and consuming each good.
Current utility and wages depend on current health, which is known coming into period t. What is not known with certainty is future health, ℎ𝑡𝑡+1. Future health
depends on current health and medical care, food and non-medical non-food consumption in period t, as well as exogenous individual characteristics (𝑥𝑥𝑡𝑡). That
is, the health production function is
ℎ𝑡𝑡+1= ℎ�ℎ𝑡𝑡, 𝑚𝑚𝑡𝑡, 𝑓𝑓𝑡𝑡𝑔𝑔, 𝑓𝑓𝑡𝑡𝑏𝑏, 𝑛𝑛𝑡𝑡𝑔𝑔, 𝑛𝑛𝑡𝑡𝑏𝑏, 𝑥𝑥𝑡𝑡�
Because current behaviors, including food quality intake, impact future health and health impacts utility and wages, individuals solve a forward looking, dynamic optimization problem. Additionally, past consumption decisions may impact current utility.
Effects of ARRA Expiration on the Diet Quality of Low-Income Americans 7
(𝐻𝐻𝑡𝑡), food consumption last period (𝐹𝐹𝑡𝑡−1𝑔𝑔 , … , 𝐹𝐹𝑡𝑡−1𝑏𝑏 ), employment experience and
education (𝐸𝐸𝑡𝑡), demographics (𝑋𝑋𝑡𝑡), prices and time prices (𝑃𝑃𝑡𝑡). Specifically,
Ω𝑡𝑡= [𝐻𝐻𝑡𝑡, 𝐹𝐹𝑡𝑡−1𝑔𝑔 , 𝐹𝐹𝑡𝑡−1𝑏𝑏 , 𝐸𝐸𝑡𝑡, 𝑋𝑋𝑡𝑡, 𝑃𝑃𝑡𝑡].
That is, household demographics (𝑋𝑋𝑡𝑡) include the demographics of all individuals
in the household, denoted 𝑋𝑋𝑡𝑡= [𝑥𝑥1𝑡𝑡, … , 𝑥𝑥𝑆𝑆𝑡𝑡]. Similarly, 𝐻𝐻𝑡𝑡= [ℎ1𝑡𝑡, … , ℎ𝑆𝑆𝑡𝑡]. I let
health take on h increasingly-worse states such that ℎ𝑖𝑖𝑡𝑡= ℎ, ℎ = 0, … 𝐻𝐻�. I
indicate an individual’s behavior by the vector of employment and consumption variables, which may take on values of the alternatives available to him. Specifically, 𝑒𝑒𝑖𝑖𝑡𝑡= �𝑒𝑒𝑡𝑡, 𝑓𝑓𝑡𝑡𝑔𝑔, 𝑓𝑓𝑡𝑡𝑏𝑏, 𝑚𝑚𝑡𝑡, 𝑛𝑛𝑡𝑡𝑔𝑔, 𝑛𝑛𝑡𝑡𝑏𝑏�, ∀𝑡𝑡. The household’s behavior at time
t is denoted 𝐷𝐷𝑡𝑡= [𝑒𝑒1𝑡𝑡, … , 𝑒𝑒𝑆𝑆𝑡𝑡]. Using a Bellman equation representation, the
lifetime value of a set of behaviors d (i.e., a combination of employment and consumption alternatives) while in health state h at time t is
𝑉𝑉𝑑𝑑𝐻𝐻(Ω𝑡𝑡, ℰ𝑡𝑡) = � 𝜃𝜃𝑖𝑖(𝑥𝑥𝑡𝑡) 𝑆𝑆
𝑖𝑖=1
𝑢𝑢𝑖𝑖(𝑒𝑒𝑡𝑡= 𝑒𝑒 | ℎ𝑖𝑖𝑡𝑡, 𝑥𝑥𝑖𝑖𝑡𝑡, 𝐶𝐶𝑖𝑖𝑡𝑡−1− , 𝜀𝜀𝑖𝑖𝑡𝑡)
+ 𝛽𝛽 � � 𝑝𝑝(ℎ𝑖𝑖𝑡𝑡+1= ℎ′) 𝐻𝐻�
ℎ′=0
𝑉𝑉𝐻𝐻′(Ω 𝑡𝑡+1) 𝑆𝑆
𝑖𝑖=1
Future preference shocks are unknown in the time of decision making in period t, and expected maximal value of utility in period t+1 is defined as
𝑉𝑉𝐻𝐻′
(Ω𝑡𝑡+1) = 𝐸𝐸𝑡𝑡�𝑚𝑚𝑚𝑚𝑥𝑥𝑒𝑒′ 𝑉𝑉𝑑𝑑𝐻𝐻′′(Ω𝑡𝑡+1, ℰ𝑡𝑡+1)�
where 𝐸𝐸𝑡𝑡 is the expectation operator in period t applied to uncertain future
preference shocks, 𝜀𝜀𝑡𝑡+1. Solution of the household’s optimization problem yields
demand functions for the behaviors being modeled (namely, 𝐷𝐷𝑡𝑡= [𝑒𝑒1𝑡𝑡, … , 𝑒𝑒𝑆𝑆𝑡𝑡]).
A household maximizes lifetime utility over behavior alternatives available in period t. Rather than parameterize the utility, wage and health production functions, the resulting demand equation is approximated as a function of all information (Ω𝑡𝑡) available to the household at the point of decision-making.
Effects of ARRA Expiration on the Diet Quality of Low-Income Americans 8
𝐹𝐹𝑡𝑡𝑔𝑔= � 𝑓𝑓𝑖𝑖𝑡𝑡𝑔𝑔 𝑆𝑆
𝑖𝑖=1
= 𝑓𝑓�𝐻𝐻𝑡𝑡, 𝐹𝐹𝑡𝑡−1𝑔𝑔 , 𝐹𝐹𝑡𝑡−1𝑏𝑏 , 𝐸𝐸𝑡𝑡, 𝑋𝑋𝑡𝑡, 𝑃𝑃𝑡𝑡� (1)
where 𝐹𝐹𝑡𝑡−1𝑗𝑗 captures potential dependence on lagged consumption and 𝐸𝐸𝑡𝑡 captures
human capital, work experience and education up to period t. Habituation or dependence is assumed to be consumption specific (i.e., only past food consumption influences utility of food consumption today). The demand function does allow current own and cross prices of all inputs to influence current demand. Similarly, the arguments of demand for each of the behaviors in the vector 𝑒𝑒𝑡𝑡 are
analogous, since these behaviors are chosen jointly
4
Data
In this section, the data source and construction of the research sample is described. First, the various dependent variables used to capture diet quality are detailed. Secondly, the construction of the policy variables representing SNAP participation and the exogenous decrease in benefits is described. Then, summary statistics are provided for time-invariant and time-varying explanatory variables that the theoretical model suggests are relevant determinants of food consumption. Finally, the construction of variables based on a household’s history of food consumption are detailed in order to empirically analyze several hypotheses related to the role of past consumption on current consumption.
4.1
Data Source
Nielson Homescan is a commercially available data set that details food purchases by respondents who digitally scan the barcodes of food purchased during each shopping episode. Using information from the barcodes, specific micro and macronutrients of all food purchased is detailed. Respondents have been found to record shopping episodes with a high degree of reliability (Hut, S. and Oster, E., 2018). These data are especially advantageous because Nielsen does not rely on respondents to recall food eaten at some point in the past to capture food consumption.
Effects of ARRA Expiration on the Diet Quality of Low-Income Americans 9
data are designed to be representative of the United States population. However, the respondents are more likely to be white and have higher levels of education, on average (Hut., S. and Oster, E., 2018). For this research, education is an important variable because Waeher et al. (2015) showed a strong relationship between dietary decision-making and education level. Secondly, Nielson Homescan data provide information on food purchases, while the desired outcome of this research is food intake. As such, it is an assumption that participants are eating the food they are buying within the period it is purchased (as opposed to stockpiling). I attempt to capture potential stockpiling by indicating large previous period expenditures. Third, the data capture purchased foods that have a barcode and, therefore, excludes weighed produce and all food eaten in restaurants. Notably, by comparing total calories to benchmark calorie estimates, Oster (forthcoming) estimated that 65 percent to 80 percent of total calories are recorded in Nielson data.
As described, Nielsen Homescan data do not exhaustively describe total food intake, reducing the ability of this research to make claims about diet content in totality. However, Nielsen Homescan data do describe, in minute detail that is unmatched in other data sets, a large portion of food purchases, making exploration of these research questions feasible.
4.2
Construction of the Research Sample
Effects of ARRA Expiration on the Diet Quality of Low-Income Americans 10
constant for the five years in the sample. Inconsistent gender and race variables were imputed to the most common gender or race reported over the five-year period.
TABLE 1
Construction of Research Sample
Observations Households
Full Sample 1,195,842 101,021
Balanced Panel Dataa 570,240 28,512
Research Sampleb 553,460 27,673
a Only households observed for all four quarters over all five years were kept in the balanced panel. b The full sample removes erroneous data as described above.
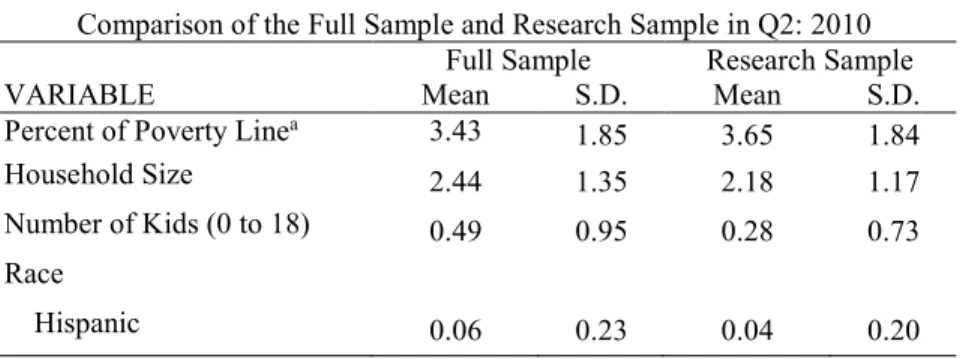
Table 2 details the characteristics of households in the full sample and the research sample in the second quarter of 2010 for comparison. The second quarter observation of households is used to calculate these statistics because SNAP eligibility is reported in quarters two and four only. All of the p-values for the differences in means of the variables between the full sample and the research sample were significant, suggesting a bias in the research sample. However, since both samples are extremely large, I contend that this sample selection does not significantly bias the results. Demographics of the research sample are different from the demographic makeup of the United States in a few ways. First, as noted previously, the research sample is more white (80 percent), compared to the US population in 2010 (72.4 percent) (Census Bureau, 2011). Second, household sizes are slightly smaller in the research sample (2.44 people), compared to the US population in 2010 (2.58 people) (Census Bureau, 2012).
TABLE 2
Comparison of the Full Sample and Research Sample in Q2: 2010 Full Sample Research Sample
VARIABLE Mean S.D. Mean S.D.
Percent of Poverty Linea 3.43 1.85 3.65 1.84
Household Size 2.44 1.35 2.18 1.17
Number of Kids (0 to 18) 0.49 0.95 0.28 0.73 Race
Effects of ARRA Expiration on the Diet Quality of Low-Income Americans 11
Black 0.09 0.29 0.08 0.27
Other 0.05 0.22 0.04 0.20
White 0.80 0.40 0.83 0.37
Single Male HOH b
0.07 0.26 0.09 0.29
Single Female HOH b 0.20 0.40 0.21 0.41
Female HOH b Education
High School or Below 0.27 0.44 0.29 0.46 More than High School 0.73 0.44 0.71 0.46 Male HOH b Education
High School or Below 0.31 0.46 0.29 0.45 More than High School 0.69 0.46 0.71 0.45
a Presented as the percent of the Federal Poverty Line divided by 100
b Head of Household (HOH)
In the research sample, some missing values for the SNAP variable were imputed. Before imputation, it appeared that SNAP participation was not observed for sixty percent of household quarters. Upon further examination, it was revealed that SNAP participation information was only obtained by Nielsen in quarters two and four. In those quarters’ households were asked if they “are currently on SNAP”, “have been on SNAP in the past, but not currently”, or “have never been on SNAP”. To address the missing observations, three kinds of values were imputed for the SNAP variable. First, for households whose report is consistent across all observations in quarters two and four, quarters one and three were imputed to the consistent response. Second, for households that only reported never being on SNAP and had only up to nine missing responses over the twenty quarters, all quarters were imputed as “never on SNAP”. Finally, for households who only reported being “on SNAP” and had fewer than three missing responses, all missing responses were imputed as “on SNAP”. The same method was used with households who consistently reported being “on SNAP in the past”. Current SNAP participation prior to imputation amounted to 1.18 percent of all household quarters, with 76 percent being unassigned. After imputation, only 31 percent of household quarters remained unassigned (i.e, SNAP participation unknown) with 1.75 percent of household quarters receiving SNAP currently. The percent of households on SNAP in this sample is far below the national average in 2010 of 12.3 percent of households on SNAP in the US population.
Effects of ARRA Expiration on the Diet Quality of Low-Income Americans 12
relies on a complicated formula that depends on household income and assets as well as household size, composition, disability status, and program participation. While these data include income as a percent of the federal poverty line and household size, there is no available information on other household assets, disability or willingness to participate in SNAP programs. In the regression, a continuous variable of household size and three variables capturing income are included as controls. Two indicator variables representing households with income less than 185 percent of the federal poverty line and 130 percent of the federal poverty line are included in addition to a continuous income variable because households become income-eligible for various federal programs below such thresholds.
4.3
Dependent Variables Used in Analysis
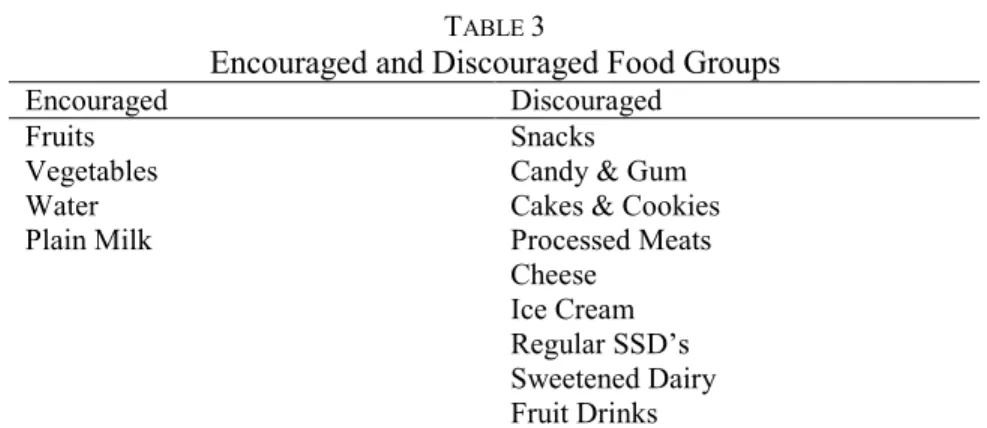
This section describes the dependent variables capturing diet quality among households, focusing on two nutrients of concern (sugar and saturated fat) and two food groups (encouraged and discouraged foods).3First, sugar is a nutrient of concern because studies have found that increases in consumption of sugary foods reduce intake of key nutrients while simultaneously increasing total calorie consumption (Colman, S., Nichols-Barrer, I.P., Redline, J.E., Devaney, B.L., and Ansell, S.V., 2012). Second, high levels of saturated fat consumption drive up harmful cholesterol levels, leading to poor health outcomes such as blockages in the arteries of the heart (Harvard, n.d.). Encouraged and discouraged foods are grouped according to guidelines from the 2015 Dietary Guidelines for Americans, with most foods falling into a neutral category. Table 3 describes these two groups explicitly. All of these measures of diet quality correspond to the "good" and "bad" foods from which a household gains utility in the theoretical model and outlined in Equation (1). Total expenditures are also included in the list of dependent variables as many similar papers have used it as an alternative to diet quality measures.
3These measures of diet quality are preferred over using an index (such as in Waehrer et al.,
Effects of ARRA Expiration on the Diet Quality of Low-Income Americans 13
TABLE 3
Encouraged and Discouraged Food Groups
Encouraged Discouraged
Fruits Snacks
Vegetables Candy & Gum
Water Cakes & Cookies
Plain Milk Processed Meats
Cheese Ice Cream Regular SSD’s Sweetened Dairy Fruit Drinks
Source: 2015 Dietary Guidelines for Americans
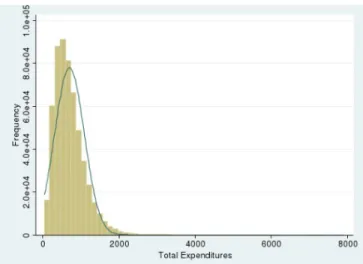
The mean values of dependent variables in the sample are consistent with findings from the National Health and Nutritional Examination Survey (NHANES) in 2015, suggesting that the sample is indeed representative of the US population. For example, the mean intake of saturated fat for men and women over 20 in NHANES is 12 percent, which is very similar to the mean value of the Nielsen Homescan research sample. The distribution of dependent variables is well approximated by a normal distribution as shown in Figure 1 and Figure 2. Table 4 provides summary statistics for the dependent variables by percent of the poverty line and SNAP participation.
Effects of ARRA Expiration on the Diet Quality of Low-Income Americans 14
FIGURE 2: Distribution of Total Food Expenditures
4.4 Explanatory Variables
Effects of ARRA Expiration on the Diet Quality of Low-Income Americans 15
a measure of physical activity. To allow for ease of regression interpretation when also including a measure of household size, total household caloric need is divided by household size. Thus, this variable describes the average caloric need of an individual in a given household. Specifically,
𝐴𝐴𝐴𝐴𝑒𝑒𝐴𝐴𝑚𝑚𝐴𝐴𝑒𝑒 𝐶𝐶𝑚𝑚𝑙𝑙𝐶𝐶𝐴𝐴𝐶𝐶𝑐𝑐 𝑁𝑁𝑒𝑒𝑒𝑒𝑒𝑒 = ∑ (𝐶𝐶𝑚𝑚𝑙𝑙𝐶𝐶𝐴𝐴𝐶𝐶𝑐𝑐 𝑁𝑁𝑒𝑒𝑒𝑒𝑒𝑒 | 𝑥𝑥𝑆𝑆𝑖𝑖=1 𝑆𝑆 𝑖𝑖𝑡𝑡)
Several variables that capture a household’s history of consumption are also included (Table 4). First, a variable indicating that expenditures on food last quarter were more than two standard deviations above mean expenditures for households with the same caloric need is included.4 This variable may capture stockpiling or other behaviors out of the ordinary such as special events or holidays that explain variations in diet quality. Second, variables capturing habit formation were generated to model behavioral persistence. They are constructed as a lagged dependent variable. Averages over four quarters could also be considered to capture persistence.
4A similar variable was also constructed indicating that mean expenditures for a household were
Effects of ARRA Expiration on the Diet Quality of Low-Income Americans 16
TABLE 4
Summary of Dependent Variables by SNAP Participation
Income Above 185% of Poverty Line Income Below 185% of Poverty Line
Not on SNAP On SNAP Not on SNAP On SNAP
Mean S.D. Mean S.D. Mean S.D. Mean S.D.
Number
Sugar 70596.50 50202.6 87112.00 59979.0 79924.30 60574.8 80998.90 64325.2
Saturated Fat 33715.70 22337.9 40249.30 25517.5 36469.70 25639.0 36673.10 26292.2 Discouraged 101091.0 71810.3 115052.3 74294.8 110262.7 85137.9 110120.2 89071.2 Encouraged 26666.00 21249.0 27485.40 22238.2 28541.50 24728.0 26005.20 22694.5 Percent
Sugar 25.1 8.20 27.3 9.70 26.3 8.90 26.7 9.40
Saturated Fat 12.1 3.60 12.7 3.70 12.2 3.60 12.4 4.00
Discouraged 36.4 12.7 36.8 12.5 36.7 13.1 37.0 13.8
Encouraged 9.70 5.60 8.60 5.00 9.60 5.70 8.80 5.60
Expenditures
Dollars 711.2 387.2 756.4 413.8 645.3 393.6 641.4 405.8
Effects of ARRA Expiration on the Diet Quality of Low-Income Americans 17
TABLE 5
Summary of Independent Variables by SNAP Participation
Income Above 185% of Poverty Line Income Below 185% of Poverty Line
Not on SNAP On SNAP Not on SNAP On SNAP
Mean S.D. Mean S.D. Mean S.D. Mean S.D.
Race
Hispanic 0.04 0.20 0.06 0.24 0.04 0.20 0.03 0.18
Black 0.08 0.27 0.19 0.39 0.08 0.27 0.09 0.29
Other 0.04 0.20 0.02 0.15 0.04 0.20 0.04 0.21
White 0.83 0.37 0.72 0.45 0.84 0.36 0.83 0.38
Household Composition
Calorie Need 2.14 0.18 2.16 0.20 2.15 0.19 2.19 0.22
Household Size 2.15 1.09 2.37 1.28 2.32 1.47 1.97 1.32
Single Male HOH 0.09 0.29 0.10 0.30 0.09 0.29 0.16 0.37
Single Female HOH 0.19 0.39 0.17 0.38 0.28 0.45 0.38 0.48
Kids Age 0 to 2 0.00 0.07 0.01 0.09 0.01 0.09 0.01 0.09
Kids Age 2 to 5 0.03 0.16 0.04 0.20 0.04 0.21 0.05 0.22
Kids Age 6 to 11 0.06 0.24 0.07 0.26 0.10 0.29 0.08 0.27
Kids Age 1 to 18 0.10 0.30 0.07 0.25 0.14 0.35 0.11 0.31
Income
Percent of FPL 4.17 1.61 2.93 1.07 1.26 0.41 1.01 0.40
Education
High School or Below (Male HOH) 0.26 0.44 0.39 0.49 0.48 0.50 0.47 0.50
More than High School (Male HOH) 0.74 0.44 0.61 0.49 0.52 0.50 0.53 0.50
High School or Below (Female HOH) 0.26 0.44 0.35 0.48 0.46 0.50 0.43 0.50
Effects of ARRA Expiration on the Diet Quality of Low-Income Americans 18
5
Results
In this section, the impact of a reduction in SNAP benefits on diet quality and food expenditures is described. The empirical model captures how the demand for different types of food varies with SNAP participation. Demand is measured by the amount or percentage of a households’ quarterly diet consisting of sugar or saturated fat and encouraged or discouraged foods. Determining the impact of a SNAP benefit reduction is feasible because of the exogenous decrease occurring in 2013 due to ARRA expiration. This section also describes the impact of theoretically-relevant household characteristics on household food quality.
5.1
Empirical Methods
Following the theoretical model described in Section 3, the derived demand for food, or quantity of a food of a particular quality (in this example, encouraged foods 𝐹𝐹𝑡𝑡𝑔𝑔) is
𝐹𝐹𝑡𝑡𝑔𝑔= 𝑓𝑓�𝐻𝐻𝑡𝑡, 𝐹𝐹𝑡𝑡−1𝑔𝑔 , 𝐹𝐹𝑡𝑡−1𝑏𝑏 , 𝐸𝐸𝑡𝑡, 𝑋𝑋𝑡𝑡, 𝑃𝑃𝑡𝑡�.
Using 𝑌𝑌ℎ𝑡𝑡 to denote the quantity of food for household h in period t (where Y
measures the percent of total calories of each food type or the number of calories of each food type), the empirical specification is
𝑌𝑌ℎ𝑡𝑡= 𝛼𝛼𝑜𝑜+ 𝛼𝛼1𝑆𝑆𝑁𝑁𝐴𝐴𝑃𝑃ℎ𝑡𝑡 + 𝛼𝛼2𝑇𝑇𝑇𝑇𝐸𝐸𝐴𝐴𝑇𝑇𝑡𝑡+ 𝛼𝛼3𝑆𝑆𝑁𝑁𝐴𝐴𝑃𝑃ℎ𝑡𝑡× 𝑇𝑇𝑇𝑇𝐸𝐸𝐴𝐴𝑇𝑇𝑡𝑡
+ 𝛼𝛼4𝑌𝑌ℎ𝑡𝑡−1+ 𝛼𝛼5(𝑌𝑌ℎ𝑡𝑡−1)2
+ 𝛼𝛼61[𝑡𝑡𝐶𝐶𝑡𝑡𝑚𝑚𝑙𝑙 𝑓𝑓𝐶𝐶𝐶𝐶𝑒𝑒 𝑒𝑒𝑥𝑥𝑝𝑝ℎ𝑡𝑡−1> 2𝜎𝜎] + 𝛼𝛼7′𝐸𝐸ℎ𝑡𝑡+ 𝛼𝛼8′𝑋𝑋ℎ𝑡𝑡
+ 𝛼𝛼8′𝑃𝑃ℎ𝑡𝑡+ 𝛼𝛼10𝑡𝑡 + 𝛼𝛼11𝑡𝑡2+ 𝛼𝛼12′ 𝑞𝑞𝑡𝑡𝐴𝐴 + 𝜀𝜀ℎ𝑡𝑡
(2)
where 𝛼𝛼3 measures the effect of the policy change.
Effects of ARRA Expiration on the Diet Quality of Low-Income Americans 19
However, tests based on the Akaiake Information Criterion and the Bayesian Information Criterion suggest the best model is linear. I also explore whether the explanatory variables have a different effect across the support of the dependent variable distribution using quantile regression. Each regression specification contains random effects with robust standard errors and quarter indicator variables to control for seasonal shifts in consumption. The specification includes a quadratic time trend.
In addition to using the full research sample, regressions were run on two sub-samples. Because imputation was required to define the SNAP variable in quarters one and three, I explore the impact of SNAP benefit reductions using observations from quarters two and four only. Because many individuals are not eligible for SNAP benefits, I examine the effect of benefit reduction on a subset of low-income households (i.e. less than 185 percent of the federal poverty line).
5.2
Regression Results
5.2.1 Impact of ARRA Expiration on Diet Quality
A reduction in SNAP benefits significantly impacted only one measure of diet quality explored in this research. ARRA expiration led to a reduction in the number of sugar calories consumed for households on SNAP, for the full sample (Table 6) and for the subsample limited to quarters two and four (Table 7). In addition, households with different races responded differently to the policy change. For example, Hispanic families saw a 3 percent reduction in sugar calories as a result of the benefit reduction. Figure 5 displays the marginal effect of SNAP on sugar calories, where the difference between red and blue dots represents the effect of the policy change.
TABLE 7
Selected Results: ARRA Expiration Effect on Sugar Calories
Number of Calories Percent of Total Calories
VARIABLE Coef. S.D. Coef. S.D.
SNAP Participation 1,381 565.2 ** 0.257 0.088 * Post-ARRA Expiration -308 265.3 -0.227 0.083 *** SNAP # Post-ARRA c -1,648 766.5 ** -0.109 0.203
*** p<0.01, ** p<0.05, * p<0.1
a Subsample limited to quarters two and four
Effects of ARRA Expiration on the Diet Quality of Low-Income Americans 20
For all other measures of diet quality, there was no evidence that a decrease in SNAP benefits had a significant impact, even across the support of the distribution, as seen in Tables 6 and 8. This result is consistent with the findings of Waehrer et al. (2015) who showed using NHANES diet recall data that a diet change is rare, even when SNAP benefits are changed. I discuss the effects of lagged consumption and other variables in section 5.2.3.
FIGURE 5: Marginal Effects of SNAP on Sugar Calories
5.2.2 Impact of ARRA Expiration on Total Food Expenditures
While a reduction in SNAP benefits appears to have little impact on food quality composition, I explore whether this reduction reduced total expenditures. Total expenditures are reduced by roughly two percent when using a sub-sample limited to quarters two and four where SNAP participation is explicitly defined (Table 9). This finding is also consistent with Waehrer et al (2015). I conclude that SNAP benefit reduction does reduce expenditures; households do not appear to replace benefit with reductions in consumption in other areas. However, the composition of foods consumed is generally unchanged.
Effects of ARRA Expiration on the Diet Quality of Low-Income Americans 21
Selected Results: Effect of ARRA Expiration on Ln(Expenditures) a
VARIABLE Coef. S.E.
SNAP Participation 0.0018 0.0102
Post-ARRA Expiration 0.0215 0.0076 ***
SNAP # Post-ARRA c -0.0196 0.0118 *
*** p<0.01, ** p<0.05, * p<0.1
a Sample limited to quarters two and four. Number of observations was 276,630, representing 27,673
unique households.
b Regression also controls for demographics, prices and time as defined in Equation (2) c Pound sign designates interaction.
5.2.3 Other Determinants of Diet Quality Demand
Apart from the effect of ARRA expiration, the results suggest other important determinants of diet quality (Tables 10 and 11). Race, household size and composition, education, habituation and cross price effects all contribute to explaining differences in diet quality.
First, race plays a significant role on almost all measures of diet quality. For example, black households consume more sugar calories and less encouraged calories than white households. However, black households on SNAP consume one percent fewer discouraged calories than black households not on SNAP. Figure (5) shows that the marginal effect of SNAP on discouraged calories varies by race. The red and blue points in the figure are very close together, which means, as noted in section 5.2.1, ARRA expiration appears to have little effect on discouraged calorie consumption.
FIGURE 5: Marginal Effects of SNAP on Discouraged Calories
Effects of ARRA Expiration on the Diet Quality of Low-Income Americans 22
age of the children in a household playing an additional significant role. Households with kids from six to eleven are associated with diets higher in sugar and discouraged calories and lower in encouraged calories. In addition, households with kids from zero to two are associated with less encouraged and more discouraged calories in their diet. Diet quality is also affected by households headed by single females and males. Households headed by a single male are associated with diets higher in sugar and discouraged calories. However, households headed by a single female are higher in sugar and encouraged calories.
Third, diet quality is beneficially associated with higher education of the household head, for most measures studied in this research. For example, households headed by a male with less than a high school education eat fewer encouraged calories and more discouraged and sugar calories.
Fourth, diet quality in the previous quarter is significant in the demand for a particular diet in the current time period, suggesting habit formation. The more of a particular diet composition a household consumed in the past, the more it consumes in the present, but at a decreasing rate. This habit formation may contribute to the rarity of diet quality changes in response to decreasing SNAP benefits.
Effects of ARRA Expiration on the Diet Quality of Low-Income Americans 23
TABLE 6
Selected Results: ARRA Expiration Effect on Diet Quality Measured by Number of Calories
*** p<0.01, ** p<0.05, * p<0.1
a Regression also controls for demographics, prices and time as defined in Equation (2) b Pound sign designates interaction.
TABLE 8
Selected Results: ARRA Expiration Effect on Diet Quality Measured by Percent of Total Calories
Sugar
Discouraged
Encouraged
Saturated Fat
VARIABLES
Coef.
S.E.
Coef.
S.E.
Coef.
S.E.
Coef.
S.E.
SNAP Participation
0.175 -0.132
0.291
0.198
-0.169
0.074 **
-0.082
0.060
Post-ARRA Expiration
-0.389 -0.052 ***
-0.468
0.077 ***
0.038
0.033
-0.033
0.025
SNAP # Post-ARRA
b-0.008 -0.139
-0.081
0.184
0.001
0.084
-0.012
0.075
Constant
25.39 -0.439 ***
35.74
0.648 ***
12.96
0.273 *** 11.550
0.211 ***
Observations
525,787
525,787
525,787
525,787
*** p<0.01, ** p<0.05, * p<0.1
a Regression also controls for demographics, prices and time as defined in Equation (2) b Pound sign designates interaction.
Sugar
Discouraged
Encouraged
Saturated Fat
VARIABLES
Coef.
S.E.
Coef.
SE.
Coef.
S.E.
Coef.
S.E.
SNAP Participation
865.4 764.1
-457.6 1,433
-0.166
0.092 *
-408.8 378.6
Post-ARRA Expiration
-204.3 222.5
-1,369 321.3 ***
0.123
0.035 ***
-150.6 93.60
SNAP # Post-ARRA
b-1,296 760.2 *
738.3 811.0
-0.008
0.120
-65.36 274.8
Constant
44,085 -2,560 *** 55,176 -3,878 ***
14.96
-.0462 ***
19,590 -1,119 ***
Effects of ARRA Expiration on the Diet Quality of Low-Income Americans 24
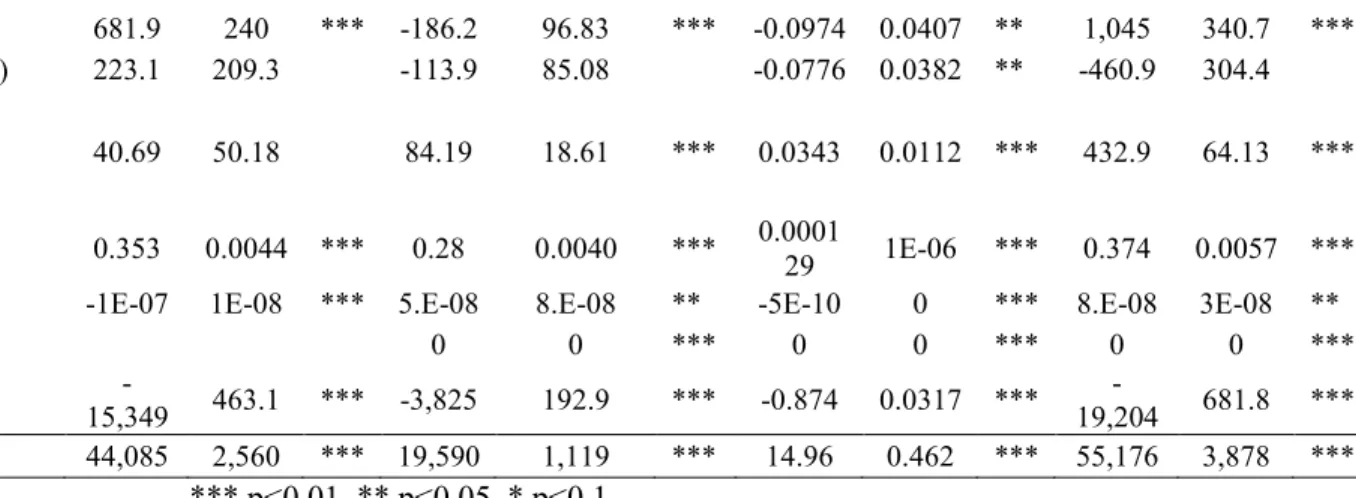
TABLE 10
Determinants of Number of Calories
Sugar Saturated Fat Encouraged Discouraged
VARIABLES Coef. S.E. Coef. S.E. Coef. S.E. Coef. S.E.
Race
Black 2,907 303.8 *** -2,181 141.3 *** -1.238 0.0634 *** -1,423 557.2 **
SNAP # Black b 1,196 1,949 813.5 776.9 0.110 0.185 -5,412 2,959 *
Hispanic 148.6 482.5 -1,484 227.6 *** 0.460 0.158 *** -2,633 781.9 ***
SNAP # Hispanic b -5,002 4,442 1,348 7,589 0.182 0.377 10,289 13,864
Other 569.8 479.3 -649.4 213.0 *** 0.055 0.0987 -1,288 703.7 *
SNAP # Otherb -2,925 2,309 1,684 1,303 0.681 0.343 ** -7,314 4,219 *
Household Composition
Single Female HOH 2,342 431.9 *** 238.5 175.4 0.37 0.0731 *** 501.2 644.5
SNAP # Single Female HOH b 542.2 472.3 -0.279 0.159 * -159.2 1,738
Black # Single Female HOH b 529.8 191.6 *** 0.121 0.128 757.8 814.4
Hispanic # Single Female HOH b 89.58 457.4 0.217 0.601 880.3 1,672
Other # Single Female HOH b -367.9 372.6 -0.295 0.271 -651.2 1,489
Single Male HOH 3,369 677.8 *** 269.3 267.0 -0.0415 0.132 5,052 944 ***
Calorie Need -349.6 719.2 -102.6 303.5 -1.551 0.132 *** 7,782 1,051 ***
Household Size -541.1 178.6 *** -482.1 72.77 *** 0.00696 0.0197 -2,848 269.6 ***
Kids
Kids Age 0 to 2 1,320 1,290 -174.2 560.0 -0.587 0.13 *** 4,712 1,759 *** Kids Age 6 to 11 670.2 449.6 -704.7 191.2 *** -0.134 0.0503 *** 3,339 681.8 ***
Kids Age 12 to 18 -544.1 379.0 -856 159.0 *** -0.056 0.0425 263.2 545.6
Effects of ARRA Expiration on the Diet Quality of Low-Income Americans 25
Table 10 continued
Education
High School or Below (Male HOH) 681.9 240 *** -186.2 96.83 *** -0.0974 0.0407 ** 1,045 340.7 *** High School or Below (Female HOH) 223.1 209.3 -113.9 85.08 -0.0776 0.0382 ** -460.9 304.4 Income
Percent of FPL 40.69 50.18 84.19 18.61 *** 0.0343 0.0112 *** 432.9 64.13 ***
Habituation and Stockpiling
L. Calories 0.353 0.0044 *** 0.28 0.0040 *** 0.000129 1E-06 *** 0.374 0.0057 *** L. Calories Squared -1E-07 1E-08 *** 5.E-08 8.E-08 ** -5E-10 0 *** 8.E-08 3E-08 **
L. Calories Cubed 0 0 *** 0 0 *** 0 0 ***
Stockpiling 15,349 463.1 *** -3,825 - 192.9 *** -0.874 0.0317 *** 19,204 681.8 ***
-Constant 44,085 2,560 *** 19,590 1,119 *** 14.96 0.462 *** 55,176 3,878 ***
*** p<0.01, ** p<0.05, * p<0.1
Effects of ARRA Expiration on the Diet Quality of Low-Income Americans 26
TABLE 11
Selected Determinants of Percent Composition of Calories
Continued on next page
Sugar Discouraged Encouraged Saturated Fat
VARIABLES Coef. S.E. Coef. S.E. Coef. S.E. Coef. S.E.
Race
Black 0.73 0.05 *** -0.09 0.085 -0.565 0.029 *** -0.377 0.0221
***
Hispanic -0.05 0.07 -0.73 0.130 *** 0.153 0.070 ** -0.315 0.0356
***
Other 0.08 0.07 -0.27 0.102 *** 0.034 0.051 -0.138 0.0353
***
SNAP # Black b 0.26 0.36 -1.28 0.530 ** 0.080 0.157 0.232 0.1690
SNAP # Hispanic b -1.26 0.95 0.28 1.076 -0.057 0.252 1.455 1.4610
SNAP # Other b -0.50 0.46 -1.26 0.709 * 0.780 0.307 ** 0.607 0.3670
*
Household Composition
Single Female HOH 0.06 0.07 -0.16 0.102 0.113 0.040 *** 0.043 0.0327
Single Male HOH 0.30 0.11 *** 0.84 0.162 *** -0.061 0.073 -0.086 0.0473
*
Black # Single Female b 0.24 0.162 0.169 0.059 *** -0.111 0.0437
**
Calorie Need 0.09 0.11 1.62 0.169 *** -0.812 0.071 *** -0.061 0.0537
Household Size 0.10 0.02 *** -0.03 0.029 0.052 0.012 *** -0.008 0.0087 Kids Age 0 to 2 -0.13 0.14 0.56 0.216 *** -0.294 0.099 *** -0.049 0.0852 Kids Age 6 to 11 0.10 0.05 ** 0.48 0.076 *** -0.081 0.034 ** -0.145 0.0238
***
Kids Age 12 to 18 0.04 0.04 0.17 0.066 *** 0.018 0.029 -0.071 0.0207
***
Education
Effects of ARRA Expiration on the Diet Quality of Low-Income Americans 27
Table 11 continued
*** p<0.01, ** p<0.05, * p<0.1
a Regression also controls for demographics, prices and time as defined in Equation (2) b Pound sign designates interaction.
Income
Percent of FPL
-0.06
0.01 ***
0.02
0.01
0.01
0.01
-0.01
0.004
Habituation and Stockpiling
Lagged Calories
0.688 0.002 ***
0.692 0.0031 ***
0.71 0.0027 *** 0.653
0.003 ***
L. Calories Squared
-0.01 0.0002 *** -0.001 0.0001 *** -0.001 0.0006 **
-0.012
0.001 ***
L. Calories Cubed
1E-05 5E-06 ***
6E-05
2E-05 ***
Stockpiling
-0.51 0.0483 *** -0.333 0.0717 *** -0.012 0.0311
0.0745
-
0.024 ***
Effects of ARRA Expiration on the Diet Quality of Low-Income Americans 28
TABLE 12
Price Effects of Percent Composition of Encouraged and Discouraged Calories
Discouraged Encouraged
VARIABLE (food price) Coef. S.E. Coef. S.E.
Encouraged
Fresh/frozen fruit -0.411 0.091 *** -0.157 0.0399 ***
Canned/dried fruit -0.441 0.121 *** 0.251 0.0530 ***
Canned/dried vegetables 0.445 0.236 * -0.184 0.1030 *
Fresh & frozen vegetables 0.603 0.215 *** -0.259 0.0938 ***
Fresh plain milk 0.030 0.050 0.0579 0.0218 ***
Water -0.023 0.060 -0.0057 0.0264
Discouraged
Cheese 0.2770 0.138 ** -0.13 0.0597 **
Canned processed meats -0.0637 0.036 * 0.00407 0.0159
Refrigerated Processed Meat -0.0065 0.110 -0.00764 0.0472
Cookies 0.2380 0.144 * -0.313 0.0634 ***
Shelf-stable snacks -0.2680 0.172 0.17 0.0777 **
Candy & gum 0.7780 0.148 *** -0.0637 0.0643
Frozen/refrigerated pudding and ice cream -0.2440 0.103 ** 0.0312 0.0446
Refrigerated sweetened dairy 0.1430 0.076 * 0.095 0.0331 ***
Carbonated soft drinks (regular) 0.0355 0.058 -0.0212 0.0245
Effects of ARRA Expiration on the Diet Quality of Low-Income Americans 29 Table 12 continued
Other
Yogurt -0.162 0.111 0.086 0.0486 *
Cereals (requires cooking) 0.0009 0.0882 0.136 0.0387 ***
RTE cereals -0.085 0.138 0.212 0.0608 ***
Boxed, dry pasta & rice -0.356 0.117 *** -0.0687 0.0512
Boxed pasta & rice dinners 0.728 0.148 *** -0.288 0.0646 ***
Shelf-stable Mexican-style products 0.0191 0.0952 -0.0245 0.041
Dry Baking Mixes -0.115 0.144 0.0687 0.0636
RTE Breads -0.791 0.191 *** -0.197 0.0809 **
Frozen Baked goods -0.0539 0.081 -0.129 0.0359 ***
Refrigerated /frozen dough -0.0847 0.104 -0.0683 0.0464
Frozen Breakfast products 0.0263 0.0698 0.0167 0.0292
RTE sandwiches 0.114 0.0351 *** -0.0374 0.0154 **
Frozen Refrigerated Pizza -0.25 0.0659 *** -0.074 0.0286 ***
RTE cereal bars 0.288 0.0888 *** -0.0713 0.0375 *
RTE grain based deserts -0.256 0.111 ** -0.0177 0.0481
Crackers 0.116 0.145 -0.0791 0.0644
Frozen entrees 0.051 0.0904 0.0111 0.039
Effects of ARRA Expiration on the Diet Quality of Low-Income Americans 30
Table 12 continued
RTE, prepared dishes 0.103 0.112 -0.298 0.0481 ***
Canned mixed dishes -0.0892 0.0965 0.0297 0.0429
Shelf-stable soups and stews -0.147 0.146 0.229
0.0637 ***
Shelf-stable fruit & vegetable drinks 0.229 0.146 0.408 0.0632 ***
Frozen fruit drinks and juice 0.00686 0.0301 -0.0143 0.0131
Beverage powder & concentrates per capita -0.0349 0.0627 0.0747 0.0276 ***
Tea -0.229 0.0688 *** 0.0907 0.0298 ***
Coffee -0.0061 0.0345 0.0379 0.0149 ***
*** p<0.01, ** p<0.05, * p<0.1
Effects of ARRA Expiration on the Diet Quality of Low-Income Americans 31
6 Conclusions
Effects of ARRA Expiration on the Diet Quality of Low-Income Americans 32
Acknowledgments
Effects of ARRA Expiration on the Diet Quality of Low-Income Americans 33
A
Appendix
TABLE 13
Summary of Fisher Prices for Food Groups Across All Markets
Food Group Mean S.D. Min Max
101 3.86 0.38 3.07 5.04
102 2.47 0.28 1.68 3.61
205 4.03 0.73 2.07 7.78
206 4.46 0.42 3.35 5.81
401 3.24 0.39 2.23 4.79
402 3.93 0.30 3.20 4.99
403 2.38 0.32 1.80 3.58
405 2.37 0.16 1.88 3.15
406 2.62 0.34 1.61 3.68
407 2.46 0.28 1.74 3.52
409 2.59 0.30 1.97 3.49
410 3.82 0.33 2.82 4.88
411 3.10 0.29 2.28 4.18
412 4.08 0.36 3.22 6.19
413 4.47 0.63 3.19 8.25
414 5.33 0.41 4.23 6.67
501 4.08 0.35 3.14 5.11
502 2.96 0.36 2.26 4.52
503 2.13 0.21 1.64 2.95
504 2.69 0.19 2.23 3.36
701 3.86 0.40 2.93 5.37
702 3.22 0.34 2.28 4.21
703 3.10 0.28 2.43 4.19
704 3.13 0.26 2.48 3.92
705 3.29 0.27 2.45 4.29
707 3.02 0.37 2.12 4.62
708 4.07 0.29 3.18 5.11
901 4.72 0.39 3.46 6.00
902 3.83 0.35 2.98 4.91
903 2.60 0.25 2.01 4.12
904 2.60 0.27 1.86 3.58
1101 3.44 0.43 2.18 5.73
1102 3.43 0.32 2.50 4.63
1104 3.56 0.24 2.97 4.39
Effects of ARRA Expiration on the Diet Quality of Low-Income Americans 34
1106 3.31 0.46 1.96 4.94
1107 (Diet) 4.46 0.45 3.32 6.75
1107 (Regular) 4.19 0.37 3.19 5.34
1108 3.88 0.33 2.99 5.24
1109 8.35 0.98 5.89 11.15
1110 3.78 0.40 2.75 5.76
1111 13.63 1.47 8.84 21.39
9999 3.45 0.34 2.69 4.70
Source: Pourya Valizadeh, Carolina Population Center
TABLE 14
Level 1 Food Groupings
Level 1 Name
Description
01
Dairy
products
excl. milk
Includes all cheese, yogurt, sour cream,
whipped cream, frozen cream substitutes, and
canned milk; Includes yogurt shakes and
drinks
02
Meat,
Poultry, fish
& mixtures
Includes all frozen, refridgerated, and canned
seafood, meat, poultry and processed meats;
Including lunchmeat, sausage, corn dogs, taco
filling, frunkfurters
03
Other
protein
sources
Includes fresh eggs, nuts and seeds
04
Grain
Products,
no RTE
desserts
Includes hot and RTE cereals, all pasta and
rice, frozen pizza crust, omlettes, egg
substitutes, and breakfast sandwiches,
breakfast burritos, RTE sandwiches, frozen
hors d' oeuvres and snacks, stuffing mix,
tortillas, taco shells, mexican dry dinner kits
and mexican specialities (i.e. mole paste,
black beans, tamarind, nopales)
05
Fruits &
vegetables
Effects of ARRA Expiration on the Diet Quality of Low-Income Americans 35
06
Fats, oils,
sauces,
condiments
Includes butter, margarine, oils, gravies,
sauces, mayonnaise, salad dressing,
horseradish, fruit reslish, vegetable relish, and
pickle relish, and tomato paste, puree and
sauce
07
Sweets &
snacks
Includes breakfast bars, toaster pastries,
cookies, ice cream cones, crackers, rice cakes,
frozen desserts, ice cream, frozen yogurt,
pudding, fruit cups, gelatin, syrups, sugar,
sweeteners, garlic spreads, dairy dips, and
meat spreads
08
Other
Includes all baby food, baby juice, and baby
milk; all baking supplies (i.e. glazed fruit,
shelf-stable pastry and pie shells, stuffing
products) salt, pepper, seasonings, and yeast
09
Mixed
dishes &
Soups
Frozen dinners, pot pies, meal starters,
combination lunches, pre-cut salads, ready
made salads, canned/shelf-stable macaroni
products, clam juice, chili, beef stew, canned
soup
11
Beverages
Includes fresh plain milk, buttermilk, flavored
milk, eggnog, powedered milk, cider, fruit
juice, vegetable juice, milk/water additives,
cocktail mixes, soft drinks, tea, coffee, ice,
beer, wine, and liquor
Source: Carolina Population Center
TABLE 15
Level 2 Food Groupings
Level 1 Level 2
Level 2 Names
01
01
Cheese
01
02
Yogurt
01
03
Refridgerated dairy-based toppings/condiments
01
04
Shelf-stable creamers, evaporated or condensed
milks
02
01
Refrigerated seafood
02
02
Frozen seafood
02
03
Frozen& fresh meat & poultry
02
04
Canned seafood & poultry
02
05
canned processed meats
02
06
refridgerated processed meats
03
01
Eggs
Effects of ARRA Expiration on the Diet Quality of Low-Income Americans 36
04
01
Cereals (requires cooking)
04
02
RTE cereals and granola
04
03
Boxed, dry pasta & rice
04
04
Fresh/frozen pasta
04
05
Boxed pasta & rice dinners
04
06
Shelf-stable Mexican-style products
04
07
Dry baking mixes
04
08
Flours
04
09
RTE breads
04
10
Frozen baked goods
04
11
Refrigerated/frozen dough products
04
12
Frozen breakfast products
04
13
RTE sandwiches
04
14
Frozen/refridgerated pizza and appetizers
05
01
fresh, frozen fruit
05
02
canned/dried fruit
05
03
canned/dried vegetables & legumes
05
04
fresh & frozen vegetables
06
01
fats and oils
06
02
Condiments, dressing & sauces
07
01
RTE cereal bars and pastries
07
02
RTE grain-based desserts
07
03
cookies
07
04
crackers
07
05
Shelf-stable snacks
07
06
Spreads and dips
07
07
candy & gum
07
08
Frozen/refridgerated pudding and ice cream
07
09
Shelf stable pudding and gelatin
07
10
Shelf-stable dessert toppings
07
11
sweeteners
07
12
nut and fruit spreads
08
01
baby food
08
02
Baking supplies
08
03
spices, seasoning, extracts
09
01
Frozen entrees
09
02
RTE, prepared dishes
Effects of ARRA Expiration on the Diet Quality of Low-Income Americans 37
09
04
Shelf-stable soups & stews
11
01
Fresh plain milk
11
02
Refridgerated sweetened dairy drinks
11
03
Shelf-stable milks, milk substitutes and milk-
based powders
11
04
Shelf-stable fruit and vegetable drinks and juice
11
05
Frozen fruit drinks and juice
11
06
beverage powder and concentrates
11
07
carbonated soft drinks
11
08
tea (bags, loose, RTD)
11
09
coffee (grounds, beans, RTD)
11
10
water and ice
11
11
Alcohol
Effects of ARRA Expiration on the Diet Quality of Low-Income Americans 38
References
Bronnenberg, B.J., Dubé, J.H., and Gentzkow, M. (2012) The evolution of brand preferences: Evidence from consumer migration. The American Economic Review, 102 (6), 2472–2508.
Census Bureau (2012), Households and Families: 2010. URL https://www.census.gov/prod/ cen2010/briefs/c2010br-14.pdf.
Census Bureau (2011), Overview of Race and Hispanic Origin: 2010. URL https://www.census. gov/prod/cen2010/briefs/c2010br-02.pdf.
Center for Disease Control (2013), Adult Obesity Facts. URL https://www.cdc.gov/obesity/data/adult.html.
Colman, S., Nichols-Barrer, I.P., Redline, J.E., Devaney, B.L., and Ansell, S.V. (2012) Effects of the Special Supplemental Nutrition Program for Women, Infants, and Children (WIC): A Review of Recent Research. USDA Nutrition Assistance Program Report Series.
Cronin, F.J., Krebs-Smith, S.M., Wyse, B.W., and Light, L. (1982) Characterizing food usage by demographic variables. J. Am. Diet. Association, 81, 661–673. Darmon, N. and Drewnowski, A. (2008) Does social class predict diet quality? American Journal of Clinical Nutrition, 87 (5), 1107–1117.
Harvard University Online. The truth about fats: the good, the bad, and the in-between. URL https://www.health. harvard.edu/staying-healthy/the-truth-about-fats-bad-and-good.
Hut, S. and Oster, E. (2018) Changes in Household Diet: Determinants and Predictability. National Bureau of Economic Research. Working Paper 24892.
Kant, A. and Graubard, B. (2018) Secular trends in regional differences in nutritional biomarkers and self-reported dietary intakes among American adults: National health and nutrition examination survey (NHANES) 1988-1994 to 2009-2010. Public Health Nutrition, 21 (5), 927–939.
Ng, S. and Popkin, B. (2012) Monitoring foods and nutrients sold and consumed in the United States: Dynamics and challenges. Journal of the Academy of Nutrition and Dietetics, 112 (1), 41–45.
Nord, M. and Prell., M. (2011) Security Improved following the 2009 ARRA Increase in SNAP Benefits. USDA, Economic Research Service, Economic Research Report No. 116.
Effects of ARRA Expiration on the Diet Quality of Low-Income Americans 39
to Health Information,” American Economic Journal: Applied Economics, forthcoming.
Popkin, B., What is the Nutrition Transition? URL http://nutrans.web.unc.edu/ whatis/.
Rossum, C.T.M.V., Mheen, H.V.D., Witteman, J.C.M., Grobbee, E., and Mackenbach, J.P. (2000) Education and nutrient intake in Dutch elderly people. the Rotterdam study. European Journal of Clinical Nutrition, 54 (2), 159–165. Shimakawa, T., Sorlie, P., and Carpenter, M.A. (1994) Dietary intake patterns and sociodemographic factors in the atherosclerosis risk in communities study. ARIC Study Investigators. Prev. Med, 23, 769–780.
Valizadeh and Smith (2018). How did the American Recovery and Reinvestment Act Affect the Material Wellbeing of SNAP Participants? A Distributional Approach. Working Paper.
Waehrer, G., Deb, P., and Decker, S.L. (2015) Did the 2009 the American Recovery and Reinvestment Act affect dietary intake of low-income individuals? Economics and Human Biology, 19 (170-183).