The Evolution of the World Bank’s Global
Health Work in Africa from 2000-2015
By: Lawrence Hinkle
A master’s paper submitted to the faculty of The University of North
Carolina at Chapel Hill in partial fulfillment of the requirements for the
degree of Master of Science in Public Health in the Department of
Health Policy & Management, Gillings School of Global Public Health
Chapel Hill
3 May 2016
Approved by:
_______________________________
Bruce Fried (First Reader)
Table of Contents
Abstract ... 4
Overview ... 4
Background ... 5
The World Bank and Health ... 6
The World Bank, Millennium Development Goals, Sustainable Development Goals and Post-2015 Development Agenda ... 7
Vertical verses Horizontal Approaches to Health ... 10
Specific Aims - The Way Forward for the World Bank on Health ... 11
Specific Aim #1 – Determine how the World Bank’s health goals have evolved since the advent of the Millennium Development Goals ... 12
Specific Aim #2 – Determine whether the changes identified in the data are due to actual changes in strategy ... 12
Methods ... 13
Results ... 16
Project Review ... 16
Table 1 – Percentage of Project Spending By Designation and Theme ... 17
Table 2 – Project Duration and Financing ... 18
Table 3 – Frequency and Percentage of Horizontal Themes in Health Projects by 4-year span ... 19
Table 4 – Frequency and Percentage of Vertical Themes in Health Projects by 4-Year Span ... 20
Table 5 – Frequency of Both Themes in Health Projects by 4-Year Span ... 21
Table 6 – Frequency and Percentage of Top 10 Most Frequently Appearing Other Themes in Health Projects by 4-Year Span ... 22
Table 7 – Frequency and Percentage of Top 11 Most Frequently Appearing Other Sectors in Health Projects ... 23
Document Review ... 24
Discussion ... 24
Conclusion ... 27
Acknowledgements ... 29
Appendix 1 – Project Document Review and Analysis ... 30
Projects Started in 2000 ... 30
Projects Started in 2001 ... 32
Projects Started in 2002 ... 34
Projects Started in 2003 ... 36
Projects Started in 2004 ... 38
Projects Started in 2007 ... 44
Projects Started in 2008 ... 46
Projects Started in 2009 ... 48
Projects Started in 2010 ... 50
Projects Started in 2011 ... 52
Projects Started in 2012 ... 54
Projects Started in 2013 ... 56
Projects Started in 2014 ... 58
Projects Started in 2015 ... 60
Abstract
The World Bank is a leading driver of international development in Africa, where a higher percentage of its project portfolio is concentrated than any other continent. The World Bank’s stated goal is poverty reduction and growing economies. Given the strong connection between poverty and poor health, however, the World Bank has become a major player in global health, particularly since the advent of the Millennium Development Goals (MDGs) in 2000. At the conclusion of the MDGs, however, progress was unsatisfactory in many areas. As the Sustainable Development Goals were developed to replace the MDGs, there was a lot of discussion in the development community about the need to change strategies, including from those at the Bank itself. This report examines the strategies that the World Bank has used to achieve its health goals in Africa since the start of the MDGs in 2000. This report examines data from all 420 World Bank health projects implemented in Africa between 2000-2015. The report also samples projects for a document review to better analyze the Bank’s health interventions and strategies. The report concludes that while many of the Bank’s strategies and interventions remain vertically inclined, the Bank appears to recognize the need for horizontal interventions. The data suggests that the Bank has made some movement in this direction, but it is too soon to tell whether this trend will persist or what the outcomes of this work will be.
Overview
The Millennium Development Goals (MDGs) concluded in 2015 and gave way to the Sustainable Development Goals (SDGs), which have set the development agenda for the next fifteen years. The MDGs, and the work to achieve them, were responsible for many gains in health status across the globe. There were also many failures, however, and as the SDGs were conceptualized, the development community began to discuss how the SDGs could succeed where the MDGs fell short. Among those involved in the discussion was the World Bank, one of the principle actors involved with both the MDGs and the SDGs.
top-down strategies that focus on selective issues with specific targets or benchmarks; or horizontal, which seek a more holistic approach to systems strengthening and focus on affecting the determinants of health. To that end, the SDGs call for a more comprehensive approach to health systems strengthening – as opposed to condition-specific, top-down approaches often implemented under the MDGs. This report undertakes a review of Bank health programs in Africa over this timeframe. This report discusses how the Bank has invested in health on the continent, and examines how its strategies for health have shifted over the past fifteen years. This includes an examination of project data over that time and a sampling of project documents intended to take a closer look at implementation approaches.
Background
The World Bank is one of the primary drivers of development in emerging economies in the world. The Bank provides nations with loans, credits, and grants in order to, “support a wide array of investments in areas such as education, health, public administration,
infrastructure, financial and private sector development, agriculture, and environmental and natural resource management.”1 Bank staff also provides technical assistance to those working on development in different sectors within these countries. Through its history, the Bank has had considerable influence in development work on the African continent. Since 1947, the Bank has implemented 12,419 projects in 173 countries, with more than 3,500 of these taking place within Africa.2,3 This trend has continued today, as the World Bank currently has 1,724 projects – with 567 of these on the African continent, more than any other single continent.4
That the World Bank is heavily involved in African development is not a coincidence. Following the Berlin Conference of 1885, much of Africa was divided and placed under the control of the various European colonial powers: Great Britain, France, Germany, Belgium, Italy, Spain, and Portugal. In fact, by the early 20th century, the only part of Africa not under colonial rule was present day Ethiopia, which would be invaded by Italy in the 1930s. The decolonization movement followed the end of World War II, as African nations broke away from their
that their infrastructure and economies had been neglected by the extractive nature of European control. This system had the effect of contributing to European development, while any benefits that accrued to the colonized nations and their native populations were minimal at best.5
The World Bank was conceptualized and developed at the same time as the African independence movements gained steam. The Bank (along with the International Monetary Fund) was conceived at the Bretton Woods Monetary Conference in 1944, and made its first loan to post-War France in 1947.6 By the 1950s and 1960s, the Bank had shifted from assisting with the World War II rebuild, and began contributing to large infrastructure projects in Latin America, Africa, and Asia. In the 1970s the Bank again shifted its focus to poverty reduction.7 This focus on poverty remains today.
The World Bank and Health
While the World Bank’s primary focus is on poverty, the Bank has long acknowledged the crucial role its development works plays in health. In fact, in 1974, one of the Bank’s most successful projects was one that reduced river blindness in 11 West African countries.8 The Bank emerged as a force in global health following its release of The World Development
Report, 1993: Investing in Health. This was the Bank’s sixteenth World Development Report, but the first to focus entirely on health.9 In the report, the Bank recommended a three-pronged approach to government policies for improving health: (1) fostering an environment that enables households to improve health, (2) improving government spending on health, and (3) promoting diversity and competition.10
Since the 1993 report, the World Bank has rapidly expanded its health portfolio.11 In fact, by 2004 the World Bank was committing more than $1 billion annually to health, nutrition, and population projects – making it the largest external funder of health services, and
cementing its importance in the field of global health.12 These numbers have continued to grow, and in 2015 the World Bank committed $3.63 billion to health projects worldwide.13
as World Bank President was widely seen as further evidence that the Bank embraced the importance of health. It was widely noted after Dr. Kim’s election that he was the first Bank president with a development and global health background, as opposed to a political or
financial background.14 The participation of the World Bank as a partner in achieving the United Nations Millennium Development Goals (MDGs) is further evidence that the Bank has played an active role in supporting public health goals. The Bank is also an active partner in the
Sustainable Development Goals (SDGs), which were passed in September 2015 and
built/expanded upon the MDGs.15 The two sets of goals, and the strategies to achieve them, are discussed in more detail below.
The World Bank, Millennium Development Goals, Sustainable Development Goals and Post-2015 Development Agenda
Figure 1 – The Millennium Development Goals18
A focus of the report, and other criticisms made of the MDGs were that the goals themselves were specific and called for resources to be targeted to certain areas (HIV, Malaria, Infant Mortality, etc.) as opposed to addressing determinants of health and developing
comprehensive health systems. As Scott Brown and many others note, this selective approach to health was found to be inadequate for truly addressing the root causes of various health problems.19 The SDGs were designed with these shortcomings in mind.
As the time ran out on the MDGs, the development community came together to
establish how to expand and build on this work. The SDGs were formally articulated for the first time in 2012 at the UN Conference on Sustainable Development in Rio.20 A 30-member working group was formed with representatives nominated by member states and representing the five UN regions. This group met eight times, and in September 2014 submitted a report to the General Assembly, which adopted a resolution concluding that the report was to be the basis for the Sustainable Development Goals.21 The SDGs were subsequently developed and adopted on September 25, 2015 by the General Assembly of the United Nations.22
The goals themselves (see Figure 2) represent a shift in how the development
is that there are 17 goals as opposed to 8; and within the 17 goals there are 169 targets to be met. The SDGs are much more comprehensive than the MDGs. This is particularly apparent with regard to the third goal (good health and wellbeing for all), and is in response to the shortcomings of earlier selective approaches to health. The goal of good health still contains targets related to many of the issues that previously had their own goals under the SDGs (maternal health, HIV, infant/child mortality), but this goal now also includes a focus on targets that require system wide improvements – such as universal health coverage and building the health workforce.23
Figure 2 – The Sustainable Development Goals24
“Promote shared prosperity by fostering the income growth of the bottom 40% for every country.”27 Finally, one of the targets for achieving goal three (good health) is the same as the Bank’s primary health goal of universal health coverage.28
Vertical verses Horizontal Approaches to Health
Through the history of global health there has been tension in how to best implement policies and interventions to achieve improvements in health outcomes. Over time,
interventions implemented by such groups as the World Bank and the World Health
Organization (WHO) tended to fall into one of two categories: vertical or horizontal. Vertical strategies, also known as selective approaches, tend to focus on the targeting of specific health interventions that are not delivered or fully integrated into the health system.29 One example of a vertical strategy is fighting polio only through the provision of vaccines. In contrast, horizontal approaches to health are delivered through the country’s health system (or other agencies) and focus on the underlying determinants of health.30 Examples of horizontal approaches include those interventions that focus on primary health care, or on other determinants of health including housing, income, the environment, or equality.
Historically, the preference between vertical and horizontal strategies has fluctuated. The World Health Organization used vertical approaches in attempts to eradicate both malaria and smallpox in the 1950s and 1960s.31 While the WHO and its member countries succeeded in its efforts against smallpox, it failed to do so against malaria. In examining why its failure to stop malaria was so complete, the WHO noted that a successful response to malaria required efficient health systems and infrastructure complete with accessible primary and preventive care.32 This realization led the WHO to refocus its efforts on primary health care, which manifested in 1978 with the call of “Health for All in the Year 2000,” in the Declaration of Primary Health Care that emerged from a conference in Alma-Ata, in the Soviet Union.33
largely from the Bank’s adherence to the Washington Consensus (so called because it was devised by the Bank and IMF), which favored drastic cuts in public spending, privatization of markets, decentralization, and less government involvement in market activities.35 Given that horizontal interventions tend to require public investment in social services these strategies clashed with the Bank’s preference for Washington Consensus policies. Because of its influence, the Bank’s preference for vertical interventions became the primary method to address the HIV crisis both in Bank projects and in strategies used by other donors. It is only recently that the Bank and others have accepted that the focus on vertical interventions is not working, as the Italian Global Health Watch noted in a report to the Italian Government:
Vertical programmes have artificially and temporarily reinforced distribution of services dedicated to specific diseases and interventions (AIDS, malaria,
tuberculosis, etc.), creating absurd and harmful forms of competition between services (e.g. local personnel migrating to more financially attractive agencies) making even more precarious and inefficient the work of already fragile basic health systems.36
World Bank President Jim Yong Kim echoed the need for approaches that address the entire health system shortly after his election in 2012. In a July 2012 speech, Kim noted the move away from previous strategies for confronting HIV/AIDS and said, “The discussion is moving in a great direction…I think the most important thing is…that we have to understand this as a systems and delivery problem and not as a disease problem.”37 Kim added in this speech that this was the direction in which he would like to see the World Bank move.38
Specific Aims - The Way Forward for the World Bank on Health
seeks to understand how World Bank health projects have evolved in this context, the lessons it has learned, and how it is shifting its strategies as the work on the SDGs begins.
Specific Aim #1 – Determine how the World Bank’s health goals have evolved since the advent of the Millennium Development Goals
As discussed in the overview, the World Bank acknowledges its role in helping countries achieve public health goals. The first aim of this paper is to determine exactly how the World Bank is working to help countries achieve public health goals, and to determine if and how these goals have evolved since the start of the Banks work on the MDGs in 2000 to the beginning of the SDGs today. As discussed below, this involved an in-depth review of World Bank programs and projects over multiple years.
The World Bank maintains a detailed database on its programs, though the number is extensive – over 5000 projects in Africa alone. To narrow the scope, this report focuses only on health projects in Africa. It is important to note that with regards to Bank projects, “Africa” includes sub-Saharan Africa and West Africa. The Bank groups countries in Northern Africa (Egypt, Morocco, Tunisia, etc.) with the Middle Eastern nations for the purposes of evaluating its project portfolio.
The review also charts how Bank health projects in Africa have shifted in focus over the past fifteen years, as the development agenda has transitioned from the MDGs to the SDGs. As discussed below, this paper includes an analysis of evidence indicating if the themes of these projects have moved from a more selective or vertical approach to health (i.e. Child health, HIV/AIDS), to an approach focused more on health systems strengthening (i.e. health system performance, population health).
Specific Aim #2 – Determine whether the changes identified in the data are due to actual changes in strategy
through a closer look at a sample of specific projects implemented by the Bank over the past fifteen years. This includes an analysis of project documents that discuss strategies and interventions that cannot be deduced just by reviewing the data. This paper compares the strategies detailed in the project documents with the public comments by Bank officials discussed earlier in order to determine if this focus on systems is actually occurring.
Methods
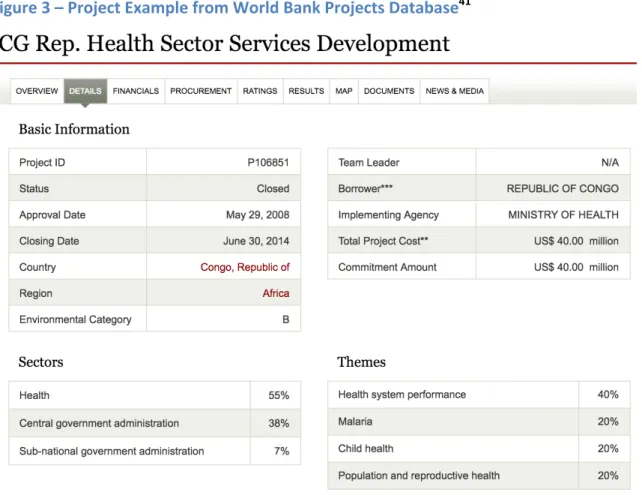
To address the questions posed above, I conducted an extensive data review of World Bank health programs implemented in Africa since the beginning of the MDGs in September of 2000. I considered all health programs that were implemented in Africa with an approval date of September 1, 2000 to the present day, and included both active and closed projects, for a total of 420 projects.
Figure 3 – Project Example from World Bank Projects Database41
To determine how Bank projects evolved over time, I paid close attention to the
a specific approach to these themes as both vertical and horizontal approaches have routinely been used to address them. Finally, themes with no direct link to health were classified as ‘other’. While the themes in this classification were not directly tied to health, often they addressed other determinants of health (i.e. ‘Education for All’ and ‘Rural Services and Infrastructure’).
While the percentages and frequencies of different themes, and how they shift between 2000-2015, may provide some insight into how Bank priorities changed over that time, this information alone was not sufficient to make a confident conclusion about how Bank strategies had evolved. To complement the data and determine its accuracy, I also sampled two projects from each year, thirty-two projects total. To determine the projects on which to perform a document review, I took a purposive sample of the different projects. Factors that were considered in determining which projects to include in the sample were:
• Percentage of the project funds designated to the health sector verses other sectors.
The review includes some projects that were 100% funded for the health sector, and others that were as low as 6%. This was to get a sense of how strategies varied if the project funds were focused mostly to other sectors.
• Percentage of the project dedicated to each theme. The review includes a mix of
projects that based on the percentages allocated to the different themes appear to be more horizontal, vertical, or a mixture of the two.
• Total cost and total Bank commitment. As with the database, many of the projects
sampled were financed mostly or entirely by the Bank. There was care to include some projects where the Bank was one partner on a larger project. The largest project included was one in Tanzania, where the Bank provided $100,000,000 out of a total of $2,721,800,000.
• Other factors included care to vary the projects by country, project title (i.e. not
selecting too many HIV/AIDS projects), and duration.
The documents reviewed were generally either final reports for projects that had been
Results
This section looks at the data that resulted from the project review performed on the World Bank project’s database. It also analyzes the data, and highlights where certain shifts or trends appear in different themes, sectors, and other variables. This section also discusses the results from the document review of selected World Bank projects, and compares those findings to the trends suggested by the data.
Project Review
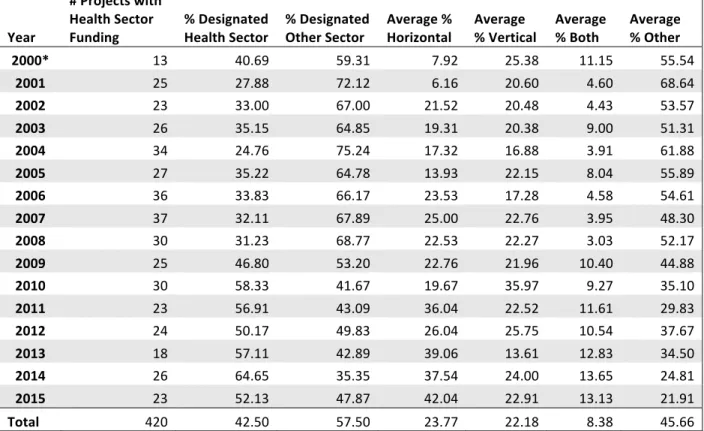
The results of the project review showed a distinct increase in the average percentage of funds in health sector projects that were designated to the health sector, as opposed to another sector. This percentage figure is important because it is tied to the level of funding designated for each sector contained within the project. So while each of these projects was designated health sector, many also had percentages designated to other sectors. As time passed, the average percentage of each project that included the health sector saw the percentage of funding designated to the health sector jump from 31.23% in 2008 to 46.8% in 2009, and continued to climb (see Table 1). This shift seems to indicate a trend, as prior to 2009 the average health project saw about one-third of the project funding designated to the health sector as opposed to others. After 2009, the funding designated to the health sector in these projects was consistently over fifty percent.
Table 1 – Percentage of Project Spending By Designation and Theme
Year
# Projects with Health Sector
Funding % Designated Health Sector % Designated Other Sector Average % Horizontal Average % Vertical Average % Both Average % Other
2000* 13 40.69 59.31 7.92 25.38 11.15 55.54
2001 25 27.88 72.12 6.16 20.60 4.60 68.64
2002 23 33.00 67.00 21.52 20.48 4.43 53.57
2003 26 35.15 64.85 19.31 20.38 9.00 51.31
2004 34 24.76 75.24 17.32 16.88 3.91 61.88
2005 27 35.22 64.78 13.93 22.15 8.04 55.89
2006 36 33.83 66.17 23.53 17.28 4.58 54.61
2007 37 32.11 67.89 25.00 22.76 3.95 48.30
2008 30 31.23 68.77 22.53 22.27 3.03 52.17
2009 25 46.80 53.20 22.76 21.96 10.40 44.88
2010 30 58.33 41.67 19.67 35.97 9.27 35.10
2011 23 56.91 43.09 36.04 22.52 11.61 29.83
2012 24 50.17 49.83 26.04 25.75 10.54 37.67
2013 18 57.11 42.89 39.06 13.61 12.83 34.50
2014 26 64.65 35.35 37.54 24.00 13.65 24.81
2015 23 52.13 47.87 42.04 22.91 13.13 21.91
Total 420 42.50 57.50 23.77 22.18 8.38 45.66
*Projects from year 2000 are those that started on or after September 1 of that year.
The health related themes and the percentage of project funding devoted to each, mirrored this shift, although not as dramatically. Between 2000 and 2008, an average of 17.47% of health project expenditures targeted horizontal strategies. Between 2009 and 2015, an average of 31.88% of health project expenditures targeted horizontal strategies. The average percentage of project spending devoted to vertical themes stayed relatively consistent over time, with an average of 20.9% from 2000-2008 and an average of 23.82% between 2009-2015. The average percentage of project funds designated to strategies that could be considered both vertical or horizontal also jumped in 2009, and seemed to indicate a trend. This percentage was 5.85% between 2000-2008, increasing to 11.63% between 2009-2015. The increases in health related themes was naturally offset by severe decreases in spending devoted to non health-related themes. The percentage of spending dedicated to ‘other’ non-health themes in health projects was 55.77% between 2000-2008, and was 32.67% between 2009-2015.
and the average total cost (funds contributed to the project by the Bank plus other partners). Table 2 shows the average percentage contribution by the Bank to each health project (Average % of each project financed by the World Bank). The next column (Average % of total cost
financed by World Bank) details the average percentage of the total cost of all projects that year financed by the Bank.
Table 2 – Project Duration and Financing
Year
# of Health Projects
Average Project Length (months)
Average Bank Commitment (USD)
Average Total Cost (USD)
Average % of each Project Financed by World Bank
Average % of Total Cost Financed by World Bank
2000 13 46.31 32,323,107.69 40,145,384.62 88.79 80.52 2001 25 58.32 55,377,200.00 98,641,600.00 89.60 56.14 2002 23 58.39 68,170,000.00 77,712,608.70 86.12 87.72 2003 26 59.40 48,129,230.81 143,486,538.50 77.14 33.54 2004 34 56.47 58,188,235.29 90,480,294.12 85.66 64.31 2005 27 42.20 45,094,814.81 53,880,000.00 88.15 83.69 2006 36 34.17 45,463,333.33 123,754,444.44 85.05 36.74 2007 37 34.76 42,468,108.11 87,815,945.95 89.79 48.36 2008 30 33.88 44,649,000.00 51,902,333.33 95.42 86.03 2009 25 36.98 67,197,600.00 257,809,600.00 81.84 26.06 2010 30 42.42 42,308,000.00 46,168,333.33 96.34 91.64 2011 23 32.13 43,164,782.61 194,386,086.96 78.50 22.21 2012 24 36.92 66,141,666.67 262,400,416.67 85.84 25.21 2013 18 43.14 46,844,444.44 56,275,000.00 84.04 83.24 2014 26 36.08 58,939,615.38 66,912,692.31 90.96 88.08 2015 23 37.80 96,860,434.78 291,308,260.87 90.40 33.25
Totals 420 43.09 53,832,473.37 121,442,471.24 87.10 59.17
2009-2015 period. The average percentage the Bank contributed remained stable between 2000 and 2015, at about eighty-seven percent. The percentage of the total amount dedicated to health projects each year financed by the Bank was 64.12% between 2000-2008. This figure declined to 52.81% from 2009-2015.
Table 3 shows the frequency with which different horizontal project themes appeared over time.* These were themes that were classified as requiring a systems strengthening approach. For ease in identifying trends, this frequency table has been divided into four increments of four years.
Table 3 – Frequency and Percentage of Horizontal Themes in Health Projects by 4-year span
Theme # Projects 2000-2015 Total: 420 # Projects 2000-2003 Total: 87 # Projects 2004-2007 Total: 134 # Projects 2008-2011 Total: 108 # Projects 2012-2015 Total: 91
Social Safety Nets (10.24%) 43 (9.20%) 8 (9.70%) 13 (12.04%) 13 (9.89%) 9 Health System
Performance (46.43%) 195 (29.89%) 26 (48.51%) 65 (48.15%) 52 (57.14%) 52 Pollution Management
and Environmental
Health (16.67%) 7 (2.30%) 2 (1.49%) 2 (1.85%) 2 (1.10%) 1
Social Risk Mitigation
17 (4.05%) 6 (6.90%) 10 (7.46%) 0 (0%) 1 (1.10%) Vulnerability Assessment and
Monitoring (2.62%) 11 (4.60%) 4 (2.24%) 3 (1.85%) 2 (2.20%) 2 Natural Disaster
Management (3.33%) 14 (3.45%) 3 (5.22%) 7 (1.85%) 2 (2.20%) 2 Other Social
Protection and Risk
Management (7.86%) 33 (6.90%) 6 (10.45%) 14 (3.70%) 4 (9.89%) 9 Nutrition and Food
Security (14.29%) 60 (8.01%) 7 (8.96%) 12 (13.89%) 15 (28.57%) 26
Totals 380 62 126 90 102
As shown in the table, the most frequent horizontal theme was health system
performance. It consistently appeared the most often each year, and after a significant jump from the first quartile to the second quartile, it jumped again to appearing in 57.14% of health projects to be implemented over the last four years of the analyzed time period. The only other
*It is important to note when reviewing the thematic tables that in each project there could be
theme that appears to show a trend over time is that of nutrition and food security, which jumped slightly between the second and third quartiles, and then more than doubled (as a percentage of total projects in which it appeared) in the last four years.
Table 4 shows the frequency of different vertical interventions. Project themes classified as vertical were those that have traditionally leant themselves to selective, top-down
interventions. Additionally, many of these themes appeared as goals in the MDGs.
Table 4 – Frequency and Percentage of Vertical Themes in Health Projects by 4-Year Span
Theme # Projects 2000-2015 Total: 420 # Projects 2000-2003 Total: 87 # Projects 2004-2007 Total: 134 # Projects 2008-2011 Total: 108 # Projects 2012-2015 Total: 91 HIV/AIDS 95 (22.62%) 36 (41.40%) 28 (20.90%) 23 (21.30%) 8 (8.79%)
Gender (10.71%) 45 (29.89%) 26 (6.72%) 9 (1.85%) 2 (8.79%) 8
Child Health 106 (25.24%) 13 (14.94%) 24 (17.91%) 29 (26.85%) 40 (43.96%)
Malaria (10.00%) 42 (5.75%) 5 (9.70%) 13 (12.96%) 14 (10.99%) 10
Tuberculosis (4.76%) 20 (2.30%) 2 (5.97%) 8 (6.48%) 7 (3.30%) 3 Other Communicable
Diseases (8.33%) 35 (1.15%) 1 (11.19%) 15 (7.41%) 8 (12.09%) 11
Totals 343 83 97 83 80
As the table shows, there is substantial movement in the first three vertical themes over time. The themes of gender and HIV/AIDS appear in a fairly high percentage of all health projects in the 2000-2003 time period. Gender and HIV/AIDS fall sharply after the first four years, and then fall sharply again after the third quartile. Child health, on the other hand jumps in the third quartile, and then again in the fourth. Malaria and other communicable diseases show some movement, but because the project numbers are so small, it is hard to determine whether or not a trend exists.
Table 5 – Frequency of Both Themes in Health Projects by 4-Year Span
Theme
# Projects 2000-2015 Total: 420
# Projects 2000-2003 Total: 87
# Projects 2004-2007 Total: 134
# Projects 2008-2011 Total: 108
# Projects 2012-2015 Total: 91
Population and
Reproductive Health (28.3%) 119 (27.59%) 24 (23.88%) 32 (25.93%) 28 (38.46%) 35 Injuries and
Non-Communicable
Diseases (0.012%) 5 (0%) 0 (0.0075%) 1 (00.93%) 1 (.033%) 3
Totals 124 24 33 29 38
As Table 5 shows, the only ‘both’ theme to appear regularly was population and
reproductive health. Over time, population and reproductive health appeared fairly consistently for the first 12 years analyzed, it jumped sharply, however, over the last four years.
Table 6 – Frequency and Percentage of Top 10 Most Frequently Appearing Other Themes in Health Projects by 4-Year Span
Theme # Projects 2000-2015 Total: 420 # Projects 2000-2003 Total: 87 # Projects 2004-2007 Total: 134 # Projects 2008-2011 Total: 108 # Projects 2012-2015 Total: 91 Public Expenditure, Financial Management, and
Procurement (22.38%) 94 (25.29%) 22 (28.39%) 38 (23.15%) 25 (9.89%) 9 Participation and Civic
Engagement (21.43%) 90 (40.23%) 35 (23.88%) 32 (13.89%) 15 (8.79%) 8 Rural Services and
Infrastructure 86 (20.48%) 21 (24.14%) 36 (26.87%) 19 (17.59%) 10 (10.99%)
Education for All (19.29%) 81 (18.39%) 16 (28.39%) 38 (16.67%) 18 (9.89%) 9
Decentralization 62 (14.76%) 11 (12.64%) 27 (20.15%) 18 (16.67%) 6 (6.59%) Administrative and
Civil Service Reform (9.29%) 39 (10.34%) 9 (14.93%) 20 (5.56%) 6 (4.40%) 4 Conflict Prevention
and Post-conflict
Resolution (7.38%) 31 (14.94%) 13 (8.96%) 12 (1.85%) 2 (4.40%) 4 Regulation and Competition Policy 23 (5.48%) 7 (8.05%) 7 (5.22%) 6 (5.56%) 3 (3.30%) Infrastructure Services
for Private Sector
Development (4.76%) 20 (4.60%) 4 (5.22%) 7 (6.48%) 7 (2.20%) 2 Other Human Development 20 (4.76%) 1 (1.15%) 13 (9.70%) 6 (5.56%) 0 (0%)
Totals 546 139 230 122 55
This table shows that many of these themes appeared at already high levels in the first quartile (2000-2003), and remained the same or jumped in the second quartile (2004-2007). Almost every single one of these themes dropped in the third quartile (2008-2011), with the exception of one that remained at the same level. Every single theme fell once again going into the fourth quartile (many by over half), with the exception of one, which rose from two in the third quartile to four in the fourth quartile.
most frequent other sectors to appear, each of these appeared on average close to at least twice a year over the total span.
Table 7 – Frequency and Percentage of Top 11 Most Frequently Appearing Other Sectors in Health Projects Sector # Projects 2000-2015 Total: 420 # Projects 2000-2003 Total: 87 # Projects 2004-2007 Total: 134 # Projects 2008-2011 Total: 108 # Projects 2012-2015 Total: 91
Other Social Services (37.86%) 159 (43.68%) 38 (44.78%) 60 (34.26%) 37 (26.37%) 24 Central Government
Administration (37.62%) 158 (64.38%) 56 (46.29%) 62 (25.93%) 28 (13.19%) 12
General Education Sector (24.05%) 101 (33.33%) 29 (26.87%) 36 (22.22%) 24 (13.19%) 12 Sub-national Government
Administration (17.86%) 75 (21.84%) 19 (23.88%) 32 (13.89%) 15 (9.89%) 9
Primary Education 59 (14.05%) 11 (12.64%) 33 (24.63%) 6 (5.56%) 9 (9.89%) General Water, Sanitation
and Flood Protection
Sector (12.38%) 52 (12.64%) 11 (13.43%) 18 (12.96%) 14 (9.89%) 9 General Public
Administration Sector (12.38%) 52 (12.64%) 11 (20.90%) 28 (3.70%) 4 (9.89%) 9 Public Administration-
Health (12.38%) 52 (0%) 0 (0%) 0 (23.15%) 25 (29.67%) 27 General Agriculture,
Fishing, and Forestry
Sector (11.90%) 50 (17.24%) 15 (10.45%) 14 (11.11%) 12 (9.89%) 9 General Industry and
Trade Sector (6.90%) 29 (5.75%) 5 (55.17%) 16 (4.63%) 5 (3.30%) 3
Water Supply (6.67%) 28 (6.90%) 6 (9.70%) 13 (7.41%) 8 (1.10%) 1
Totals 815 201 312 178 124
The trends of the other sectors follow the trends of the other health themes very closely. Almost every sector on the table remains the same or increases from the first quartile to the second. Similarly almost every sector on the table falls from the second quartile to the third, and then falls again from the third quartile to the fourth. The one sector that is
Document Review
The document review helped to validate the accuracy of the themes as suggestive of the approach and strategy used by the Bank. As discussed in the methods section, the document review involved profiling thirty-two World Bank projects, two per year (see Appendix 1). I took a purposive sample of the projects in order to chose those that are representative of the Bank’s full portfolio of projects involving the health sector from 2000-2015.
In reviewing these projects it was possible to get a better sense of the project objectives, and components. Additionally, it was possible to determine how the money was being spent, the strategies the Bank was using to achieve its objectives, and the indicators it was using to evaluate success. Of the 32 projects sampled, fourteen were primarily vertical, five were horizontal, eleven were diagonal (elements of both strategies, discussed in detail in the next section), and two were neither. The distribution of the strategies seems to match the data above, as twelve of the fourteen vertical projects appeared between 2000-2009, and eight of the elven diagonal projects appeared from 2009-2011. The horizontal only projects were fairly evenly distributed.
Discussion
The data and the document review point to two major dates where the Bank strategy on health appears to shift: 2009 and 2012. It is in 2009 that the percentage allocated to the health sector really begins to increase, and it is in 2012 that the shift to a higher percentage of horizontal and both themes begins to occur, and the corresponding drop in other themes also occurs. Additionally, in recent years the average Bank commitment to health projects has increased, though the number of health projects taken on per year has decreased slightly. Throughout the entire time reviewed the Bank generally commits the majority of the funds to projects it undertakes. While in a given year Bank commitments may only reflect 20-30% of the total spent on health projects in which the Bank participated, this is often due to one large (often multi-billion dollar) project, for which the Bank was a partner and funding a low
funds available the focus is generally far more systems oriented than some of the smaller projects that are principally Bank funded. The document review included a couple of these projects, and the strategies within them tended to be far more horizontal or diagonal.
The concept of diagonal interventions is another thing that arose from the document review. For the purposes of this paper, a project classified as using diagonal strategies is one that incorporates aspects of both vertical and horizontal health interventions. Often this manifests in one of two ways. The first is that the project objectives are focused on
strengthening health systems, but the indicators to measure success are vertical. An example of this from the project review (see Appendix A) was one in Sudan that focused on improving access to primary care services. While many of the project strategies involved horizontal strategies for system improvement such as building new facilities and training primary care workers, the indicators were more vertical such as the number of insecticide-treated nets disseminated. The other way diagonal programs appear is using horizontal strategies to address a certain health issue. For example, in one HIV/AIDS project the Bank sought to combat the virus by training more health care staff, building more facilities, and improving access to care. In this case, the strategies are ones that would seem horizontal at first glance in that they could strengthen the entire system, but they are being applied only to one condition. As noted in the results of the document review, the number of diagonal interventions appeared to increase in 2009 as well. Of the two projects per year selected for a document review from 2009 to 2015, at least one of the projects each year was categorized as diagonal.
at first glance, considering that many of non-health specific ‘other’ themes and sectors deal with determinants of health, it raises the question that maybe these themes and sectors should be even further integrated into health projects.
This leads to another observation from the document review, which is the apparent lack of coordination between Bank projects operating within the same country. Some of the project documents reviewed made mention of other health projects operating within the country where the new project was being implemented. There was, however, little discussion about how the new health project would integrate with the already ongoing projects. Furthermore, there was no discussion about how the health projects would relate to other World Bank projects operating in the country or region that did not relate to the health sector at all. In order to take a horizontal approach that truly integrates health into development, coordination of different World Bank projects in the same country would seem to be a logical step. That the Bank struggles to break from silos in its own work does not bode well when considering the other non-state actors implementing health projects in the same countries. One of the key criticisms of vertical interventions is often that it can lead to duplication of efforts, which wastes time and money. This lack of coordination does little to assuage those fears.
An additional question raised by the data is why do the shifts appear to be so stark in 2009 and 2012? It is hard to cite one event that definitively caused the shift, but reviewing some big events in global health offers some clues. The shift that started in 2009 may be attributed to major outbreaks of avian flu that struck a year or two prior. Several project titles in that timeframe address avian flu, and the thematic data pulled from these projects often points to horizontal or diagonal strategies. One avian flu project in particular focused on strengthening systems and also integrated avian flu prevention into the agricultural sector. Avian flu, and how it spreads, is not easily solved by dissemination of vaccines or other
standard vertical interventions, as a result this may have caused an additional focus on systems strengthening.
background, is a physician himself, and has spoken of the need for systems strengthening. It is possible that the Bank was already trending that way, before Kim arrived and helped to move it further in this direction.
Even more recently than Dr. Kim’s election was the Ebola crisis in West Africa in the Summer of 2014. Sierra Leone, Liberia, and Guinea, all nations with weak health systems, were profoundly affected, while states with stronger health systems such as Nigeria and Senegal were able to mitigate the damage caused by the virus. Like avian flu before it, this case was illustrative of the importance of strong health systems. There were a few projects geared at addressing Ebola towards the end of the time period reviewed, but the effects of lessons learned from the crisis may not yet be reflected in the data.
Finally, another thing that may explain this shift is the arrival of many other non-state actors on the scene. As noted above, in 2004 the World Bank was the largest external funder of health projects. The Bank still provides a tremendous amount of money to health projects, but it has been joined by a number of other groups that bring in a significant amount of money. The President’s Emergency Plan for AIDS Relief (PEPFAR) started work against HIV/AIDS in 2004, and grew in 2008 as it was renewed and its budget was expanded.42 This perhaps explains the trend shown in Table 4, which shows the number of HIV/AIDS World Bank projects falling sharply after 2008. Additionally, the mid-2000s saw the increased influence of the Bill & Melinda Gates Foundation in the areas of malaria, polio, and other communicable diseases; and the Global Fund to Fight AIDS, Tuberculosis, and Malaria. This perhaps explains why the only vertical theme to increase substantially in the latter half of the MDG era was the child health goal, as the Bank partnered with and ceded ground on some of these other vertical issues to other actors.
Conclusion
in its work. In a recent speech, World Bank President Kim noted that in order for the Bank to reach its goals, “three things have to happen – inclusive economic growth, investment in human beings, and insurance against the risk that people could fall back into poverty.”43 Nowhere in that quote is the term health, but it is easy to see where progress in those three areas would lead to better health outcomes for millions of people. To borrow an economic term, this is the comparative advantage of the Bank when compared to other non-state global health actors. The Bank does not only focus on the health sector. In order to realize its goals the Bank can help countries improve its water supply, it can help countries build safer roads, and it can help countries support agricultural development. It is a well known public health trope that the health system only determines a small percentage of the health outcomes experienced by a population. The Bank, more so than any non-state actor can integrate health goals into work on the broader determinants of health.
The results of the data analyzed in this paper, however, suggest that the Bank is not yet all the way there. The Bank does appear to have shifted its health work in the last fifteen years, and the rhetoric of Bank leaders lends credence to its desire to shift towards a more integrated approach. The strategies even do appear to be moving in a more horizontal direction, even if that direction manifests more often in the diagonal interventions discussed above. This is perhaps not surprising, the Bank and other global health actors have decades of experience in performing vertical health interventions. Given this previous experience, it is possible that this recent shift towards systems is indicative of a coming or continuing change to its strategies, and that it will become even more pronounced in the coming years as the Bank works to achieve the Sustainable Development Goals.
This is not to say that vertical health interventions, or their inclusion with horizontal strategies in diagonal programs are a bad thing, or that they have no place. Some vertical health interventions over time have been very successful. It is encouraging, however, that there appears to be more care to integrate these efforts into larger system-wide improvements than having them as standalone interventions.
not even discuss how it will integrate a new health project into existing health projects in one country. If the Bank can break out of its own silos, with health and then with other sectors, it can possibly come up with more comprehensive projects that will not only improve health but the other sectors that drive the determinants of health. It is hard to conceptualize what this might look like, and it may even require a revolutionary change of strategy in how it lends to countries and the way it designs its projects. There is a reason global health actors have not favored horizontal strategies over time, they expensive and they are hard to implement and evaluate. They also take years to show results. Conversely, there is also a growing body of evidence on the limitations of vertical interventions. With its increased use of diagonal
approaches the World Bank seems to be moving slowly in this direction, and if this work shows results the Bank may have the evidence it needs to move further in a horizontal direction. Right now, however, the data suggests that it is too early to tell. Regardless, if the MDGs taught the development community anything, it is that in order to achieve the SDGs new approaches are necessary. It will be interesting to see if and how the World Bank translates this into practice over the next fifteen years.
Acknowledgements
I would like to thank Drs. Bruce Fried and Morris Weinberger for their help in
Appendix 1 – Project Document Review and Analysis
Projects Started in 2000
Project: HIV/AIDS, Malaria, STD&TB (HAMSET) Control Project
Country: Eritrea
Date Approved: 12/18/2000
Date Closed: 3/31/2006
Total Bank Commitment: $40,000,000
Total Project Cost: $50,000,000
Percentage Designated Health Sector: 83%
Vertical/Horizontal: One horizontal theme (13% of total), One vertical theme (25% of total), One theme both (25% of total)
Project Document Available:
http://documents.worldbank.org/curated/en/2006/10/7376071/eritrea-hivaids-malaria-std-tuberculosis-hamset-control-project
Analysis:
• Overall objective was to reduce mortality and morbidity caused in Eritrea by several
communicable diseases: HIV/AIDS, malaria, sexually transmitted diseases, and tuberculosis (HAMSET).
• Strategies included:
o Interventions to strengthen the Eritrean government’s ability to collect data and surveillance related to STDs
o Increasing cross-sector communication and collaboration to better address this issue
o Promote healthy behaviors, and develop a system to track changes in attitudes.
o Enhance access to preventive services
o Promote cost-effective techniques for Malaria vector control
o Establish safe blood banks
o Improve availability of medical materials and drugs required to diagnose and
treat HAMSET
• Achievements from this project included a reduction in malaria-related morbidity and
mortality, possible stabilization of the HIV epidemic in Eritrea (though not a decline in prevalence), and good progress on implementation of Directly Observed Treatment Short-course (DOTS) services for those with TB.
Conclusion: This project has elements that are horizontal and contribute to systems
strengthening – but the focus on HAMSET and on administering interventions aimed directly at malarial vectors, provision of drugs, and DOTS for TB have the hallmarks of vertical
Project: Supplemental Credit to Health & Population
Country: Rwanda
Date Approved: 12/21/2000
Date Closed: N/A
Total Bank Commitment: $7,000,000
Total Project Cost: $7,350,000
Percentage Designated Health Sector: 52%
Vertical/Horizontal: One horizontal theme (34% of total), One vertical theme (33% of total), One theme both (33% of total)
Project Document Available:
http://documents.worldbank.org/curated/en/1991/05/727847/rwanda-first-population-project
Analysis:
• This project, though listed as occurring in 2000, actually provided additional financing to
a project started in Rwanda in 1991.
• The project objectives contributed to the following goals:
o Reduction of total fertility rate from 8.5 to 7.2
o A decrease in maternal and child mortality and morbidity
o Integration of the demographic dimension in the overall socio-economic planning process
• Strategies included:
o Training of Rwandan Ministry of Health agents in contraceptive technology
o Provision of medical equipment, furniture and contraceptives to health centers
o Strengthen monitoring
o Expand promotion of family planning services
o Train community volunteers in family planning services o Support population studies and multisectoral activities
• Reviewing the budget, the majority of the project funds went towards supporting
equipment/materials and contraceptives.
Conclusion: This project is in-line with the classic vertical interventions, from a selective approach to primary care (focus on family planning), to the desire to achieve targeted
Projects Started in 2001
Project: HIV/AIDS Disaster Response
Country: Burkina Faso
Date Approved: 7/6/2001
Date Closed: 6/30/2007
Total Bank Commitment: $22,000,000
Total Project Cost: $23,500,000
Percentage Designated Health Sector: 74%
Vertical/Horizontal: One horizontal theme (14% of total), Two vertical themes (43% of total), One theme both (14% of total)
Project Document Available:
http://documents.worldbank.org/curated/en/2007/12/9117573/burkina-faso-hivaids-disaster-response-project
Analysis:
• The overall objective was to assist the government in implementing a 2001-2005
HIV/AIDS strategic plan.
• Strategies designed to achieve this goal included:
o The scale up and expansion of HIV prevention activities to lower risks of transmission
o Strengthen capacity to provide care/treatment to those with HIV/AIDS
o Mitigate the socio-economic effect the epidemic is having on households and communities
• This program included a number of indicators including:
o Reduction in the percentage of non-married individuals who report having two or more sexual partners
o Increase of condom utilization rates
o Decrease the percentage of persons living with HIV/AIDS who report cases of discrimination and stigmatization
o Several other indicators related to healthy sexual practices and provision of treatment
Project: Multisectoral STI/HIV/AIDS Prevention I Project
Country: Madagascar
Date Approved: 12/14/2001
Date Closed: 12/31/2007
Total Bank Commitment: $20,000,000
Total Project Cost: $21,000,000
Percentage Designated Health Sector: 77%
Vertical/Horizontal: Zero horizontal themes (0% of total), Two vertical themes (60% of total), One theme both (20% of total)
Project Document Available:
http://documents.worldbank.org/curated/en/2008/06/9799515/madagascar-multisectoral-stihivaids-prevention-project
Analysis:
• The goal of this project was to help Madagascar develop and promote a multisectoral
response to the HIV/AIDS crisis and to contain the spread of the disease.
• There were four project components:
o Financial assistance to the development of sector plans and pilots
o A fund for STI/HIV/AIDS prevention and non-medical activities
o Monitoring and evaluation
o Program management and strengthening of institutional and organizational capacity
• Data indicators included:
o Increase in condom use among both general population and commercial sex
workers
o Reduction in people who report having at least one sex partner other than a
regular partner over twelve months
o Decrease in prevalence of gonorrhea
o Increase in knowledge related to safe sexual practices
o Increase in the number of condoms distributed
Projects Started in 2002
Project: HIV/AIDS Response Project
Country: Sierra Leone
Date Approved: 3/26/2002
Date Closed: 12/31/2007
Total Bank Commitment: $15,000,000
Total Project Cost: $15,300,000
Percentage Designated Health Sector: 87%
Vertical/Horizontal: Zero horizontal themes (0% of total), Two vertical themes (43% of total), Zero themes both
Project Document Available:
http://documents.worldbank.org/curated/en/2008/06/9739979/sierra-leone-hivaids-response-project
Analysis:
• The project objective was to support Sierra Leone’s efforts to organize a multisectoral
response to the HIV/AIDS crisis.
• Data indicators included:
o Increase of condom utilization
o Increase in knowledge around healthy sexual behaviors
o Increase in the capability of hospitals to be able to provide treatment and care of opportunistic infections (OIs)
o Increase in the number of health facilitators with incinerators
o Increase in the provision of mother-to-child transmission prevention services
o Increase in percentage of public sector agencies incorporating HIV/AIDS prevention into their work plans and budgets
Project: Second Health Systems Development
Country: Nigeria
Date Approved: 6/6/2002
Date Closed: 5/30/2012
Total Bank Commitment: $127,010,000
Total Project Cost: $153,220,000
Percentage Designated Health Sector: 88%
Vertical/Horizontal: One horizontal theme (23% of total), Two vertical themes (44% of total), One theme both (22% of total).
Project Document Available:
http://documents.worldbank.org/curated/en/2012/12/17097791/nigeria-additional-financing-second-health-systems-development-project
Analysis:
• The project originally sought to assist Nigerian Health authorities in efforts to fix their
provision of basic health care services and to strengthen the Nigerian health system, which was failing.
• The project was then revised to strengthen the capacities for management of the health
system at the State level, improve the delivery of primary and secondary health care services (particularly those related to maternal and child health), and strengthen policy formulation for provision of secondary health services at the Federal level.
• Project indicators included:
o Number of states with approved three-year work plans
o Percentage of states having developed state health accounts
o Percentage of states routinely linking State health plans with annual budgets o Percentage of 1-2 year old children that are fully immunized.
o Percentage of women attending ante-natal clinics
o Percentage of health staff at primary health care facilities trained in integrated management of childhood illness (IMCI) and DOTS
Projects Started in 2003
Project: Second Health Sector Program Support Project
Country: Ghana
Date Approved: 2/6/2003
Date Closed: 6/30/2007
Total Bank Commitment: $89,600,000
Total Project Cost: $1,113,000,000
Percentage Designated Health Sector: 100%
Vertical/Horizontal: One horizontal theme (33% of total), Two vertical themes (34% of total), One theme both (17% of total).
Project Document Available:
http://documents.worldbank.org/curated/en/2007/12/9113030/ghana-second-health-program-support-project-hspsp-ii
Analysis:
• The primary goal of this project was to improve the overall health status of the
population while reducing geographic, socioeconomic, and gender inequalities in health outcomes.
• The project sought to do this by improving access, quality, and efficiency of services –
including enhancing existing infrastructure, reforming financing of the health system, and developing human resources.
• Data indicators included:
o The infant mortality rate (later determined not to be an appropriate indicator)
o Under 5 mortality rate
o Supervised deliveries
o Percentage of Ghanaian recurrent budget spent on health o Outpatient visit per capita
Conclusion: The strategies and objectives are far more inline with horizontal approaches than any of the above profiled projects. The lack of indicators around the health system also speak to the difficulty present in measuring these interventions, and partially explains why it instead chose to measure infant mortality and under 5 mortality. It is telling that the outcome of this project was rated “moderately unsatisfactory” by the Bank, as it noticed there were
Project: Partnership for Polio Eradication Project
Country: Nigeria
Date Approved: 4/29/2003
Date Closed: 4/30/2012
Total Bank Commitment: $28,700,000
Total Project Cost: $157,100,000
Percentage Designated Health Sector: 100%
Vertical/Horizontal: One horizontal theme (33% of total), One vertical theme (67% of total),
Project Document Available:
http://documents.worldbank.org/curated/en/2011/02/13848823/nigeria-third-additional-financing-partnership-polio-eradication-project
Analysis:
• The Bank financed this project with a number of other partners including the Bill and
Melinda Gates Foundation, Rotary International and the US Centers for Disease Control and Prevention (CDC). Other funders included the European Union, KfW, UNICEF, and WHO.
• The money is intended primarily to finance the procurement or Oral Polio Vaccine. • The project focused primarily on timely arrival of the vaccine, as well as immunization
coverage.
Projects Started in 2004
Project: African Regional Capacity Building Network for HIV/AIDS Prevention, Treatment, and Care
Countries: Kenya, Ethiopia, Tanzania
Date Approved: 9/22/2004
Date Closed: 4/30/2010
Total Bank Commitment: $10,000,000
Total Project Cost: $10,000,000
Percentage Designated Health Sector: 85%
Vertical/Horizontal: One vertical theme (100% of total),
Project Document Available:
http://documents.worldbank.org/curated/en/2010/11/14133936/africa-region-african-regional-capacity-building-network-hivaids-prevention-treatment-care-tanzania-project
Analysis:
• This regional based project sought to expand evidence-based HIV/AIDS prevention,
treatment, and care programs.
• The project also supported HIV/AIDS-related health sector human resource capacity
building in the three countries participating.
• Indicators included:
o Number of those who completed training to provide services.
o Increase in percentage of service delivery points
o Number of workers trained in-service
o Total financial resources mobilized
Project: Health Sector Reform Project
Country: Malawi
Date Approved: 12/13/2004
Date Closed: 9/15/2008
Total Bank Commitment: $15,000,000
Total Project Cost: $753,000,000
Percentage Designated Health Sector: 80%
Vertical/Horizontal: One horizontal theme (50% of total), Zero vertical or both themes
Project Document Available:
http://documents.worldbank.org/curated/en/2009/03/10431441/malawi-health-sector-support-project
Analysis:
• The overall objective of the project was to assist in the Malawian Government’s Sector
Wide Approach (SWAp) to improving its health system.
• The goals were to improve effectiveness, efficiency, and equity of the essential health
care delivery system. Three aspects of the health sector were identified as needing particular attention:
o Human resources, as the capacity in this area was extremely low
o Guaranteeing the provision of essential services throughout the country
o Strengthening the systems and support relevant to providing the essential
services
• Project indicators included:
o Percentage of facilities with ability to effectively provide essential health
package (EHP)
o Percentage of budget allocation to health
o Percentage of health facilities without seven day stockpile of essential EHP medicines
o Percentage of staffing positions filled
o Percentage of health facilities regularly supervised by District Health Management Teams
Projects Started in 2005
Project: DRC Health Sector Rehabilitation Support Project
Country: Democratic Republic of the Congo
Date Approved: 9/1/2005
Date Closed: 12/31/2014
Total Bank Commitment: $150,000,000
Total Project Cost: $150,000,000
Percentage Designated Health Sector: 90%
Vertical/Horizontal: One horizontal theme (25% of total), Three vertical themes (62% of total), One theme both (13% of total)
Project Document Available:
http://documents.worldbank.org/curated/en/2015/11/25475801/congo-democratic-republic-health-sector-rehabilitation-support-project
Analysis:
• The goal of the project was to ensure that the target population in selected zones of the
DRC had access to a defined package of essential health services.
• The zones within the DRC that contained the target population were designated Project
Health Zones.
• Project indicators included:
o Percentage of children aged 0-11 months who received DPT3 vaccinations
o Percentage of children aged 12-23 months who received Oral Polio Vaccine
o Deliveries by assisted qualified personnel
o Percentage of women 15-49 years that are new users of family planning
o Percentage of under-five children and pregnant women sleeping under insecticide-treated nets
o Total number of polio cases
o Number of health personnel receiving training
o Number of health facilities constructed, renovated, and/or equipped
o Number of children immunized
o Number of malaria nets purchased and distributed
o Number of staff trained in health systems management
Project: Lesotho Health Sector Reform Project Phase 2
Country: Lesotho
Date Approved: 10/13/2005
Date Closed: 9/30/2009
Total Bank Commitment: $6,500,000
Total Project Cost: $33,500,000
Percentage Designated Health Sector: 44%, other sectors included compulsory and non-compulsory health finance (13% each)
Vertical/Horizontal: Two horizontal themes (50% of total), One vertical theme (16% of total), One theme both (17% of total)
Project Document Available:
http://documents.worldbank.org/curated/en/2010/05/12540832/lesotho-second-phase-health-sector-reform-program-project
Analysis:
• The goal of the project was to increase access to, and quality of, essential health
services.
• The project indicators included:
o Percentage of children under-5 that are fully immunized
o Percentage of deliveries attended to by trained personnel
o Reducing the average weight time at health facilities from 4.5 hours to 2 hours o Reducing the percentage of the population residing within two hour walking
distance from a health facility
o Percentage of infants receiving DPT3 vaccinations.
o Percentage of new TB cases detected and the TB cure rate
o Percentage of health facilities that provide prevention of mother-to-child transmission services
o Percentage of budget allocated to health
o Percentage of health facilities properly staffed
• To accomplish the objectives and meet the indicators the project sought to establish
functioning district health management teams, develop health financing policies, abolished user fees, recommended the development of a social health insurance program, and supported workforce development.
Projects Started in 2006
Project: Avian Influenza Control and Human Pandemic Preparedness and Response Project
Country: Nigeria
Date Approved: 3/29/2006
Date Closed: 5/31/2011
Total Bank Commitment: $50,000,000
Total Project Cost: $65,000,000
Percentage Designated Health Sector: 24%
Vertical/Horizontal: Two horizontal themes (28% of total), One vertical theme (29% of total)
Project Document Available:
http://documents.worldbank.org/curated/en/2013/03/17611521/nigeria-avian-influenza-control-human-pandemic-preparedness-response-project
Analysis:
• The goal of this project was to “support the efforts of the [Nigerian Government] to
minimize the threat posed by H5N1 to humans and the poultry industry, and prepare the necessary control measures to respond to possible influenza pandemic.”
• The project funding was dedicated to four major areas:
o Animal Health
o Human Health
o Social Mobilization and Strategic Communication
o Implementation Support and Monitoring and Evaluation
• The majority of the funding was to both Animal and Human Health • Strategies for achieving objectives in the four areas included:
o Animal Health: strengthening control and outbreak containment, strengthening disease surveillance and diagnostic capacity, and strengthening veterinary quarantine services through training.
o Human Health: enhance public health program planning, delivery and coordination; strengthen public health surveillance systems; and strengthen health system response capacity by improving clinical care capacity, and conducting seasonal influenza vaccinations.
o Social Mobilization and Strategic Communication: promote public awareness, participation, and coordination in emergency contingency plans.
o Implementation Support and Monitoring and Evaluation: support for project management, most of these funds ended up being used by the animal and human health objectives.
Project: Sudan Multi-donor Trust Fund for Decentralized Health System Development
Country: Sudan
Date Approved: 10/30/2006
Date Closed: 6/30/2013
Total Bank Commitment: $6,000,000
Total Project Cost: $19,000,000
Percentage Designated Health Sector: 100%
Vertical/Horizontal: Two horizontal themes (40% of total), Two vertical themes (40% of total), One theme both (20% of total)
Project Document Available:
http://documents.worldbank.org/curated/en/2013/12/18780437/sudan-grant-decentralized-health-system-development-project
Analysis:
• The goal of this project was to “improve access to basic health services by
conflict-affected and underserved populations in four target states while establishing the basis for reform, sustainable financing and development of the decentralized health system.”
• The strategies to meet the goal included:
o Expanding access to primary health services by underserved populations, including improving the quality of existing primary care services; and expansion of coverage of primary health care through the use of temporary mobile clinics.
o Establish the basis for reform and development of the decentralized health
system, including capacity-building and policy development. Other parts of this strategy included health care financing, access to pharmaceuticals, health
planning, monitoring and evaluation, development of primary health care human resources, and investment in primary health care infrastructure.
• The project indicators included:
o Outpatient consultations per person per year in targeted health facilities
o Percentage of pregnant women who attended at least one antenatal care consultation
o Births attended by skilled staff
o Number of insecticide treated nets distributed
o Percent of households who possess at least one insecticide treated net
o Health Care Financing studies completed
o Rural health facilities constructed and or equipped
o Number of primary health care workers (including midwives) trained