ASSESSING FINANCIAL SUSTAINABILITY OF SMALL-SCALE FARMS IN NORTH CAROLINA
By
Alexandria Huber
Honors Thesis Public Policy Department
2 Abstract
This honors thesis examines the financial sustainability of small-scale farms in Durham
and Orange Counties in North Carolina that grow produce, keep poultry, small ruminants (e.g.,
sheep and goats) and small camelids (e.g., llamas and alpacas) and produce other agricultural
products. These farms are generally characterized as local and environmentally conscious due to
a wider variety of crops produced and a greater focus on a smaller area of land often leading to
lower pesticide use, better irrigation and soil improvements. Quantitative and qualitative data for
a representative sample of small-scale farms focusing on their financial viability, sources of
non-farm income, allocation of factors of production (e.g. land, hours worked, hired labor, capital
investments), marketing and socioeconomic and demographic characteristics were collected
through 21 in-person structured interviews. Farms were categorized as either sustainable,
quasi-sustainable or unquasi-sustainable, and the data were analyzed for factors correlated with financial
sustainability. These categories were dependent on three primary variables—whether the farming
was the primary operator’s primary occupation, gross farm income covering operating costs
(including income for the operator) and the use or absence of additional sources of income to
subsidize operating costs. Eight of the farms were considered financially sustainable, four
quasi-sustainable and six financially unquasi-sustainable. Number of years as primary operator and
experience seemed highly important in determining financial sustainability. Operators that were
not farming as their primary occupation stated their desire to farm full-time but were financially
limited. Quasi-sustainable farms were more likely to use web-based advertising and utilize
U-pick operations. Quasi and unsustainable farms were more likely to use federal, state and local
assistance programs, but more research is required to determine the direction of the relationship
3 sustainable practices in land management, seem highly beneficial as well as grants for
infrastructure across all sustainability groups. Durham and Orange counties are wealthy counties,
4 Acknowledgments
I would like to thank the Carolina Global Food Program for generous funding to support this
project.
This project was supported by the Tom and Elizabeth Long Excellence Fun for Honors
administered by Honors Carolina.
I would also like to thank my faculty mentor, Dr. Pam Jagger, for her continued support,
guidance and time throughout this process. A special thanks to Dr. Douglas Mackay for being
willing to be a second reader on my thesis. Your enthusiasm and input was greatly valued.
A huge thank you to my parents and brother for their continued belief in me.
I would like to thank my partner for reminding me when I needed it most why I took on this
project and re-motivating me. Thank you for providing any and all forms of help you could from
your car to your cooking to your mind as I bounced ideas off you.
Additionally, I want to thank my friends for their continual support and motivation throughout
this project. Thank you for always lending me your ear and helping me juggle many events in my
5 Table of Contents
Chapter 1: Significance of Financial Sustainability of Small-Scale Farms and Specific Aims 8
Importance of Small-Scale Farms 10
Small-Scale Farms and Federal Farm Policy 16
Research Question 21
Importance of Research 22
Chapter 2:Background and Research Gap 23
Definitions of Common Terms in Agricultural Policy 23
Financial Uncertainty in Small-Scale Farms 23
Factors Influencing Financial Uncertainty in Small-Scale Farms 28
Research Gaps 33
Chapter 3: Methods 34
Research Design 34
Study Area 34
Sample Population 35
Survey Instrument 39
Analysis 42
Internal and External Validity of the Study 44
Chapter 4: Results and Findings 46
Whole Sample 46
Sample of Small-Scale Farms 47
6 Table of Figures
Figure 1: “Population Change by Metro/ Nonmetro Residence, 1976-2015” 13
Figure 2: “Nonmetro farming-dependent counties, 1950 and 2000” 14
Figure 3: “Farm Bill Spending by Major Mandatory Programs” 19
Figure 4: “Average (mean) farm operator household income and wealth by source, 2011” 24
Figure 5: “Median farm income, median off-farm income, and median total income of farm operator households, 2010-2015” 26
Figure 6: “Median household income of farm operators by source and sales class, 2014” 27
Figure 7: “National Count of U.S. Farmers’ Markets Directory Listings” 30
7 Table of Tables
Table 1: “Farms by operating profit margin and farm typology, 2013” 9
Table 2: “Government Payments by Farm Type, 2011” 18
Table 3: Factors hypothesized to influence the success of small-scale farms 42
Table 4: Descriptive statistics characterizing farms in the full sample and sub-sample of strictly small-scale farms 46
Table 5: Summary of small-scale farm sample by key factors of financial sustainability (N=18) 48 Table 6: Production Factors and Sustainability Categorization (N=18) 52
Table 7: Diversity in Number of Products Produced (N=18) 56
Table 8: Labor Factors and Sustainability Categorization (N=18) 57
Table 9: Program Factors and Sustainability Categorization (N=18) 59
Table 10: Outreach Factors and Sustainability Categorization (N=18) 63
Table 11: Demographic Factors (Frequency) and Sustainability Categorization (N=18) 64
8 Chapter 1: Significance of Financial Sustainability of Small-Scale Farms and Specific Aims
Within the United States, 89.7% of farms are considered small-scale, which the United
States Department of Agriculture (USDA) defines as a farm with gross cash farm income (GCFI)
between $1,000 to $350,000 USD (USDA ERS, 2014). Despite small-scale farms making up a
large portion of the number of farms and occupying 48.4% of the total farmland, or 439.2
million acres, small-scale farms only received 25.5% of total farm income in 2014 (USDA ERS,
2014, 2016a). Additionally, the overall age of principal operators of all farms increased from an
average of 50.5 years in 1982 to 58.3 in 2012 (USDA, 2014a). Meanwhile, the overall percent
of the labor force that identified farming as their primary occupation fell, from 4% in 1970 to 1%
in 2012 (Dimitri, Effland, & Conklin, 2005; USDA, 2014a) Furthermore, on average at least
half of small-scale farms fall within the critical zone, meaning GCFI profit margin is less than 10
percent (USDA ERS, 2014). These data are further broken down in Table 1. The relative
profitability of small-scale farms can be compared with 41.6% of midsize family farms in the
9 Table 1: “Farms by operating profit margin and farm typology, 2013
Source: Hoppe, R., & MacDonald, J. (2013). Updating the ERS Farm Typology (Economic Information Bulletin No. 110). United States Department of Agriculture, Economic Research Service. Page 3.
Small-scale farms make up approximately 24.2% of the value of farm production in the
U.S. (USDA ERS, 2016, pg. 4). Given the non-trivial role of small-scale farms in our food
production system, public policy must play a greater role in supporting these important
businesses and ensuring their financially sustainability. The focus of this research is to answer
the questions: Are small-scale farms that serve or are located within Durham and Orange counties financially sustainable? If so, what factors have led to their relative success or lack of success?
One important factor that is a focus of this research is the federal policy surrounding
10 received 31% of all commodity program payments; this and other similar statistics necessitated a revaluation of allocated funds and resulted in “A Time to Act,” a report by the USDA National
Commission on Small Farms, appointed by the U.S. Congress that pushed for immediate action
in support of small-scale farms (National Commission on Small Farms, 1998). Federal
government support for small-scale farms has been increasing since the report, “A Time to Act.”
Most recently in 2014, after analysis of the 2012 agriculture census determined that small-scale
farms required far more targeted support, new programs were developed (National Commission
on Small Farms, 1998; USDA, 2014b). The helpfulness of these programs, including the
Beginning Farmer and Rancher Development Program, Value-Added Producer Grant and
microloans, is yet to be determined. Evaluating and understanding how farmers feel about certain
federal programs is crucial in designing future programs that they will utilize.
Importance of Small-Scale Farms
“A Time to Act” called attention to five main benefits of small-scale farms: diversity
(i.e., ownership, crops, landscape and practices), environmental sustainability,
self-empowerment and community responsibility (largely rural), places for families (i.e., passing
farming knowledge between generations), and personal connection to food (National
Commission on Small Farms, 1998). In addition to the five points outlined in the report,
11
Diversity
The loss of small-scale farms would almost surely cripple diversity of agricultural
practice. If for no other reason than the fact that they make up 90% of all farms, each operating
and competing within a unique setting, small-scale farms offer a multiplicity of thought
impossible to replicate when only a few large-scale farms remain. Additionally, their ownership
of almost half of all farmland allows for diversity in rural landscapes (National Commission on
Small Farms, 1998). A study of farms in Maryland found that farms are becoming more
consolidated and less diverse in production (Bowen, Tassone, & Baird, 2016). The consolidation of these farms creates a “fragile rather than resilient food system” that depends on fewer
producers who can set prices, require a higher number of inputs, and decrease the diversity of
food produced (Daniel Imhoff, 2012). Diversity of products allows for greater genetic diversity
which can increase resiliency and disease resistance among the species.
Environmental Sustainability
Environmental concerns surrounding agricultural production remain high with issues
related to climate change, water health and pollinator health to name a few (FAO, 2011; Gilbert,
2012; Goulson, Nicholls, Botias, & Rotheray, 2015). Worldwide, one-third of greenhouse gas
emissions come from agriculture. This highlights the necessity of focusing on farming and food
production to mitigate climate change and support a healthy environment (Gilbert, 2012).
Regulating usage of groundwater for irrigation has proved to be very difficult around the world
and has led to uncontrolled use (FAO, 2011). In the U.S., 80% of the nation’s consumptive water
is used by agriculture, which includes both ground and surface water (Schaible & Aillery, 2016).
12 2015). Factors commonly associated with decreasing numbers of pollinators’ populations include
the use of pesticides for agricultural production, production of monoculture crops that result in a
monotonous diet for the pollinators, and climate change (Goulson et al., 2015). Small-scale
farms often provide environmental sustainability through the use of sustainable land
management practices, contributing to crop biodiversity (e.g., planting of heirloom varieties),
and supporting wildlife habitats.
Self-Empowerment and Community Responsibility
The second benefit of small-scale farms is rural empowerment and community
responsibility, which remain essential as rural community populations decrease around the
country (United States Department of Agriculture, n.d.). In the U.S., 90% of “persistent poverty counties” are rural, with agriculture continuing to play an important role (United States
13 Figure 1: Population Change by Metro/ Non-metro Residence, 1976-2015
Source: USDA ERS. (2016). Nonmetro population change dips negative in 2010-14, stabilizes in 2015. Retrieved from https://www.ers.usda.gov/data-products/chart-gallery/gallery/chart-detail/?chartId=58278
As seen in Figure 1, population change for nonmetro or rural counties is negative for the first
time since data are presented in 1976, suggesting rural exodus or the movement of people from
14 Figure 2: “Nonmetro farming-dependent counties, 1950 and 2000”
Source: Dimitri, C., Effland, A., & Conklin, N. (2005). The 20th Century Transformation of U.S. Agriculture and
Farm Policy (Economic Information Bulletin No. 3). USDA ERS. Page 4.
Figure 2 illustrates the overall abundance of nonmetro counties, demonstrating that a significant
15 historically been vitally important in sustaining and supporting these communities through both
farm employment and non-farm economy by increasing local wealth (Dimitri et al., 2005;
Hazell, 2005).
Places for Families
The health of rural communities remains vitally important in 2016 as many families and
individuals still inhabit those communities. The destruction and consolidation of farms has led to
an aging farming population with more farmers above the age of 65 than farmers below the age
of 35 years old further compounding the issue seen in rural counties (Daniel Imhoff, 2012).
Without new farmers entering the field, particularly heirs, the aging population of farmers
suggests a loss in agricultural knowledge that has previously been handed down generation by
generation.
Personal Connection to Food
The fifth point made in the 1998 report—personal connection to food—highlights the
need for people to be connected to how their food is produced through nature. This need has only
increased in importance as only 1% of the population currently farms. As a result, the vast
majority has very few personal connections to food. The importance of personal connections to
food, perhaps best exemplified in community and school gardens, has been heavily researched.
Several studies suggest that those relationships and programs increase vegetable consumption in
children as well as improve physical and mental health (Christian, Evans, Nykjaer, Hancock, &
Cade, 2014; Davis, Martinez, Spruijt-Metz, & Gatto, 2016; Grabbe, Ball, & Goldstein, 2013;
16 production, particularly through small-scale farms, is an important part of supporting the health
of our communities.
Preserving Farmland
Small-scale farms preserve farmland and increase food security (Center for Agroecology
and Sustainable Food Systems, n.d., Hazell, 2005). As farms consolidate many farmers are
choosing to leave their farms which results in farmland being converted to urban or commercial
land which means less land in production and less land available for future farming. The
American Farmland Trust found in its 2002 study, Farming on the Edge, that every minute two
acres of farmland is lost and prime farmland, or land that is most productive and fertile, is lost
30% faster than non-prime rural farmlands (American Farmland Trust, 2002). These remain key
reasons to support and be concerned for the continued health of small-scale farms in the U.S. that
make up a majority of farmers currently feeding the U.S. population.
Small-Scale Farms and Federal Farm Policy
The Agriculture Act, or Farm Bill, has a long history that began in the 1930’s during the
Great Depression and was originally focused on staple commodity support (Johnson & Monke,
2017). It has expanded over the years to include support for small-scale farms, the environment,
rural development, and many other programs outlined below. The bill is required to be updated
every five years and “provides a predictable opportunity for policymakers to comprehensively
and periodically address agricultural and food issues” (Johnson & Monke, 2017). There are
17 trade, nutrition, credit, rural development, research, forestry, energy, horticulture, crop insurance
and miscellaneous which includes support to livestock and poultry production as well as
limited-resource and socially disadvantaged farmers (these are often small-scale farms) (Johnson &
Monke, 2017). Based on these broad categories, it is evident that this legislation encompasses
every person; as it covers farms, consumers of food, nutrition, land conservation, aid and rural
communities (Daniel Imhoff, 2012).
The Farm Bill has created vast change in agriculture environment over time. A Time to
Act states that the commodity programs “have historically been structurally biased toward
benefiting the largest farms”. It has supported the consolidation of farms, demonstrated by
increasing midpoint acreage across all farms over the past 30 years, through commodity support
programs that provided subsidies to farmers who produce commodity crops (i.e. corn, soybeans,
wheat, rice and cotton) often in monocultures (Daniel Imhoff, 2012; MacDonald, Korb, &
Hoppe, 2013). Farm payments have been calculated on the basis of volume of production, thus
giving a greater share of payments to large farms, enabling them to “further capitalize and expand their operations” (National Commission on Small Farms, 1998). Farms are able to use
their increased capital to outbid on land purchases and drive up prices for the land, forcing
small-scale farms out of business (Bruckner, 2016).
In 1998, small commercial farms (then defined as $100,000-$249,000) made up 11% of
all farms and obtained 28% of commodity programs while large farms (those more than
$250,000) made up 6% of all farms and obtained 31% of commodity program payments
(National Commission on Small Farms, 1998). For the small-scale farms the commodity
programs were highly significant though, making up 41% of their gross cash farm income while
18 on Small Farms, 1998). More recently, a study in 2006 found that “government payments have a
small but statistically significant positive effect on farm business survival” and that they “increase business survival rates proportionally more for larger farms” (Key & Roberts, 2006).
This further demonstrates that large farms have historically and continually benefit more from
commodity programs.
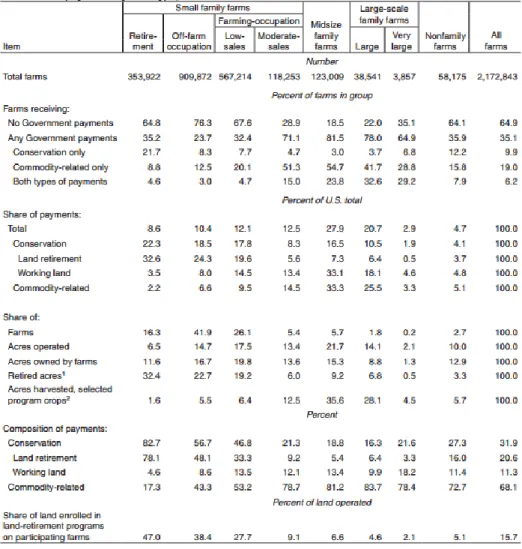
Table 2: “Government Payments by Farm Type, 2011”
19 Table 2 presents information on participation in commodity and conservation programs
by farm size. A majority of small-scale farms with moderate sales (GCFI $150,000-$349,999),
mid-size family farms (GCFI $350,00-$999,999), large scale farms (GCFI $1,000,000+) and
non-family farms participated in some government payment in 2011. Those farms make up about
16% of all farms in the US. More than half, about 56%, of all government payments are received
by mid-size family farms, large scale farms and non-family farms which make up 10.2% of all
farms. Despite this, small-scale farms with moderate sales receive 12.5% of all government
payments and make up 5.4% of all farms. This data highlights that the highest beneficiary by
value of government payments is mid-size and large-scale farms.
These trends are beginning to shift. Recently, spurred by the 1998 report and analysis of the 2012 agricultural census, greater emphasis has been placed on supporting small-scale farms with federal programs. In the most recent Farm Bill, passed in 2014, funding for commodity programs
decreased and funding for conservation and crop insurance increased (Figure 3).
Figure 3: “Farm Bill Spending by Major Mandatory Programs”
20 Crop insurance, as it has begun to take over commodity payments as the “flagship federal
safety net,” still supports large scale agriculture with unlimited subsidies that are focused on
insuring commodity crops or those that produce only one or two crops (Bruckner, 2016).
Additionally, since crop insurance exists to ensure crops against disasters as well as other losses
it discourages sustainable practices since the crops are insured for a wide variety of losses that
could be mitigated with sustainable practices (Bruckner, 2016).
Many programs have been added in the last 20 years in an attempt to support small-scale
farms, which were recognized as being under-supported following the report to Congress and
again following the 2012 agricultural census (USDA, 2014b). In 2000, farm storage facility loans
were created to support farm storage of crops. In 2002, the horticulture and organic agriculture
funding was established. In 2006, the specialty crops block grant program, which focuses on the
supporting growth of specialty crops or those outside of commodity crops, those these programs
were beneficial to small-scale farms they were not directly focused on them (Martinez et al.,
2010; USDA, 2016). Then, focus began to shift toward creating programs specifically for
small-scale farms with the 2008 the organic cost-sharing program was established to decrease the cost
of organic certification (USDA, 2016). Most recently in 201,3 a microloan programs for
small-scale farms and Farm to School Programs were established (USDA, 2016). Finally, in 2014,
several programs were introduced simultaneously including Farmers’ Market and Local Food
Promotion Program, Value-Added Producer Grant Program targeted at small-scale farmers, food
safety training for small-scale farms, Small, Socially Disadvantaged Producer Grant Program,
and the Beginning Farmer and Rancher Development Program (USDA, 2014b). All of these
21 2014 demonstrates that previous programs were not fully supporting this group of farmers and
the next several years will demonstrate the effectiveness of these programs.
Years of bias to large farms is not ending despite decreased commodity payments with
crop insurance payments being utilized at a higher rate and benefitting large-scale farms more
than small-scale farms. Establishment of recent programs signifies an acknowledgement of the
bias and short-comings of federal program to small-scale farms, but the effectiveness of these
programs to effectively support small-scale farms and prevent further consolidation will be
understood in the years to come.
Research Question
The financial sustainability of a farm is defined as its ability to cover operating costs over
multiple years without accruing significant debt. Operating costs can be covered by revenue
generated through sale of crops and livestock, value addition to crops and livestock, and/or
government supports including subsidies. The extent of average gross cash farm income and
average operating costs of small-scale farms in the US is fairly well documented through the
agricultural censuses collected by the USDA. Overlooked is an analysis of the factors that have
led to success for some small-scale farms since between 25-45% of small-scale farmers operate
outside the critical zone meaning their operating profit margin is greater than 10%. While the
data presented above have highlighted challenges facing many small-scale farms, many farms
remain financially successful. By analyzing methods, tools, programs and products that have led
to success in farms this research can help understand key factors that lead to the success of
22 This research seeks to answer the following question: Are small-scale farms that serve or are located within Durham and Orange counties financially sustainable? If so, what factors have led to their relative success or lack of success? The hypotheses for how each factor influences financial sustainability of small-scale farms is outlined in the methodology
chapter in Table 3. Many factors will be analyzed to find associations with the financial success
of a farm. Broadly we will explore factors that relate to production, labor, outreach, access and
use of programs and socio-demographics.
Importance of Research
An understanding of factors that are associated with success in small-scale farms can be
utilized in future legislation to support programs and provide information that will lead to greater
financial success for small-scale farms. Small-scale farms are important for environmental
health, rural health and preservation of farmland. They are a resource and a livelihood that
requires research into what management approaches and strategies lead to their success. Local
and state governments agencies, especially agricultural extension offices, can disseminate this
information to better support the population of small-scale farms. On the federal level, this
research will help identify opportunities for the Farm Bill and other legislative mechanisms to
improve support so small-scale farms. This research seeks to fill a research gap in the choices
made by small-scale farmers to support their farms and factors that lead to small-scale farms’
financial success. This will be done using high quality data from a small, but representative
23 Chapter 2: Financial Sustainability and Small-Scale Farms
This chapter reviews common definitions used within the agriculture and public policy
literature to describe the financial sustainability of small-scale farms. It then reviews the
literature on financial sustainability including the factors that influence financial success.
Research gaps within the literature are highlighted.
Definitions of Common Terms in Agricultural Policy
The most basic unit utilized in agricultural policy and research is a farm, which is an
entity that sells at least $1,000 worth of agricultural products (USDA ERS, 2014). Small-scale
farms are defined as those with gross cash farm income (GCFI) less than $350,000 per year; until
2013 the cut-off was $250,000 per year (Hoppe & MacDonald, 2013; USDA ERS, 2014). Gross
cash farm income is determined by the revenue from the farm business, all farm-related revenue
and is based on annual sales (Hoppe, MacDonald, & Korb, 2010).
Ninety percent of farms in the U.S. are classified as small-scale. Despite being the largest
in absolute numbers, small-scale farms occupy only 52.1% of farmland and receive 25.5% of the
value produced from agriculture (USDA ERS, 2014). Other definitions important to this research
are, “locally or regionally produced”, which is considered within 400 miles of origin or within
the state that produced it (Martinez et al., 2010). The last definition is beginning farmer and
rancher which is often used to analyze farm success. Beginning farmers are those that have been
in operation for 10 or fewer years (Natural Resources Conservation Service, 2014).
24 Small-scale farms are facing great difficulties in financially sustaining themselves. This
section will summarize the current state of small-scale farms in the U.S. In 2011, the average
farming income for retirement, off-farm occupation and low-sales farming occupation farms is
negative (Figure 4) (USDA ERS, 2014).
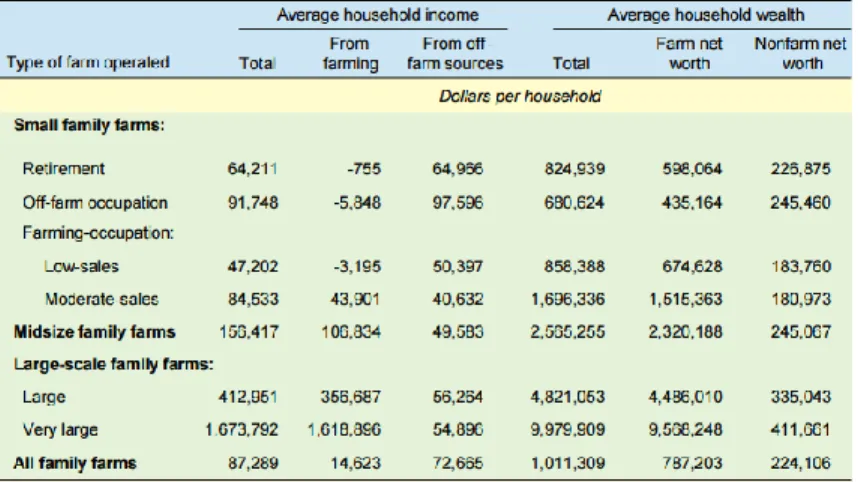
Figure 4: “Average (mean) farm operator household income and wealth by source, 2011”
Source: Economic Research Service. (2016). America’s Diverse Family Farms (Economic Information Bulletin No. 164). USDA.
Moderate-sales small family farms were the only small family farms to receive a profit from
farming and it was half of that of midsize farms and less than one eighth of the income of
large-scale family farms (Figure 4). Off-farm income is essential to total household income for all
small-scale farms (Figure 4). The lack of profitability from farming for many small family farms
demonstrates the financial difficulties many face.
Despite operating at a loss, or negative household income from farming, many
small-scale farms stay in business. Reasons these farms stay in business include long-term financial
25 for many years, farms acting as a shelter for off-farm income, a desire to maintain a rural
lifestyle, and to pass on their farm to heirs (Hoppe et al., 2010). Many also state the
non-economic benefits that small-scale farms provide such as rural community, a place for families,
and environmental sustainability. Because many analyses of financial success do not consider
these non-monetary benefits of maintaining a farming lifestyle, the value of small-scale farms
may appear lower than it would be if non-monetary benefits were accounted for (Center for
Agroecology and Sustainable Food Systems, n.d.).
Off-Farm Income as a Safety-Net for Small-Scale Farms
Farm poverty, particularly in small-scale farms, is decreasing largely due to off-farm
income from the primary operator or other household members in the farm family as opposed to
increased income from the farm (Offutt & Gundersen, 2005). Off-farm income plays a
significant role in the total income of the average farm in the United States (Figure 5). Off-farm
26 Figure 5: “Median farm income, median off-farm income, and median total income of farm
operator households, 2010-2015”
Source: USDA ERS. (2016b). Median farm income, median off-farm income, and median total income of farm operator households, 2010-2015.
Farm income and off-farm income can be further broken down into categories of farm
(Figure 6). The smallest of the small-scale farms, those with GFCI of $10,000 or less, are those
most dependent on off-farm income. Since very small-scale farms make up more than 50% of all
27 Figure 6: “Median household income of farm operators by source and sales class, 2014”
Source: Kassel, K. (2015, November 24). Most farmers receive off-farm income, but small-scale operators depend on it. United States Department of Agriculture, Economic Research Services.
This off-farm income which has increased over the years, is crucial to farms’ survival,
particularly small-scale. The Census Bureau estimates that only 14% of farms are below the
poverty line, a decrease from previous years, that is largely influenced by off-farm income
(Offutt & Gundersen, 2005). There has also been a reduction in food stamp participation among
small-scale farm owners, but this may not be correlated with increased wealth, but rather other
factors such as stigma associated with using food stamps (Offutt & Gundersen, 2005). These
trends support the idea that farm poverty is decreasing. In fact, more than half of U.S. farm
households in every category but retirement and low-sales are high income and high wealth with
the inclusion of off-farm income, highlighting its necessity for many farms (USDA ERS, 2014).
In addition to sustaining many farms, off-farm income smooths income, increases
28 (Mishra & Chang, 2012). Small-scale farms with owners who work off-farm also tend to become
more efficient as they are less focused on expansion (Martinez et al., 2010). These findings
demonstrate the current importance of off-farm income in maintaining small-scale farms. The
current literature does not consider how much of the current off-farm work is done out of
necessity, and to what extent off-farm work is done by choice. This is a question that is explored
in this study.
While considering off-farm employment as a factor influencing the relative success of
small-scale farms, there are also several marketing and farm business related decisions that could
impact whether a farm is financially viable or not. Marketing strategies include the types of sales
and sales venues. Other business decisions include whether to participate in certification and
labelling schemes, and participation in government and NGO programs.
Factors Influencing Financial Uncertainty in Small-Scale Farms
Many different factors and business strategies can affect the financial success of
small-scale farms including selling venues, customer engagement, participation in certification
schemes, and participation in government and non-governmental organization programs. This
section will analyze various factors that have been researched to influence financial success of
farms. Types of sales, selling location, certification and label schemes and use of government
programs will then be reviewed.
29 Small-scale farms have a range of choices regarding how to reach consumers, but many
utilize some form of direct-to-consumer sales including farmers’ markets, CSAs and U-pick
operations. Though direct-to-consumer sales among all farms has increased by 5.5% between
2007 and 2012, farms did not experience an increase in the value of sales during this time period
(Low et al., 2015). Despite this, more farms are moving towards direct-to-consumer sales. In
fact, 44% of all vegetable and melon farmers in the U.S. participate in direct-to-consumer sales
(Martinez et al., 2010). There are several factors that are positively correlated with participation
in direct-to-consumer sales including operators age (up to age 66), variety in production, and
organic production, while size of farm is negatively correlated with participation (Detre, Mark,
Mishra, & Adhikari, 2011; Martinez et al., 2010). Detre et al. (2011) found that
direct-to-consumer sales coupled with multiple field crops, high value crops and internet access all
resulted in higher gross farm income. Eastwood et al. (2004) found that small farms in Tennessee
received almost double the share of weighted produce sales from direct market sales compared to
sales to retail stores (Eastwood, Brooker, Rhea, & Hall, 2004). Additionally, Govindasamy et al.
(1999) found that farms that participated in direct-to-consumer sales as well as alternative sales
methods such as agro-tourism were more financially sustainable due to their diversified stream
of income (Govindasamy, Hossain, & Adelaja, 1999). Studies that consider how beneficial
direct-to-consumer sales are compared to wholesale channels for small-scale farms are few,
suggesting this is an area for future research.
30 In recent years, a number of alternative venues for farm sales have emerged. Between
1994-2014 farmers’ markets increased almost five-fold (Johnson, 2016) . Growth in farmers’
markets between 1994 and 2014 is depicted in Figure 7.
Figure 7: “National Count of U.S. Farmers’ Markets Directory Listings”
Source: Johnson, R. (2016). The Role of Local and Regional Food Systems in U.S. Farm Policy (CRS Report No. 7–5700). Congressional Research Services. Page 18.
This is a large increase in the availability of farmers’ markets for both consumers and
vendors. A study of farmers’ markets in New Zealand found that they serve many functions
including acting an alternative outlet to sell for small producers, an alternative to supermarkets
for consumers, an opportunity for communities to interact, and a mechanism to challenge large
sellers, mainly supermarkets (Guthrie & Lin, 2014). This demonstrates the increasing market
power of farmers’ markets as well as other social benefits to the larger community.
Farmers’ markets are used as a sales venue by many farms, but disproportionately for
certain types of farms. Small-scale farms more often use farmers’ markets as their primary outlet
(Brown & Miller, 2008). Additionally, Brown and Miller (2008) found that operator occupation
31 income, it has not been thoroughly studied whether this is the choice of farmers, or because
small-scale farmers don’t have access to additional markets.
Another popular ‘selling’ method or venue is Community Supported Agriculture (CSA).
Consumers who participate in CSAs pay for a certain number of weeks of produce at the
beginning of the season providing a reliable source of income for farmers throughout their
production season. CSAs have become increasingly popular with small-scale farmers, however a
survey found that only 46% of operators contacted in a national CSA survey were satisfied with
CSAs ability to cover operating costs (Brown & Miller, 2008). Iowa State Extension found that
CSAs in the Midwest were often based on customers willingness-to-pay instead of the market
price of the goods or the cost of productions (Chase, n.d.). More studies are needed to determine
the potential impact of CSAs on the financial sustainability of farms.
The last potential selling method or venue for small-scale farms are cooperatives
(co-ops), which is a system where a market is owned by multiple farmers pooling their resources
together to be able to reach larger markets. Co-ops allow increased flexibility in the size of
markets that farms can sell to since their collective goods can more often compete. Cooperative
markets are highly beneficial to small-scale farms that cannot maintain large, consistent quotas
(Diamond & Barham, 2011). This sales venue is increasing in popularity and requires further
investigation in financial returns to farmers.
Certification and Labeling Schemes
Small-scale farms sell their goods locally either by choice or necessity. Sales for local
food were $6.1 Billion USD in 2012, demonstrating the large market for these goods (Low et al.,
32 the definition of “local” was, demonstrating a strong market for small-scale farms. The size of
this market for locally produced food is highlighted throughout the literature, but how farmers
can best interact with this opportunity is not entirely clear. Whether working through specific
venues, labeling, marketing, or if a combination of these techniques is best remains uncertain.
This research will not be able to determine the answer to this question but will begin to break apart the influence of these factors on farms’ success.
There is also a significant amount of research on USDA organic certifications and price
premiums for organic foods. One study found that controlling for all other variables, including
local, organic certification offered a price premium of about 7% (Connolly & Klaiber, 2014).
Another study was aimed at understanding the relationship between local and organic and found
that there was a preference for local over organic, but the two factors positively interacted thus
increasing overall demand (Meas, Hu, Batte, Woods, & Ernst, 2015). These suggest that organic
certification can increase overall revenue from sales. Meas et al. (2015) also found that
participants did not easily recognize the USDA organic seal but instead more positively reacted
to the word “organic”. This suggests that the meaning of “organic” might not be as well
understood, and the word may instead conjure certain feelings within consumers. It is not clear
whether it is the USDA certification or rather just a farm using sustainable practices that
customers prefer.
Current Use and Success of Government Programs
There has been mixed success with government programs. Currently only 35% of all
farms receive government payments, including conservation land programs and commodity
33 not being utilized by a majority of all farms as Table 2 highlighted that most categories of
small-scale farms are less likely to receive government payments. Small-small-scale farms receive about 82%
of the land retirement conservation payments, about 38% of the working land conservation and
about 32% of the commodity-related programs including marketing loan gains (USDA ERS,
2014). The benefits from these programs are not evenly distributed between farms. A recent
survey found that farmers in Iowa, Kansas and Minnesota all supported placing a cap on direct
payments to farms and wanted programs that support small-scale farms (Bruckner, 2016). This
signifies an acknowledgment within the farming community of the importance in supporting
small-scale farms. Still, small-scale farms do not receive as many benefits. They account for
52.1% of overall farm acres, but only 24% of the insured acres (USDA ERS, 2014).
Research Gaps
One of the most important elements hypothesized to influence the success and
sustainability of small-scale farms is off-farm income, though it is not understood to what extent
off-farm employment is pursued by necessity or by choice. This is an important consideration for
the longevity of small-scale farms. There are other factors as well, such as types of sales venues
farms pursue, and government payments that have not been studied whether they are by choice,
out of necessity, or in the case of sales venues, due to lack of alternatives. Additionally, the best
methods for small-scale farms to use to engage in markets and marketing in general is poorly
researched and will be considered in this study. Lastly, how helpful current government
programs are to small-scale farmers needs further research and will be analyzed within this
34 Chapter 3: Methods
Research Design
The research questions this study addresses are “Are small-scale farms that serve or are located
within Durham and Orange Counties financially sustainable? If so, what factors have led to their
relative success or lack of success?”
This study used a cross-sectional design, with randomly sampled small-scale farm
primary operators located in and/or serving Durham and Orange Counties in North Carolina. The
surveys were conducted in-person as an interviewer administered a paper and pencil
questionnaire at the farm of the primary operator. Interviews were audio recorded with
permission of respondents and transcribed. Structured pencil and paper surveys are ideal because
it allows for expression of personal opinions on why farm operators may have additional jobs,
more nuanced factors of success, and what factors limit the success of small-farms. Additionally,
it allows for multiple primary operators of a single farm to provide input, which provides a more
accurate understanding of the target population. These data can be utilized to understand what
factors support greater profits within this population.
Study Area
North Carolina is an agriculture state making it an ideal location to study financially
sustainable farm operators. Agriculture is the top industry in the state; it ranks seventh nationally
Small-35 scale farms are particularly relevant to North Carolina since it is a large agricultural state, ranked
eighth in the nation in net farm income (USDA ERS, 2016).
Within North Carolina, Durham and Orange Counties are two counties that are close in
proximity, have high levels of median income and education, and relatively high population
densities. These factors suggest that there is a wealthier and more readily available consumer
market for small-scale produce and other farm products. Selection of counties is partially
justified based on the logic that small-scale farms are more likely to find financial success in
these areas compared to more rural and lower income areas. Understanding if and how farms in
these areas are financially sustainable can highlight the health of small-scale farms financially
since these would be two counties where higher success should be found. Durham County has a
median income of $52,038, 45.6% of the population has a bachelor’s degree and there are about
935 people per square mile (United States Census Bureau, 2015). Orange County has a median income of $56,261, 56.2 % of population has a bachelor’s degree and there are about 336 people
per square mile (United States Census Bureau, 2015). These can be compared to North Carolina average with a median income of $46,693, 27.8% of the population has a bachelor’s degree and
about 196 people per square mile (United States Census Bureau, 2015). Since these counties are
wealthier and more urban than counties where many farmers are located, this study is
non-representative of rural communities.
Sample Population
This research focuses on small-scale farms that sell produce, poultry, small ruminants
36 areas of land. Farms that produce large ruminants such as cattle and other large livestock that
requires extensive land such as hogs are excluded from the sample in order to focus on farms that
are small-scale in terms of income but also in overall acreage. Farms that support large livestock
are larger in size, making them fundamentally different than truly small-scale operations. They
also require quite different labor and capital inputs. Several sources were used to generate a
population census to determine a sample including: NC Farm Fresh Directory, local farmers’
market websites and market managers. The process is outlined in Figure 8.
Figure 8: Determining Sampling Frame for Study
The first source is the North Carolina Farm Fresh Directory from the North Carolina
Department of Agriculture, which is designed to connect consumers with farms. It was utilized to
determine the sample population. All farms listed in both Durham and Orange Counties were
included in a master list. The master list also included their contact information, what they
produce and where they sell. All farms were included even if they did not meet all of the criteria
listed above.
NC Farm Fresh Website
Farms located in Durham and Orange
County
Farmers' Markets located in Durham and Orange County
Farms listed on website of Farmers'
Market Market Managers of
Farmers' Markets without website
Farms provided by market manager
Source
Farmers included in the potential
37 Since the research question is for farms that are located within and serve Durham and
Orange County, farmers’ markets listed in the NC Farm Fresh Directory for Durham and Orange
County were also utilized as the second source to identify farmers. This was to provide a
complete census of small-scale farms that are in and/or serve these two counties. Most of those farmers’ markets had their own websites that listed farmers and vendors that sold at their market.
Any farmer that sold agricultural products was included in the master list. Farmers that sold
exclusively value-added goods that were produced from products that they grew were included
in the master list. Furthermore, farmers that sold agriculture products such as honey, cheeses
from animals from their farm and flowers were included in the master list. Vendors that sold
value-added goods that were mainly composed of products from other farms or producers (e.g.
baker) were not included in the list since the sample is focused on farms, or entities producing
agriculture products.
Farmers’ markets that did not have a website were contacted to attempt to determine the
vendors as the third source of identifying farmers. Other sources on those farmers’ markets such
as articles and Facebook posts were also used to determine their vendors. In most cases, those farmers’ markets are no longer functioning and thus did not need to be included in the master
list. At the end, 179 farms were included in the master list.
This list was then constrained to meet the criteria listed above. All farms that sold
livestock larger than small animals, farms that sold only woodwork, farms that sold turf, seed
and starters only, farms that were community gardens and thus an entirely different operating
model, and farms where their agricultural products could not be determined were all removed
38 and excluding producing large livestock. Once this was completed the list included 134 potential
farms to survey. Using a random number generator, 50 farms were randomly selected.
After 50 farms were selected, six of the farms could not be contacted because of lack of
contact information available and them not being at the farmers’ market during multiple visits.
From the 44 remaining farms, one farm was disqualified for selling cattle on further inspection,
five were no longer in business, 12 never responded to emails and calls, eight farmers responded
but declined to participate and 18 agreed to participate but one never returned future calls or
emails to establish a time. The response rate was 42.5%.
To increase the sample an additional 25 farms were randomly selected by the same
method to replace farms that were selected in the original random sample of 50. Of those 25
farms, three were disqualified on further inspection, one was no longer in business, 13 never
responded, four responded but declined to participate and four agreed to participate. The total
response rate for the study was 34.4%.
Twenty-one farms were interviewed for this research. Two mid-level farms were
interviewed despite best efforts to only have small-scale farms in the sample. It was only
discovered that they were too large by GCFI to be included as small-scale farms as the interview
was being conducted. The differentiation between small-scale and mid-size farms, which is gross
cash farm income between $350,000 and $999,999, cannot be determined until gross cash farm
income is discussed so it is understandable why it was unknown at the time of contact.
Additionally, one farm that raised cattle in addition to produce was contacted and interviewed
since there was no indication of their cattle production on their online bio. Therefore, the whole
sample is analyzed, N=21, as well as the sample that meets the strict definition of small-scale
39 Survey Instrument
The data for this research were collected using structured and semi-structured
questionnaire. The survey was designed to collect both quantitative and qualitative data. The
complete survey instrument is found in Appendix A.
Financial Sustainability in Survey Instrument
A primary line of questioning in the survey was to identify whether farms are financially sustainable through a number of ways. This survey is based on a farmer’s recall of their financial
situation over the past five years so their costs and income are asked about in more than one
question and framed differently to allow for rigorous triangulation and to get an accurate
recollection of their financial situation. Financial sustainability was analyzed in three steps. First
is the farm meant to be the primary income for the farm?; if the farm is intended to be a
retirement farm or hobby farm then the farm’s financial sustainability is not the purpose of that
farm’s existence. Second, is the farm income is greater than operating costs? This signals
financial sustainability. Third, are the costs or income are being subsidized in other ways such as
unpaid labor through volunteers, the primary operator not taking an income, or an additional job
to cover costs? Based on these three criteria farms were categorized into financially sustainable,
quasi-sustainable, and financially un-sustainable.
The first criterion, if farming is the individual’s primary occupation, was determined by
asking is farming the primary occupation and if it was not then for what reasons and what was
40 The second criterion is more difficult to determine since it is largely based on recall. To
determine costs, an estimate of the entire year’s costs is asked for. To determine income, an
estimation of the annual gross farm income was asked as well as gross annual income for each
category of products sold by the farm. Additionally, respondents were asked if in the last five
years they have broken even, made a profit, or taken a loss. After the interviews operating costs
and income were compared to determine if costs are generally greater than or less than gross
farm income. Income such as farm rental income, machinery return from farm, management fees
and dividends were not explicitly discussed.
The third criterion of financial sustainability was whether farm operating costs and
income are subsidized. This is determined by asking about off-farm employment by respondents
or other members of their household. This question is clarified to determine if they or other
members had an additional job out of necessity or for other reasons such as passion for that field.
Additionally, questions on additional employees or volunteers (unpaid labor) were included, as
well as whether the primary operator has failed to take an income for any duration of time over
the past five years.
Using these three factors farms are broken down into the categorical variables, financially
sustainable, quasi-sustainable and unsustainable. Sustainable farms broke even or made a profit
on their day-to-day operations when annual income and operating costs were compared. Farms
that stated they made a profit or broke even in the last five years were also included. Between
these two measures farms had to report either both making a profit or breaking even in only one
category. If both measures were breaking even they were considered quasi-sustainable. This is
because these two separate measures were used to capture a more holistic picture, if they state
41 future capital but does not necessarily indicate unsustainability, therefore they are quasi.
Additionally, farms that broke even, made a profit and took a loss over the course of the last five
years, but continually took an income from their work on day-to day operations were considered
financially sustainable since farming is highly dependent on weather which can greatly affect a
year and does not necessarily indicate an unsustainable operation as long as the other factors
were met. Similarly, financially sustainable farms could not take income for a few months and
still be considered financially sustainable. Their income could not be subsidized by an additional
income source which required determining the reasoning for additional jobs by the operator and
partners if necessary. All of these factors together led to a farm being categorized as financially
sustainable.
Quasi-sustainable farms were mixed in which of these categories may be unsustainable
but a majority of the factors needed to indicate financial sustainability.
Unsustainable farms continually took losses, never took an income and/or were entirely
supported by additional sources of income.
After establishing each category each of financial sustainability, several factors were
hypothesized to influence financial sustainability were explored. Table 3 provides a summary of
the factors, how they are operationalized as variables, and what the hypothesized relationship is
42 Table 3: Factors hypothesized to influence the success of small-scale farms
Factor Variable Hypothesis Relationship
Production What farm produces Higher diversity of goods leads to greater financial sustainability.
Years as primary operator
More years as primary operator leads to greater financial sustainability.
Selling Location Higher number of selling locations leads to greater financial sustainability.
Sustainable farms will sell beyond direct-to-consumers.
Labor Employees Financially sustainable farms have greater number of employees.
Volunteers Financially sustainable farms are less dependent on volunteer labor.
Outreach Use of Social Media Higher use of social media engagement leads to greater financial sustainability.
Use of marketing materials
Higher use of marketing materials lead to greater financial sustainability.
Engagement method Face-to-face engagement leads to greater financial sustainability.
Label Consistent use of a label on products leads to greater financial sustainability.
Programs USDA Organic Certification
USDA Organic Certification leads to greater financial sustainability.
Agro-Tourism The use of agro-tourism leads to greater financial sustainability.
Federal Program Utilizing federal programs leads to greater financial sustainability.
Local Programs Utilizing federal programs lead to greater financial sustainability.
Other Certifications Additional certifications lead to greater financial sustainability.
Demographics Age Older farmers are more likely to be financial sustainability.
Gender No relationship predicted
Race No relationship predicted
Education No relationship predicted
Analysis
Analysis for this research is quantitatively-driven mixed-methods. The dependent
43 sustainable, quasi- financially sustainable and financially unstainable. This is primarily
quantitative as gross farm income and costs are numerical, but also includes qualitative
categorical data on taking an income and additional sources of income.
The independent variables are the factors that are mentioned above. Most of the variables
are categorical and are from closed-ended questions including what is produced, selling location,
programs taken part in, land ownership, social media and marketing materials used, labeling and
demographic information. The open-ended questions, such as best-selling products, greatest
difficulty and views on certifications, provide qualitative data. Lastly, the closed-ended questions
about years in production, percent income from each location and size of farm will all be
quantitative, continuous variables. The descriptive and summary statistics for each variable were
analyzed using Stata.
Determining the categories of financial sustainability resulted in comparing the key
attributes discussed above for each farm to determine the categories. Descriptive statistics of
each factor were compared to the financial sustainability category for each farm to determine if
factors lead to greater success based on their frequency in each category of financial
sustainability using Stata. Therefore, financial success, qualitative data, was compared to each
independent variable to describe the percent of farms with each category of financial
sustainability utilize the independent variables, or factors.
To enrich the quantitative analysis, the transcribed interviews were analyzed for
similarities based on factors. Data were analyzed to assess if there are similarities in how
different categories of farms aim to engage with customers, what their greatest difficulties have
been and advice for new farms. This was done utilizing Dedoose, a qualitative analysis software
44 of financial sustainability (e.g. off-farm income, additional jobs, taking an income, etc.) and
factors that are being analyzed within this research (e.g. marketing, organic certification,
government programs, etc.). Then the occurrence of various quotes that highlight categories,
such as customer engagement, were compared based on statistics about each responder, such as
financial sustainability. Additionally, the qualitative analysis offers support in explaining some
of the interesting phenomena that arose in the quantitative data with the farmer’s own words.
Internal and External Validity of the Study
The sample for this study is small. The total number of completed interviews is 21
primary operators of farms. This limits the ability to do causal analysis, and to draw
generalizable conclusions. Surveys can succumb to a number of problems including coverage
error, sampling error, nonresponse error and measurement error. Coverage error is when the
sampling frame excludes certain members of the population. Everyone should have been
included in the sampling frame since the NC Farm Fresh website is operated by the North
Carolina Department of Agriculture. Because farms that are not listed in the NC Farm Fresh database and do not sell at a farmers’ market are not included in the sampling frame, some
coverage error most likely occurred.
Nonresponse error is a serious concern within this research. Farmers are flooded with
surveys within this region and with email as the main means of contact, there is a high likelihood
of nonresponse error. Therefore, follow-up efforts with emails and phone calls as well as attending farmers’ markets to make in-person contact was completed to increase response rates.
45 not to participate on these grounds, thus reducing the response rate. There may be some
systematic element to the nonresponse as a couple of farmers responded that they were too busy
with full-time jobs outside of their farms to participate. Thus, there could be a systematic error in
response that leads the results to not represent the sample, but there is not enough evidence to
indicate that this is the case.
Measurement error was reduced by pretesting the survey, utilizing the same individual to
conduct all of the surveys and assistance from advisors to insure a well-designed survey
instrument and proper post survey data processing. Since the power dynamic favors the farmer
who is older and has an expertise on their own farm, this should hopefully reduce the risk of
farmers to respond with answers they anticipate the interviewer desires. Farmers seemed highly
receptive to want to support a student in their school work, which may be beneficial in reducing
farmers answering with desirable answers, but also may encourage them to skew responses to
provide good results for the student. Honesty between the farmer and interviewer and answering
questions in multiple ways and offering clarifications hopefully reduced this error.
The target population is small-scale farmers that are located within and serve Durham
and Orange Counties and therefore the findings can only be extrapolated to describe this
population and not the larger small-scale farming population within North Carolina or the United
46 Chapter 4: Results and Findings
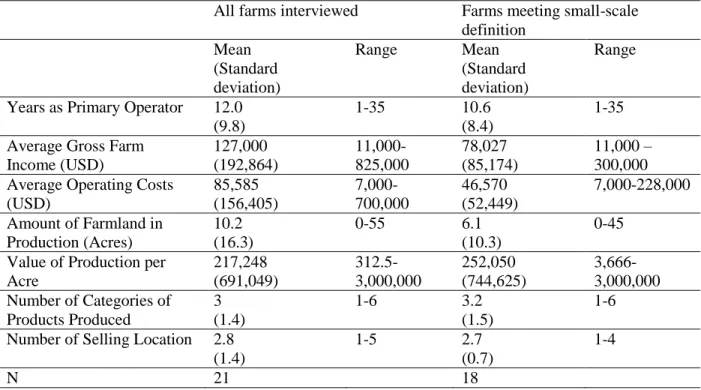
Descriptive statistics characterizing the farms samples are presented in Table 4. Table 4
present data for the full sample of 21 interviewed farms, and for the sub-sample of farms that fit
the strict definition of small-scale farm established for this study.
Whole Sample
Table 4: Descriptive statistics characterizing farms in the full sample and sub-sample of strictly small-scale farms
All farms interviewed Farms meeting small-scale
definition Mean
(Standard deviation)
Range Mean
(Standard deviation)
Range
Years as Primary Operator 12.0 (9.8)
1-35 10.6
(8.4)
1-35
Average Gross Farm Income (USD) 127,000 (192,864) 11,000-825,000 78,027 (85,174) 11,000 – 300,000 Average Operating Costs
(USD) 85,585 (156,405) 7,000-700,000 46,570 (52,449) 7,000-228,000
Amount of Farmland in Production (Acres)
10.2 (16.3)
0-55 6.1
(10.3)
0-45
Value of Production per Acre 217,248 (691,049) 312.5- 3,000,000 252,050 (744,625) 3,666-3,000,000 Number of Categories of
Products Produced
3 (1.4)
1-6 3.2
(1.5)
1-6
Number of Selling Location 2.8 (1.4)
1-5 2.7
(0.7)
1-4
N 21 18
The whole sample surveyed, which included two mid-size farms and one farm that
produced cattle, varies in several ways to those that meet the small-scale definition. On average,
all 21 farms have a higher years as primary operator, 12 years, than the small-scale farms, 10.6
years. Additionally, the whole sample has a higher average gross farm income and average
47 expected that their inclusion would increase the overall income of the sample. It should be noted
that average gross farm income is greater than average operating costs for both the whole sample
and the small-scale farm sample, meaning that on average farms income is covering their
operating costs.
The exclusion of the mid-size farms and farm that produced cattle increased the value of
production per acre, especially the minimum which increased more than ten times from
$312.5/acre in the whole sample to $3,666/acre in the small-scale farm sample. The small-scale
farms in this sample have higher value per acre despite having lower farmland in production on
average. Based on a standard deviation of value per acre that is more than twice the mean, this
variable is skewed by a couple of outliers that produce very high intensity in a small area of land
such as bee-keeping.
The whole sample and the sample that meets the strict small-scale definition are highly
similar in number of products produced (e.g. produce, flowers, livestock products, value-added
goods, etc.), about 3 categories, and number of selling locations (e.g. farmers’ market, co-ops,
CSA, restaurants, etc), about 2.8 selling locations. This highlights the diversity of goods
produced and selling locations by the whole sample on average.
Sample of Small-Scale Farms
Excluding the three operations mentioned previously, Table 5 outlines key factors for
48 Table 5: Summary of small-scale farm sample by key factors of financial sustainability (N=18)
Variable Name Category Percent
Taken a loss, Broken Even, Profit over last 5 years
Loss 22.2
Profit 38.9
Broken Even 16.7
Loss and Profit 11.1
Loss, Profit and Broken Even 11.1
Primary Occupation
Primary Occupation 72.2
Not Primary Occupation 16.7
Retired 11.1
Primary Operator has second job/ source of income
Yes 27.8
No 72.2
Primary Operator Works Second Job (Hours)
0 20
20 40
40 20
Unsure 20
Family Member Has second job
Yes 50
No 50
Family Member Works Second Job (Hours)
5-10 33.3
11- 20 11.1
21-40 55.6
Taking an Income from farm work
Always Taken Income 38.9
Not taken income for months 5.6
Not taken income for years 16.7
Never taken an income 27.8
Not sure 11.1
Financial Sustainability
Financially Sustainable 44.4
Quasi- Sustainable 22.2
Financially Unsustainable 33.3
The financial sustainability of these farms can be better understood through Table 5.
This table indicates that only 38.9% of the farms took a profit every year over the last five years.
49 least at one point over the last five years and 22.2% of them consistently took losses. Many of
these farmers were considering debts though information on debt was not included anywhere
else in the study, particularly since operating costs were considered. This is a weakness in the
data that requires future research.
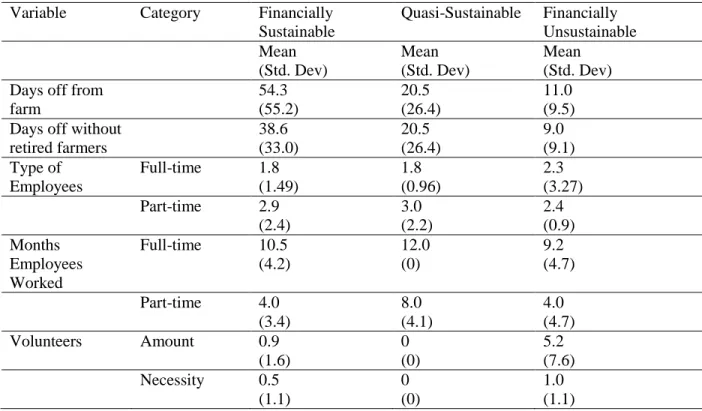
While 72.2% of the farmers farm as their primary occupation, three farms do not. Those
farmers all state they would prefer to leave their jobs and farm full-time but cannot due to current
financial limitations. The concern surrounding off-farm income, and whether it is a necessity or
choice, was outlined in the Chapter 2 and better understood in this survey where farmers with
primary occupations outside of farming would prefer to farm full-time. One farmer stated that
the farm used to be their primary occupation but they have made the farm income supplemental
because it was not enough on its own. Healthcare was also cited as reason for maintaining a
second job.
Similarly, five farmers have a second job, this includes the three who do not define
farming as their primary occupation. The two additional farmers stated interest over need for the purpose of their job. In reference to their job one farmer said, “I took it because it sounded
exciting and believe me, it has been, it has its moments.” Additionally, the income was cited as
beneficial. This highlights the diversity of reasons farmers select, return to, or maintain second
jobs to support their operations.
Another common source of off-farm income is a member of the household; half of the
farmers have a member of their household that has a job off of the farm. Many farmers state that
the farms would operate without the additional support from the family member, but their quality