ETHNIC CAPITAL AND STEM PARTICIPATION: THE IMPACT OF ETHNIC GROUP
CHARACTERISTICS ON THE EDUCATIONAL AND OCCUPATIONAL ACHIEVEMENT
OF SECOND-GENERATIONAL IMMIGRANTS
By
Francis Wong
Honors Essay
Economics Department
University of North Carolina
April 1, 2014
Approved:
______________________
Acknowledgements
I am very grateful for the invaluable assistance provided by the faculty members of the UNC
Economics Department. This thesis would not have been possible without my advisor, Dr. David
Guilkey, and the instructor of the Honors Course, Dr. Geetha Vaidyanathan. I would also like to
thank my family for their support and encouragement during my education. Thank you all for
helping me to explore my interests through research and for contributing to my academic and
Abstract
I. Introduction
The labor market outcomes of immigrants in the United States have been
well-documented in the economics literature. Until relatively recently, second-generation immigrants
have been studied somewhat less thoroughly. Both economists and sociologists have observed
that the typical “melting pot” view of immigration, which assumes a direct path of cultural and
economic integration into the dominant host country society, fails to describe the lives of
successive immigrant generations. In particular, this view is entirely unable to describe the
significant variations in the labor market and socioeconomic outcomes between ethnic groups.
The development of human capital models to describe the paths of successive generations of
immigrants (Borjas, 1992) has laid the theoretical foundation for the empirical analysis of these
outcomes. In particular, the theory states that the human capital of the children of immigrants is a
function of both the human capital of the parents and the average levels of human capital of the
associated ethnic group, also referred to as ethnic capital. My paper also includes findings from
sociological literature produced by segmented assimilation theory (Portes and Zhou, 1993).
Sociological theory provides a useful empirical precedent for incorporating measures of
household social insertion into associated ethnic groups to better capture the availability of social
and financial resources provided by ethnic networks.
The desire to better understand the lives of the children of immigrants motivates this
study. The substantial influxes in immigration in previous decades signify that second-generation
immigrants will continue to represent an important demographic in the United States, and thus
become of increasingly greater economic and social significance. Given that some groups of
second-generation immigrants are particularly at risk to assimilate into a perpetually low
that induce these undesirable outcomes. Understanding these mechanisms can allow policy to
alleviate the socioeconomic problems arising from downward assimilation to low socioeconomic
status. This paper provides a unique contribution by using the Children of Immigrants
Longitudinal Study (CILS) to directly link the characteristics of parents to the outcomes of their
children. Previous economics studies typically use data from sources like the Census that make
this linking difficult and inaccurate. I provide another contribution by considering the
participation of second-generation immigrants in science, technology, engineering, and
mathematics (STEM) fields, as it represents one particular aspect of human capital attainment.
Using STEM participation as a measure of human capital for second-generation immigrants has
not been thoroughly explored in the economics or sociology literature. I hypothesize that
individual characteristics, parental human capital, and ethnic capital predict educational and
occupational achievement in STEM fields for second-generation immigrants, controlling for
source country conditions and neighborhood characteristics.
II. Literature Review
Human capital theory provides a useful foundation to begin exploring the relationship
between characteristics of parents and children. Becker (1994) describes the interaction between
human capital and intergenerational mobility by constructing a model that assumes
utility-maximizing behavior, equilibrium in different markets, and the presence of stochastic factors that
affect individuals unequally. Becker begins by observing that some children receive advantages
due to both natural genetic and cultural endowments received from their parents. He assumes
(1) 𝐸𝑡𝑖 = 𝛼𝑡+ ℎ𝐸𝑡−1𝑖 + 𝑣𝑡𝑖
In this equation, h refers to the degree of inheritability of the endowments, α represents the social
endowment common to the society, and 𝑣𝑡𝑖 denotes unsystematic components and luck in the process of transmission of endowments. This formulation assumes that parents cannot invest in
the endowments of their children. This allows for 𝐻𝑡, the human capital of generation t, to be a function of parental expenditures in the previous period (𝑥𝑡−1), public expenditures in the previous period (𝑠𝑡−1), and cultural and genetic endowment:
(2) 𝐻𝑡 = 𝜓(𝑥𝑡−1, 𝑠𝑡−1, 𝐸𝑡)
Becker argues that the actual earnings of children are determined by their level of human capital
and the earnings of human capital in factor markets. This implies that the earnings of parents
influence the earnings of their children directly through the parental investment in the human
capital of their children and indirectly through the inheritability of endowments. Including
equation (2) in an equation for the earnings of generation t and assuming imperfect access to financial capital to invest in the human capital of children allows earnings to be a function of the
market luck of previous generations, the inheritability of endowments, social endowments
common to the society, public expenditures on previous generations, the generosity and
uncertainty of previous generations towards their children, and the market luck of the individual.
Becker uses this formulation to provide a theoretical framework for demonstrating the
relationship between human capital and intergenerational mobility.
Borjas (1992) describes a model for considering the intergenerational mobility of
individuals belonging to minority ethnic groups. Borjas assumes that the human capital stock of
the workers in any given generation is determined entirely by the investment decisions from the
(3) 𝑘𝑡+1= 𝛽0𝑠(𝑘𝑡𝑘̅𝑡)𝛽1𝑘 𝑡 𝛽1𝑘̅
𝑡 𝛽2
Equation (3) represents the reduced-form model for determining human capital stock of children,
and can be used to consider the human capital stock of the children of immigrants in particular.
In this equation, 𝑘𝑡+1 denotes the human capital stock of the child, 𝑠(𝑘𝑡𝑘̅𝑡) represents the household supply function for time allocated to investing in child human capital, 𝑘𝑡 denotes the
human capital stock of the parent, and 𝑘̅𝑡 denotes the average human capital stock of the household’s ethnic group. Both 𝛽1 and 𝛽2 are assumed to be less than 1 (Borjas, 1992). This
formulation is useful because it assumes that the average human capital stock of the ethnic group
exogenously affects the human capital stock of individuals in the next time period. Borjas
assumes that individuals who are raised in ethnic environments characterized by high levels of
human capital will experience higher levels of productivity due to exposure to social, cultural,
and economic factors. The strength and frequency of this exposure determine the magnitude of
the effect of average ethnic capital. Importantly, parental time and ethnic capital are
complements in the production of child human capital. This theoretical formulation implies a
positive relationship between child quality and both parental human capital and ethnic capital.
Quantifying the magnitude of this relationship, Borjas (2006) notes that about half of the relative
ethnic differences in skills persists from one generation to another. This implies that the wage
gap between ethnic groups will be more or less halved from one generation to the next.
Sociological literature also provides a useful framework through which to understand the
determinants of human capital of children of immigrants. Portes and Zhou (1993) introduced the
theory of segmented assimilation to describe the variation in outcomes for second generation
immigrants in the United States. Their theory rejects the belief that immigrants progress by
that various forms of integration are possible. Portes and Zhou identify three distinct paths of
assimilation. The first path involves a prototypical economic and cultural integration into the
white middle-class. A second path represents downward assimilation into a low socioeconomic
status and permanent poverty. The third path describes rapid economic advancement through the
preservation of ethnic ties and the maintenance of culture from the source ethnicity. Segmented
assimilation theory attempts to identify the determinants of movement along these paths,
particularly the factors that induce vulnerability toward downward assimilation. Portes and Zhou
argue that different modes of incorporation, which include the context comprised by government
immigration and social policy, the receptiveness of the host society, and the characteristics of the
ethnic community, play a crucial role in determining paths of assimilation. Due to their typical
presence in central cities, children of immigrants are particularly vulnerable to close contact with
adversarial subcultures of marginalized native-born minorities. This contact can result in the
socialization into these subcultures that can hinder parental plans for intergenerational mobility.
Portes and Zhou note that the requirement for upward assimilation of immigrant youths involves
the acquisition of high educational achievement that allows for participation in the high-skill
economy. This demands that parents invest sufficiently in their children to realize these
aspirations. Portes and Zhou observe that this investment is supported by certain modes of
incorporation. Government policy, such as the Cuban Loan Program, can broaden immigrants’
financial resources. Some immigrant groups elicit significantly less prejudice and racism than
others, and thus can assimilate upward more smoothly. Portes and Zhou argue that the resources
provided by the ethnic community represent the most important supporting mode of
incorporation. Immigrants from a well-established ethnic group can benefit from educational
resources. Ethnic communities can offer economic niches that members of the second generation
can occupy without needing to attain advanced levels of education. Like Borjas, Portes and Zhou
emphasize that the production of the human capital of the second generation is not just
determined by parent investment decisions, but also by the characteristics of the family’s ethnic
group.
In later work, Zhou (1997) emphasizes the importance not only of the physical resources
made available by the coethnic community, but also of the culture specific to each ethnic group.
Zhou states that differences in performance in school systems may be due both to cultural and
socioeconomic factors. She cites cultural values, such as traditions of respect for teachers and
notions of education as a mechanism for upward mobility as a determinant of the interaction of
immigrant youth with public education systems. The positive relationship between ethnic
resilience and school performance in some ethnic groups suggests the deliberate inculcation of
cultural values by immigrant parents. While Zhou emphasizes the importance of individual-level
and structural-level factors, such as educational aspirations, English language ability, and age
upon arrival, family socioeconomic background, and place of residence, she suggests that
variations in ethnic culture can explain part of the variations in educational outcomes by
ethnicity. Kroneberg (2008) provides a successful test of this hypothesis (see below). Like Borjas
(1992), Zhou also argues that the extent to which ethnic group characteristics can predict paths of
assimilation in the framework of segmented assimilation theory depends strongly on the degree
of connection between a household and the associated ethnic group. Importantly, Zhou
acknowledges that the benefit of social capital provided by ethnic ties may be diminished by
strong disadvantages to that ethnic community. In these cases, strong ethnic ties may perpetuate
and the quality of ethnic capital possessed by that group are important determinants of paths of
assimilation.
The wide variation in outcomes between different immigrant ethnic groups in the United
States and between second-generation immigrants and natives illustrates the importance of these
theoretical foundations for studying children of immigrants. Using data from the 1940 and 1970
Censuses, as well as pooled data from the 1994-1996 Current Population Surveys, Card,
DiNardo, and Estes (1998) measure these variations in terms of earnings. They observe that
second-generation immigrants from Europe tend to make much more than their peers from
Mexico and South/Central America. For example, using the 1994-1996 data, second generation
European men earned 1.24 times as much as natives, while their Mexican and South/Central
American counterparts earned 0.7 times as much as natives. Because changes to the second
generation represent a lagged version of changes to the immigrant population, immigrant
selection processes can also be expected to dictate the composition of the second generation. The
variation in the education and wage levels of second generation by different source country
groups provides evidence of the importance of immigrant selection in determining the
compositional characteristics of the children of immigrants. Interestingly, although first
generation immigrants experienced a wage gap of around 6-10 percent less than natives between
1940 and 1996, second generation immigrants experienced higher educational and wage
outcomes than natives, conditional on parental background. Card, DiNardo, and Estes find that
these gaps range from 17 to 57 percent higher for men and 9 to 39 percent higher for women
while adjusting data for age, region, and changes in origin composition over time. Caponi (2011)
attempts to explain this jump in outcomes between first and second-generation immigrants. He
discounted welfare of their children. Even though they incur a substantial loss in human capital
that diminishes their labor market outcomes in the host country, the children of immigrants are
not affected by this loss and can expect to inherit the same level of human capital regardless of
their parents’ migration decision. These assumptions provide an explanation for the high labor
market outcomes of children of immigrants, as they may be selected positively from the potential
migrant pool given their parents’ maximization process.
A substantial body of empirical literature further explains these variations between ethnic
groups and between natives and children of immigrants by examining the determinants of
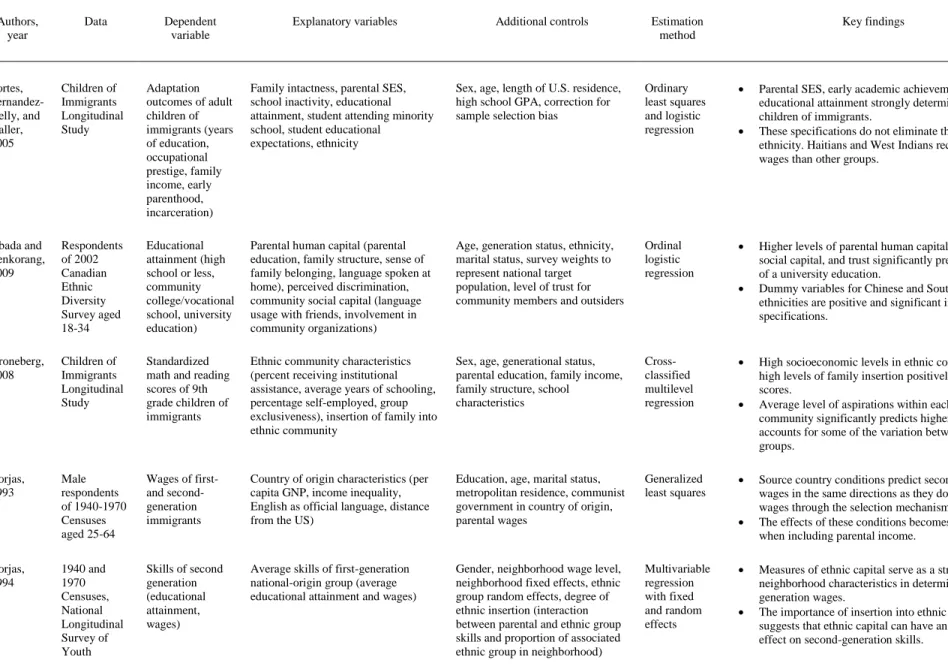
second-generation outcomes. Table 1 summarizes the findings of the studies discussed below.
Typical results provide evidence of the importance of parental human and ethnic capital in the
production of the human capital of the children of immigrants. Using the Children of Immigrants
Longitudinal Study (CILS), Portes, Fernández-Kelly, and Haller (2005) provide an empirical test
of segmented assimilation theory. In particular, they include measures of parental human and
social capital, as well as measures of family intactness. Their specifications include parental SES
and a variable for the intactness of the family. They identify five early adulthood outcomes that
are indicative of upward or downward assimilation: educational attainment, occupational
prestige, family income, early childbearing, and incarceration. OLS regressions demonstrate that
educational attainment is strongly influenced by family intactness and parental SES, both
significant at the 0.1% level. In examining the prestige of the respondents’ occupations around
age 24, they find that early school grades, educational expectations, and subsequent educational
attainment predict occupational status at the 1% level or above. Parental SES and educational
notion that the cumulative impact of parental human capital begins early in the educational
careers of children.
Importantly, their specifications result in persistent variations in key adaptation outcomes
by ethnic group and by gender for all specifications. The Haitian and West Indian respondents
performed significantly better than other groups in terms of educational achievement. Portes,
Fernández-Kelly, and Haller suggest that this may represent a strategy for compensating for
anticipated discrimination in the labor market. This proposition is supported by the below
average labor market outcomes of those same groups. Haitians and West Indians received about
$16,000 less in yearly income than other groups, even when controlling for individual and family
characteristics. Gender produced a strong influence on adaptation outcomes. Females in the
sample managed to achieve higher occupational status, but tended to experience lower yearly
family income.
Evidence from Canada also supports the predictions made by human capital and
segmented assimilation theory. Using data collected from the 2002 Ethnic Diversity Survey in
Canada, Abada and Tenkorang (2009) explore the determinants of educational attainment among
a sample of Canadian individuals aged 18 to 34. Comparing children in the third generation and
above to those in the first and second generations, they examine the importance of human and
social capital in the family. To measure human and social capital, they include parental
education, family structure, and language used at home in an ordinal logit model with level of
education as the dependent variable. Both parents’ levels of education are significant at the 1%
level, as is a variable for child living in an intact family during childhood. Like the results of
previous studies, their estimates reinforce the significance of parental human and social capital,
intergenerational relations (illustrated by an intact family structure and language spoken at home)
represent an important type of social capital, as they encourage the transmission of educational
aspirations. These relations also support access to the ethnic community’s social capital made
available by the parents’ social networks. Individuals who are involved in at least two
organizations are about twice as likely to attain a university education. Though this is suggestive
of the importance of connections to community resources, Abada and Tenkorang were unable to
distinguish ethnic organizations or the importance of variations in cultural factors to isolate the
effect importance of the ethnic community. Their findings are similar to those of Portes,
Fernández-Kelly, and Haller (2005) in that they observe persistent ethnic and gender differences
in educational outcomes. Black minorities, such as Africans and Caribbeans, tended to be
particularly disadvantaged, both educationally and in terms of labor market outcomes.
Kroneberg (2008) uses the CILS to specifically examine the importance of ethnic
communities in determining the paths described by segmented assimilation theory. Kroneberg
provides for a direct connection between Borjas’ (1992) human capital theory and segmented
assimilation theory. Echoing Borjas’ construction of ethnic capital, Kroneberg suggests that
ethnic communities with high levels of socioeconomic status support the propagation of high
levels of educational attainment both through social expectations and the provision of
informational resources. Ethnic communities with low levels of status may propagate low levels
of educational and occupational attainment through similar mechanisms. In order to test this
hypothesis, Kroneberg uses multilevel regressions to nest students within schools and nationality
groups and examines the determinants of standardized math and reading scores administered
during the first wave of the CILS. To construct community level variables, Kroneberg aggregates
parents who received institutional economic assistance, average number of years of schooling,
percentage of parents who are self-employed, the extent to which the ethnic group serves as a
source of social capital (bounded solidarity), the percentage of parents who primarily socialize
within the ethnic community (social closure), and level of educational expectations for the
second generation. To measure the importance of ethnic capital, Kroneberg tests the interaction
effects between the whether a student’s family is inserted into the ethnic group (whether or not
the parent reports socializing primarily with people from their country of birth) and the
community level variables.
Between ethnicities, students with parents from Taiwan, China, Japan, Vietnam, and the
Philippines scored highest in the standardized tests, only rivaled by students with parents from
Argentina and Chile. Students of Mexican origin scored the lowest, along with the children
whose parents were from Laos, Cambodia, Haiti, or the Dominican Republic. This latter group
tended to have parents who immigrated as political or economic refugees. Before analyzing the
effects of ethnic communities, Kroneberg first attempts to account for the importance of
individual and family level factors. The effects of gender, length of stay in the United States,
family income, parent education, and school socioeconomic status explain the bulk of the
variation between ethnicities in reading scores and attain significance levels similar to the studies
discussed previously; however, these variables cannot explain a significant portion of the
variation in math scores. Testing for the impact of community level variables and interaction
effects with family insertion into the ethnic group produces results that illustrate the importance
of ethnic community characteristics. Higher average levels of education and higher percentages
of parents that are self-employed in the ethnic community predict higher test scores among
community’s average level of education increases from its minimum to its maximum (5.5 to 16.5
years), scores for the children in that community rise by 48.59 points in math and 36.94 points in
reading (average scores by ethnicity ranged from 667.4 to 767.3 in math and 648.0 to 716.8 in
reading). Moreover, the relationship between the community level variables and students’
performance are much lower and insignificant if the parents are not inserted in the ethnic
community. Average educational aspirations of the ethnic community produce similar results.
Importantly, Kroneberg finds that among children whose parents belong to ethnic communities
with low levels of socioeconomic status, parental insertion into their communities produces a
significant and negative effect on student performance. This supports the theory that low levels
of ethnic capital result in lower levels of child human capital and potentially downward
assimilation. Community levels of bounded solidarity have no significant effect on school
performance, while community social closure yields a significant and negative effect. In order to
attempt to determine the significance of ethnic culture (as measured by educational aspirations
for the next generation) in determining school performance, Kroneberg isolates respondents of
Vietnamese and Mexican background because of substantial differences in educational
aspirations and large number of observations for both groups. He finds that the statistically
significant effects of group educational aspirations are not mitigated when controlling for
individual, family, and school characteristics, nor when controlling for the community level of
education in interaction with parent ethnic insertion. This restricted test provides evidence for the
importance of ethnic culture in determining outcomes for children, as proposed by Zhou (1997).
An extensive set of literature in economics also provides empirical support for the
importance of ethnic capital. Using data from the Census and National Longitudinal Survey of
the parent generation. Borjas decomposes the effect of ethnic capital into the neighborhood
effects and the effect of ethnicity itself using multivariable regressions with fixed and random
effects. He finds that ethnicity serves as a strong proxy variable for the effect of neighborhood
characteristics that are not unique to each ethnicity. Using the log wage as a measure of
generational skills, the inclusion of variables that are common to all individuals living in an
individual’s neighborhood accounts for almost all of the effect of ethnic capital in
intergenerational transmission. In order to test whether any of the remaining effect is produced
by ethnicity itself, Borjas interacts ethnic capital with a variable that indicates the proportion of
individuals in the neighborhood who are of the same ethnic background as each individual.
Higher levels of exposure to the ethnic community significantly increase the importance of the
ethnic capital variable and decrease the importance of the parental skill variable in predicting
educational attainment and wages. These findings suggest that ethnic capital matters even after
controlling for neighborhood effects, and supports Kroneberg’s findings that the interaction
between ethnic capital and family ethnic insertion matters.
These results complement earlier work by Borjas (1993) which found that source country
economic conditions influence the earnings of first and second generation immigrants. The Roy
model (Borjas, 1987) predicts that immigrants from countries with more unequal income
distributions will be drawn from the lower end of the source country income distribution. Using
generalized least squares to test the effect of source country economic conditions, Borjas (1993)
included the log of per capita GNP and a ratio of income inequality given by the ratio of income
received by the top 10% of households to the income received by the bottom 20%. Borjas found
that log of per capita GNP yielded a significant positive effect at the 5% level (as did whether or
significant negative effect at the 1% level on the wages of children of immigrants. Importantly,
GNP becomes insignificant when controlling for demographic characteristics, and the
significance of all source country conditions was eliminated by the inclusion of a variable for
income of the previous generation. This suggests that the effects of selection of immigrants
primarily affect children of immigrants through the characteristics of the parents. Borjas notes
that the reduction in significance of these variables may be caused by a sample size of 32 source
countries and multicollinearity among variables.
Research on the determinants of success of individuals aspiring to STEM fields in higher
education has revealed the importance of parental influences on student preferences and of those
preferences on actual completion of STEM degrees. Roysircar, Carey, and Koroma (2010) used a
sample of 139 Asian Indian college students and their parents to examine the preferences of
these students for STEM fields. Hierarchical multiple regressions showed that parental
preference for science and math majors significantly positively predicted student preferences for
those majors at the 0.1% level and parent perceived prejudice positively predicted those
preferences at the 5% level. While parental and student acculturation and student perception of
prejudice were not significant in the regressions, the authors note that these might be due to the
presence of multicollinearity between the variables. Second generation students reported lower
preferences for STEM majors than their first generation peers, though both groups majored in
STEM fields at higher than average frequencies. The influence of parents was significant in the
decision of second generation students’ decisions to major in STEM fields despite preferences
for non-STEM majors and attitudinal differences in acculturation and perceived prejudice.
Roysicar, Carey, and Korama propose that the significance of the parents’ perceived prejudice in
levels of parents is a result of their desire to push their children into careers that they believe will
be shielded from prejudice. The relationship established between immigrant parent preferences
and the educational decisions of the children offers the possibility of viewing the pursuit of a
STEM field as an outcome of the human capital investment decision made by immigrant parents.
Rask (2010) provides a more detailed picture of the individual factors that affect the
reproduction of human capital, as formulated by Becker and Borjas. Rask explores the particular
individual factors that determine persistence in STEM fields using data from the admissions and
transcript records of 5,044 from the graduating classes of 2001 through 2009 at a small U.S.
liberal arts college. Probit regressions show that grades received in the introductory course of the
intended major result in significantly higher probabilities of majoring in that department. The
actual intention of majoring in a STEM field increases the probability of progressing to a second
course in that field by about 30 percentage points. Intended major also predicts progression to a
third course conditional on completion of a second. This measurement is useful because having
completed a third course in a STEM field yields a very high probability of completing a major in
that discipline. The importance of pre-collegiate major intention persists when using an ordered
probit model to test its effect on the decision of a student, having taken an introductory course in
his or her intended major to major in a STEM field, major in a STEM field outside of the
department of the introductory course, minor in the department of the introductory course, or
major in the department of the introductory course. Pre-collegiate preparation, measured by SAT
scores and AP credits also predicts more enrolment in STEM courses. Importantly for interethnic
comparison, Rask finds very little evidence of non-Asian minorities experiencing different rates
Table 1. Summary of Previous Empirical Findings
Authors, year
Data Dependent variable
Explanatory variables Additional controls Estimation method Key findings Portes, Fernandez-Kelly, and Haller, 2005 Children of Immigrants Longitudinal Study Adaptation outcomes of adult children of immigrants (years of education, occupational prestige, family income, early parenthood, incarceration)
Family intactness, parental SES, school inactivity, educational attainment, student attending minority school, student educational
expectations, ethnicity
Sex, age, length of U.S. residence, high school GPA, correction for sample selection bias
Ordinary least squares and logistic regression
Parental SES, early academic achievement, and educational attainment strongly determine outcomes for children of immigrants.
These specifications do not eliminate the effects of ethnicity. Haitians and West Indians receive lower wages than other groups.
Abada and Tenkorang, 2009 Respondents of 2002 Canadian Ethnic Diversity Survey aged 18-34 Educational attainment (high school or less, community college/vocational school, university education)
Parental human capital (parental education, family structure, sense of family belonging, language spoken at home), perceived discrimination, community social capital (language usage with friends, involvement in community organizations)
Age, generation status, ethnicity, marital status, survey weights to represent national target population, level of trust for community members and outsiders
Ordinal logistic regression
Higher levels of parental human capital, community social capital, and trust significantly predict attainment of a university education.
Dummy variables for Chinese and South Asian ethnicities are positive and significant in all specifications. Kroneberg, 2008 Children of Immigrants Longitudinal Study Standardized math and reading scores of 9th grade children of immigrants
Ethnic community characteristics (percent receiving institutional assistance, average years of schooling, percentage self-employed, group exclusiveness), insertion of family into ethnic community
Sex, age, generational status, parental education, family income, family structure, school
characteristics
Cross-classified multilevel regression
High socioeconomic levels in ethnic communities and high levels of family insertion positively predict test scores.
Average level of aspirations within each ethnic community significantly predicts higher test scores and accounts for some of the variation between ethnic groups. Borjas, 1993 Male respondents of 1940-1970 Censuses aged 25-64
Wages of first- and second-generation immigrants
Country of origin characteristics (per capita GNP, income inequality, English as official language, distance from the US)
Education, age, marital status, metropolitan residence, communist government in country of origin, parental wages
Generalized least squares
Source country conditions predict second-generation wages in the same directions as they do first-generation wages through the selection mechanism.
The effects of these conditions becomes insignificant when including parental income.
Borjas, 1994 1940 and 1970 Censuses, National Longitudinal Survey of
Skills of second generation (educational attainment, wages)
Average skills of first-generation national-origin group (average educational attainment and wages)
Gender, neighborhood wage level, neighborhood fixed effects, ethnic group random effects, degree of ethnic insertion (interaction between parental and ethnic group skills and proportion of associated
Multivariable regression with fixed and random effects
Measures of ethnic capital serve as a strong proxy for neighborhood characteristics in determining second-generation wages.
Table 1, Continued
Authors, year
Data Dependent variable Explanatory variables Additional controls Estimation method Key findings Roysircar, Carey, and Koroma, 2010 Surveys of 139 Asian Indian college students, 137 fathers, and 133 mothers College major preferences of students
Parent preference for science and math majors
Parental acculturation and perceived prejudice, child acculturation and perceived prejudice
Hierarchical multiple regression
Parental preferences significantly influenced second-generation children toward science and math majors despite stronger child preferences for nonscience majors relative to first-generation children.
Rask, 2010 College administrative records of 5,044 students from classes of 2001-2009
Probability of a student taking an additional course in a STEM major after having taken a first or second course
Grades in STEM courses, pre-collegiate preferences
Class year, student seniority, SAT scores, AP credits, high school grades, gender, course size, instructor gender, proportion of women in course, Asian identification
Probit and ordered probit models
Grades in STEM courses, pre-collegiate preferences, and pre-collegiate education significantly predict STEM persistence.
This paper will assume the human capital models described by Becker (1994) and Borjas
(1992) to analyze the effect of parent human capital and ethnic capital on outcomes for children
of immigrants. I provide a contribution to the existing literature by considering the educational
and occupational participation in STEM fields as one particular aspect of human capital. I follow
Borjas’ (1992, 1993, 1994) specifications and include ethnic capital, neighborhood
characteristics, and source country economic conditions in my estimations. As most of the
literature using CILS data is sociological, it typically does not include measures of source
country economic conditions. My decision to include these variables will serve as an additional
contribution by further illuminating the degree to which the effects of selection and unobserved
skill characteristics persist in the outcomes of second-generation immigrants.
Though I operate under a human capital framework, I incorporate the existing
sociological literature in order to form an improved estimation model for the influence of ethnic
capital in determining educational and occupational attainment. The availability of variables in
the CILS data that measure household insertion into associated ethnic groups allows me to
control for the degree of household insertion into associated ethnic communities. Previous
economics studies typically find difficulty in measuring household insertion. Using CILS data to
correctly link immigrant parents to children, this paper seeks to make a contribution to both the
economics and the sociology literature by incorporating theoretical and empirical specifications
from both.
III. Theoretical Model
I follow Borjas (1992, 1993) and assume a theoretical model in which ethnic capital and
the skills of parents and their children is a product of parental investment in the human capital of
children. Borjas assumes a one-parent one-child household in generation t with human capital stock 𝑘𝑡 which can be sold to the marketplace at a constant price R or can be used to create human capital of the child. The parent thus has a constant elasticity of substitution utility
function:
(4) 𝑈 = 𝑈(𝑘𝑡+1, 𝐶𝑡) = [𝛿1𝑘𝑡+1 𝜌
+ 𝛿2𝐶𝑡 𝜌
] 1 𝜌
In equation (4), 𝐶𝑡 denotes parent individual consumption, 𝑘𝑡+1 denotes the human capital stock of the child, and 1/(1 − 𝜌) represents the elasticity of substitution between consumption and child quality. This formulation assumes that 𝜌 < 1. Borjas (1992) assumes that the average
human capital stock of the ethnic group or ethnic capital 𝑘̅𝑡 yields an external effect in the production of human capital of the child. This results in a production function given by
(5) 𝑘𝑡+1 = 𝛽0(𝑠𝑡𝑘𝑡)𝛽1𝑘̅𝑡 𝛽2
In this equation, 𝑠𝑡 denotes the fraction of the parent’s time devoted to the production of the child’s human capital, 𝑘𝑡 denotes the human capital stock of the parent, and 𝑘̅𝑡 denotes the average human capital stock of the household’s ethnic group. Both 𝛽1 and 𝛽2 are assumed to be
less than 1. In Borjas’ (1992) construction, 𝑠𝑡𝑘𝑡 represents the effective amount of the parent’s human capital stock devoted to producing the human capital of the child. The formulation of
ethnic capital as an external factor in producing human capital implies that child quality depends
both on parental characteristics and on the ethnic environment in which a child develops (Borjas,
1992). Importantly, parental time and ethnic capital are complements in the production of child
human capital.
consumption. Borjas (1992) provides a reduced form model that yields an unambiguous effect
between these factors, presented earlier in Equation (3):
(3) 𝑘𝑡+1= 𝛽0𝑠(𝑘𝑡𝑘̅𝑡)𝛽1𝑘 𝑡 𝛽1𝑘̅
𝑡 𝛽2
Here, 𝑠(𝑘𝑡𝑘̅𝑡) represents the household supply function for time allocated to investing in child human capital (Borjas, 1992). The change in child human capital resulting from an increase in
both parent human capital and ethnic human capital are unambiguously positive, as demonstrated
by Equations (6) and (7):
(6) 𝜕𝑙𝑜𝑔𝑘𝑡+1 𝜕𝑙𝑜𝑔𝑘𝑡 =
𝛽1(1−𝜌) (1−𝑠𝑡)(1−𝜌𝛽1)+𝑠𝑡(1−𝜌)
(7) 𝜕𝑙𝑜𝑔𝑘𝑡+1 𝜕𝑙𝑜𝑔𝑘̅𝑡 =
𝛽2(1−𝜌𝑠𝑡) (1−𝑠𝑡)(1−𝜌𝛽1)+𝑠𝑡(1−𝜌)
Thus, child human capital increases with higher levels of both parent human capital and ethnic
capital, regardless of the elasticity of substitution between parent individual consumption and
child human capital production (Borjas, 1992). This paper will adopt this framework to analyze
the determinants of participation in a STEM field as an outcome of human capital transfer. This
theoretical model allows for predictions about the beneficial effects of both parent and ethnic
group human capital.
IV. Data
I use the publicly available Children of Immigrants Longitudinal Study (CILS) to conduct
my analysis. The CILS surveys children of immigrants in forty-nine schools belonging to parents
from seventy-seven different foreign countries in the Miami/Ft. Lauderdale and San Diego
origins of respondents in the survey. Students were included in the survey if they were born in
Table 2. National Origin of Respondent
Origin Frequency Percent
Cuba 1226 23.30
Philippines 819 15.56
Mexico 755 14.35
Vietnam 370 7.03
Nicaragua 344 6.54
Colombia 227 4.31
South America 211 4.01
Haiti 178 3.38
Jamaica 156 2.96
Laos 155 2.95
Central America 154 2.93
West Indies 116 2.20
Dominican Rep. 105 2.00
Other Asia 100 1.90
Cambodia 95 1.81
Europe, Canada 88 1.67
Chinese 72 1.37
Hmong 53 1.01
Middle East, Africa 38 0.72
the US or if they lived in the US for at least five years and at least one of the parents of the
surveyed students was foreign-born. This study necessitates a broad operational definition for
second-generation children of immigrants, as children who had immigrated to the US by age
twelve were included in the survey (Portes and Rumbaut, 2005).
The survey was conducted in three waves. The first wave was conducted in 1992 and
Children were sampled at their middle and high schools, allowing for a representative sample.
The second wave was conducted three to four years later. By this point, the children were either
completing their high school educations or had abandoned their schooling (Portes and Rumbaut,
2005). Surveys were conducted in schools when possible. If respondents were not available in
school, questionnaires were completed either in person assisted by a member of the survey team
at their last known address or through the mail. Some students who had returned to their country
of origin were interviewed over the phone. The follow-up survey captured 4,288 of the children,
or 81.5 percent of the original sample (Portes and Rumbaut, 2005). Parents of the children
included in the study were surveyed during the second wave. This sample was drawn randomly
from the pool of available guardians of the children but with differential probabilities by national
group in order to capture a sufficient number of respondents from smaller national groups (Portes
and Rumbaut, 2005). The parent sample captured 2,442 respondents, 90 percent of which were
the biological parents of students in the sample (the remaining group being other family figures
or guardians) (Portes and Rumbaut, 2005). Table 3 contains a description of the distribution of
source countries in the parent survey. The community groupings in Table 3 refer to the groupings
used to match respondents with the characteristics of their ethnic community. For example,
community group 4 includes parent data from parents reporting a country of birth in Central
America. A respondent reporting a father born in a Central American country would be
associated with the community level characteristics from community group 4. I consolidate
countries of origin into groups in response to low response rates. For example, only seven
Table 3. Origins of Parent in Parent Survey
Country of Origin Frequency Percent Community Grouping
Africa 6 0.25 1
Egypt 1 0.04 1
Cambodia 85 3.48 2
Caribbean 26 1.06 3
Puerto Rico 16 0.66 3
El Salvador 15 0.61 4
Guatemala 14 0.57 4
Panama 7 0.29 4
Central America 6 0.25 4
Belize 3 0.12 4
China 25 1.02 5
Colombia 86 3.52 6
Cuba 386 15.81 7
Dominican Republic 41 1.68 8
Japan 10 0.41 9
Taiwan 9 0.37 9
Hong Kong 4 0.16 9
Korea 4 0.16 9
Ecuador 23 0.94 10
Europe 6 0.25 11
Hungary 6 0.25 11
Germany 4 0.16 11
England 3 0.12 11
Italy 2 0.08 11
Romania 2 0.08 11
Yugoslavia 1 0.04 11
Spain 1 0.04 11
Russia/Soviet Union 1 0.04 11
Scotland 1 0.04 11
Haiti 75 3.07 12
Jamaica 67 2.74 13
Table 3, Continued
Country of Origin Frequency Percent Community Grouping
Mexico 329 13.47 15
Nicaragua 206 8.44 16
Peru 21 0.86 17
Philippines 358 14.66 18
South America 32 1.31 19
Argentina 19 0.78 19
Guyana 7 0.29 19
Chile 1 0.04 19
India 9 0.37 20
Thailand 8 0.33 20
Indonesia 3 0.12 20
Guam 2 0.08 20
United States 39 1.60 21
Canada 5 0.20 21
Vietnam 249 10.20 22
Other 23 0.94 N/A
Latin America 6 0.25 N/A
Asian 2 0.08 N/A
Iran 1 0.04 N/A
The third wave was conducted from 2001-2003 when the sample averaged twenty-four
years of age and captured 3,613 respondents or 68.9 percent of the original sample. Unlike the
first two waves, the third wave required surveyors to contact respondents in their homes or
workplaces. Respondents were sent letters and subsequent reminders in the cases of
non-response (Portes and Rumbaut, 2005). The second strategy employed to attempt to capture the
remaining respondents involved telephone interviews and in-person visits to last known
addressees. Partial information on respondents who had died, were imprisoned, had returned to
included in the 3,613 response count. This partial information, as well as respondent decisions to
not answer questions produce substantial missing responses for questions in the survey (Portes
and Rumbaut, 2005). Table 4 presents the response rates for variables used in analysis.
To construct my dependent variable, I created a categorization for the degree of
participation in a STEM field based off of the job categories provided in CILS. To operationally
define STEM fields, I used a broad definition provided by the National Science Foundation. This
allowed for the inclusion of occupations involving social sciences and STEM education and
learning research, as well as the traditional fields in science, technology, engineering, and
mathematics (NSF, 2014). I created variables for the STEM participation of respondents during
the third wave with two, three, four, and five ordered categories, from least to most STEM. In
order to test the stability of my dependent variable, I ran regressions using a basic model
specification using each of the numbers of categories. The stability of the t-statistics of the
explanatory variables across these specifications confirmed the stability of this variable. I then
applied my criteria for categorizing STEM occupations to create variables for the STEM
participation of the parents of respondents as well as average levels of STEM participation in
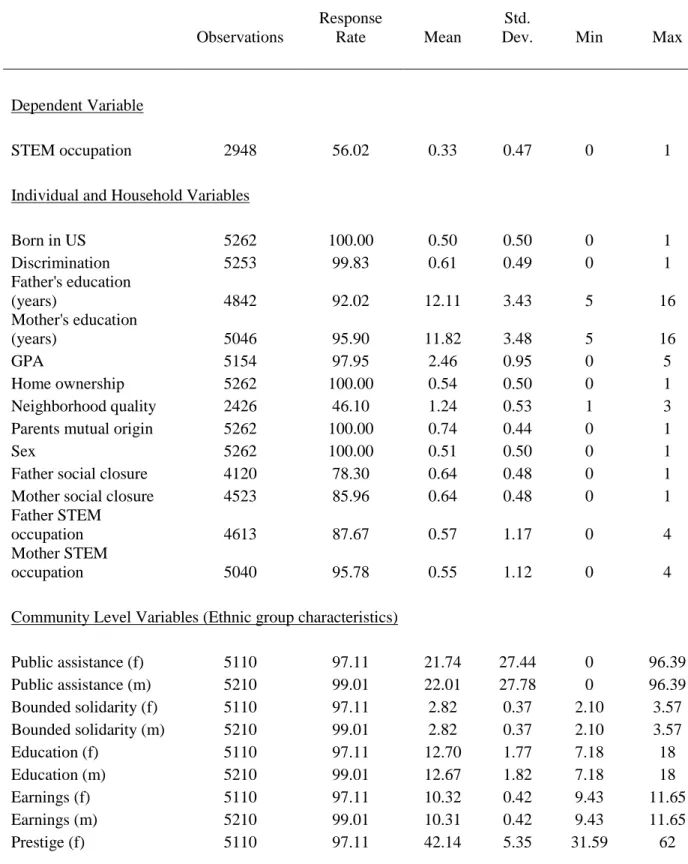
Table 4. Summary Statistics of Regression Variables
Observations
Response
Rate Mean
Std.
Dev. Min Max
Dependent Variable
STEM occupation 2948 56.02 0.33 0.47 0 1
Individual and Household Variables
Born in US 5262 100.00 0.50 0.50 0 1
Discrimination 5253 99.83 0.61 0.49 0 1
Father's education
(years) 4842 92.02 12.11 3.43 5 16
Mother's education
(years) 5046 95.90 11.82 3.48 5 16
GPA 5154 97.95 2.46 0.95 0 5
Home ownership 5262 100.00 0.54 0.50 0 1
Neighborhood quality 2426 46.10 1.24 0.53 1 3
Parents mutual origin 5262 100.00 0.74 0.44 0 1
Sex 5262 100.00 0.51 0.50 0 1
Father social closure 4120 78.30 0.64 0.48 0 1
Mother social closure 4523 85.96 0.64 0.48 0 1
Father STEM
occupation 4613 87.67 0.57 1.17 0 4
Mother STEM
occupation 5040 95.78 0.55 1.12 0 4
Community Level Variables (Ethnic group characteristics)
Public assistance (f) 5110 97.11 21.74 27.44 0 96.39
Public assistance (m) 5210 99.01 22.01 27.78 0 96.39
Bounded solidarity (f) 5110 97.11 2.82 0.37 2.10 3.57
Bounded solidarity (m) 5210 99.01 2.82 0.37 2.10 3.57
Education (f) 5110 97.11 12.70 1.77 7.18 18
Education (m) 5210 99.01 12.67 1.82 7.18 18
Earnings (f) 5110 97.11 10.32 0.42 9.43 11.65
Earnings (m) 5210 99.01 10.31 0.42 9.43 11.65
Table 4, Continued
Observations
Response
Rate Mean
Std.
Dev. Min Max
Prestige (m) 5210 99.01 41.90 5.37 31.59 62
Social closure (f) 5110 97.11 59.73 24.38 11.11 98.38 Social closure (m) 5210 99.01 61.38 23.69 11.11 98.38
STEM occupation (f) 5110 97.11 0.56 0.24 0.19 1.35
STEM occupation (m) 5210 99.01 0.56 0.24 0.19 1.35
Source Country Variables
GNI per capita (f) 4479 85.12 6214.54 9239.16 279.92 44487.57 GNI per capita (m) 4554 86.55 5274.72 8105.36 276.58 44487.57
GDP growth (f) 4951 94.09 1.76 3.48 -3.57 10.36
GDP growth (m) 5047 95.91 1.74 3.48 -3.57 10.36
Infant mortality (f) 5045 95.88 35.94 26.44 4.73 125.43 Infant mortality (m) 5147 97.81 37.07 26.15 4.73 125.43
Note: (m), (f) denote mother's and father's ethnic group or source country, respectively Note: see Appendix 1 for variable definitions
I created various nationality groups based off of reported parent country of birth in the
parental survey. I combined some nationality groups with low response rates. For example,
because Germany, England, Italy, and Spain received fewer than five respondents each, I
consolidated all of the respondents from these groups into a European category (see Table 3). I
then took averages of question responses to create average characteristics for nationality groups
(e.g. average years of education of Cuban parents in the parent survey). I matched these ethnic
characteristics to respondents by creating a set of ethnic group characteristics for the mother’s
ethnic group and the father’s ethnic group separately.
countries, namely Taiwan, I included source country information from alternative sources due to
omissions in the World Development Indicators dataset (Index Mundi, 2014). In response to
typically inconsistent reporting of country indicators, I averaged indicators over ranges of years,
in most cases from 1985 to 1994. See Appendix 1 for variable definitions.
In order to compensate as much as possible for attrition in the data set, I constructed
composite variables that included information from multiple waves in order to minimize loss of
observations. The variable for respondent discrimination was constructed from a question asking
if the respondent had experienced discrimination, asked in the first wave and again in the second
wave. I replaced missing observations from the response in the second wave with responses form
the first wave. Similarly, to construct variables for mother and father years of education, I
replaced missing observations from the parent survey with responses from the second and first
respondent waves of the survey, with priority on responses from the second waves.
V. Empirical Model
I use the following empirical model in my estimations:
(8) 𝑘𝑖𝑗 = 𝛽0+ 𝛽1𝑋𝑖𝑗+ 𝛽2𝑃𝑖𝑗+ 𝛽3𝐶𝑗+ 𝜇𝑗+ 𝜀𝑖𝑗
In Equation 8, 𝑘𝑖𝑗 represents the participation of the ith immigrant child in the jth school in a
STEM occupation. Given the structure of my data, this is the best way to measure STEM
occupational participation. In this model, 𝑋𝑖𝑗 represents a vector of individual level
characteristics of individual i in school j.𝑃𝑖𝑗 denotes a vector of parent level characteristics of
the same individual, and 𝐶𝑗 represents a vector of community level characteristics of the ethnic
school j is given by 𝜀𝑖𝑗. To conduct this analysis, I use a probit model with random effects at the
school level. This assumes exogenous right hand side variables and normally distributed errors.
This model also assumes the existence of variance both between and within schools.
In my analysis, the individual level variables include sex, high school GPA, whether the
respondent was born in the US, whether the respondent experienced discrimination in high
school, and whether the respondent’s parents are both from the same country. Parent
characteristics include years of education, homeownership, participating in a STEM occupation,
and insertion into the ethnic group (social closure). Community level variables include average
levels of STEM participation, average years of education, average occupational prestige score,
median log yearly income, percent receiving public assistance, levels of bounded solidarity, and
levels of social closure. In some specifications, I include controls for neighborhood quality, using
a variable that asks about problems with rules, laws, and authority in a family’s neighborhood. I
also include per capita GNI, GDP growth, and infant mortality rates as source country controls.
These country variables were averaged over the years 1985 to 1994 to attempt to capture country
conditions at the time of parent migration while also compensating for the dearth of developing
country data.
In constructing this model, I encountered a number of specification issues. Initially, I
employed an ordered probit model in order to use a dependent variable that categorized the
occupations of respondents into five groups. These groups were ordered and grouped
occupations from least to most “STEM-classifiable”. Using an ordered probit model produced
large standard errors on the cut points, suggesting that using more than two categories for
respondent occupation did not yield any additional explanatory power. I responded by switching
a STEM occupation included all respondents from the four “most STEM” categories in the
five-group variable.
My analysis was also complicated by the presence of multicollinearity among community
level variables. Appendix 2 contains a correlation matrix of the right hand side variables. The
community level variables that most directly measure ethnic capital tend exhibit the most
collinearity. For example, average years of education in the ethnic group and average levels of
occupational prestige share a correlation coefficient of 0.85. This resulted in insignificant
coefficients or coefficients with different signs than expected. Appendices 3 and 4 contain simple
probit regressions in which the community level variables have been included one at a time to
illustrate their effects in the absence of variables with which they are strongly collinear. In my
analysis, I maintain average years of education in the ethnic group and withdraw average levels
of STEM participation, average occupational prestige, and median log income, as the presence of
collinearity makes it impossible to distinguish the effects of each of these community
characteristics separately.
Although the structure of the data theoretically offers the possibility of including random
effects at the ethnic community level, in practice the presence of only twenty-two ethnic groups
which were used to construct the community level variables limits the viability of this technique.
Both regressions that use these 22 categories, as well as those that use nationality as a source of
variation result in multilevel regressions which fail to converge. As a result, I restricted my
analysis to include only random effects at the school level.
Lastly, efforts to include controls for neighborhood characteristics are limited both by
response rates and by the data collection methods. The survey questions which ask parents about
5,262 respondents in the sample. Moreover, the fact that respondents were sampled only from
the Miami/Ft. Lauderdale and San Diego areas places the schools within four FIPS codes. As a
result, any socioeconomic variables constructed from Census data at the FIPS code are
automatically excluded from regressions due to collinearity.
VI. Results
To conduct my analysis, I regressed the variable denoting respondents’ participation in
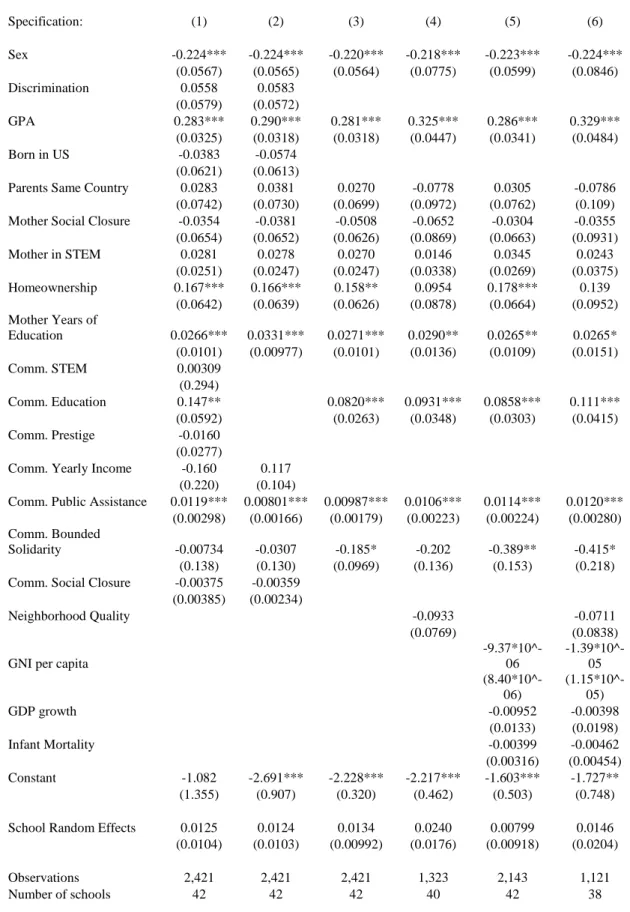
STEM fields at age 24 on individual, parent, and ethnic group variables. Tables 5 and 6 present
the results of the multilevel regressions. Table 5 contains regressions using both mother’s
characteristics and community level characteristics from the mother’s ethnic groups. Table 6
contains equivalent regressions using father’s characteristics and ethnic group. The first
specification contains the broad model, including all of the relevant community level variables.
The second specification removes community level STEM participation, education, and
occupational prestige from the broad model. The third specification contains a narrow regression,
using community level education as the primary indicator of ethnic capital and removing the
insignificant ethnic group social closure variable. The fourth specification adds a measure of
neighborhood quality into the narrow model. The fifth specification includes controls for source
country characteristics, and the sixth specification includes both neighborhood quality and source
country characteristics. Interestingly, the school random effects do not suggest any significant
source of variation at the school level in any of these specifications. The results of these
regressions are very similar to a simple probit model without school random effects.
Of the individual level characteristics, the variables denoting respondent sex indicate
respondent experienced discrimination in high school and whether or not a respondent was born
in the US do not produce any significant effects. The latter result supports this paper’s broad
operational definition of second-generation immigrants, which is defined to include immigrants
who arrived in the US as children.
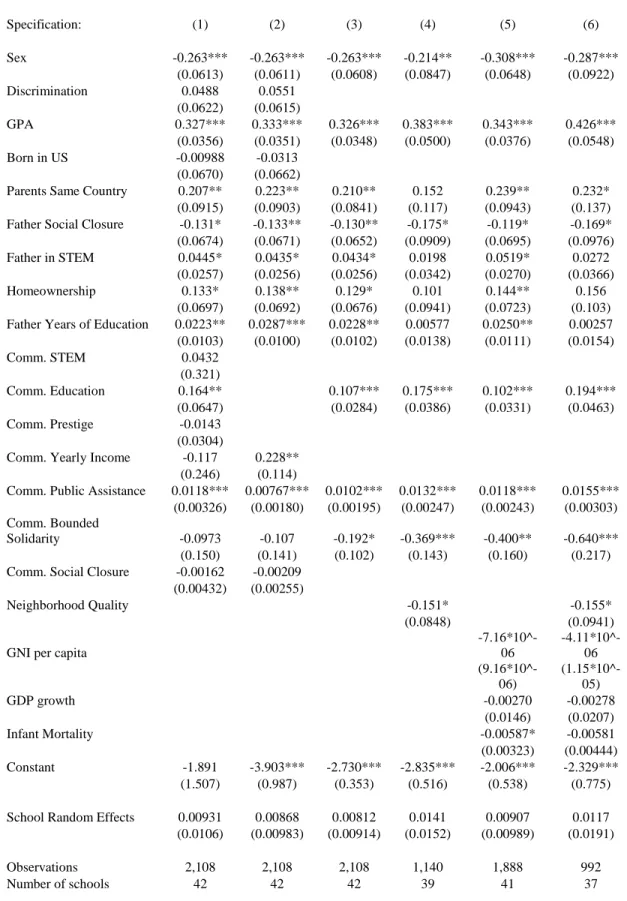
The parent characteristics indicate that higher levels of parental human capital predict
higher probabilities of child STEM participation. In the narrow model (specification (3) of
Tables 5 and 6), parent years of education yields a positive effect at the 5% level for the father
and the 1% level for the mother. The variable denoting whether the family owns their own home
is significant at the 10% level for the father and the 5% level for the mother in the same
regression. Interestingly, in specifications (1), (2), and (3), the variables indicating whether both
parents are from the same country, whether the parent primarily socializes with individuals from
their ethnic group (parent social closure), and the parent’s participation in a STEM field are
insignificant for the regressions using the mother, but are all significant at least at the 10% level
for the father. These results suggest that the homeownership variable absorbs some of the
association with household human capital not contained in the mother’s participation in a STEM
occupation. In the regressions using the father as the parent of interest, parent social closure
predicts lower levels of STEM participation, while having parents from the same country and
Table 5. Results from Multilevel Model with Mother's Ethnic Community Characteristics
Specification: (1) (2) (3) (4) (5) (6)
Sex -0.224*** -0.224*** -0.220*** -0.218*** -0.223*** -0.224*** (0.0567) (0.0565) (0.0564) (0.0775) (0.0599) (0.0846)
Discrimination 0.0558 0.0583
(0.0579) (0.0572)
GPA 0.283*** 0.290*** 0.281*** 0.325*** 0.286*** 0.329***
(0.0325) (0.0318) (0.0318) (0.0447) (0.0341) (0.0484)
Born in US -0.0383 -0.0574
(0.0621) (0.0613)
Parents Same Country 0.0283 0.0381 0.0270 -0.0778 0.0305 -0.0786 (0.0742) (0.0730) (0.0699) (0.0972) (0.0762) (0.109) Mother Social Closure -0.0354 -0.0381 -0.0508 -0.0652 -0.0304 -0.0355 (0.0654) (0.0652) (0.0626) (0.0869) (0.0663) (0.0931)
Mother in STEM 0.0281 0.0278 0.0270 0.0146 0.0345 0.0243
(0.0251) (0.0247) (0.0247) (0.0338) (0.0269) (0.0375) Homeownership 0.167*** 0.166*** 0.158** 0.0954 0.178*** 0.139
(0.0642) (0.0639) (0.0626) (0.0878) (0.0664) (0.0952) Mother Years of
Education 0.0266*** 0.0331*** 0.0271*** 0.0290** 0.0265** 0.0265* (0.0101) (0.00977) (0.0101) (0.0136) (0.0109) (0.0151)
Comm. STEM 0.00309
(0.294)
Comm. Education 0.147** 0.0820*** 0.0931*** 0.0858*** 0.111*** (0.0592) (0.0263) (0.0348) (0.0303) (0.0415) Comm. Prestige -0.0160
(0.0277)
Comm. Yearly Income -0.160 0.117 (0.220) (0.104)
Comm. Public Assistance 0.0119*** 0.00801*** 0.00987*** 0.0106*** 0.0114*** 0.0120*** (0.00298) (0.00166) (0.00179) (0.00223) (0.00224) (0.00280) Comm. Bounded
Solidarity -0.00734 -0.0307 -0.185* -0.202 -0.389** -0.415*
(0.138) (0.130) (0.0969) (0.136) (0.153) (0.218) Comm. Social Closure -0.00375 -0.00359
(0.00385) (0.00234)
Neighborhood Quality -0.0933 -0.0711
(0.0769) (0.0838)
GNI per capita
-9.37*10^-06 -1.39*10^-05 (8.40*10^-06) (1.15*10^-05)
GDP growth -0.00952 -0.00398
(0.0133) (0.0198)
Infant Mortality -0.00399 -0.00462
(0.00316) (0.00454) Constant -1.082 -2.691*** -2.228*** -2.217*** -1.603*** -1.727** (1.355) (0.907) (0.320) (0.462) (0.503) (0.748)
School Random Effects 0.0125 0.0124 0.0134 0.0240 0.00799 0.0146 (0.0104) (0.0103) (0.00992) (0.0176) (0.00918) (0.0204)
Observations 2,421 2,421 2,421 1,323 2,143 1,121
Number of schools 42 42 42 40 42 38
Table 6. Results from Multilevel Model with Father's Ethnic Community Characteristics
Specification: (1) (2) (3) (4) (5) (6)
Sex -0.263*** -0.263*** -0.263*** -0.214** -0.308*** -0.287*** (0.0613) (0.0611) (0.0608) (0.0847) (0.0648) (0.0922)
Discrimination 0.0488 0.0551
(0.0622) (0.0615)
GPA 0.327*** 0.333*** 0.326*** 0.383*** 0.343*** 0.426***
(0.0356) (0.0351) (0.0348) (0.0500) (0.0376) (0.0548)
Born in US -0.00988 -0.0313
(0.0670) (0.0662)
Parents Same Country 0.207** 0.223** 0.210** 0.152 0.239** 0.232* (0.0915) (0.0903) (0.0841) (0.117) (0.0943) (0.137) Father Social Closure -0.131* -0.133** -0.130** -0.175* -0.119* -0.169* (0.0674) (0.0671) (0.0652) (0.0909) (0.0695) (0.0976) Father in STEM 0.0445* 0.0435* 0.0434* 0.0198 0.0519* 0.0272
(0.0257) (0.0256) (0.0256) (0.0342) (0.0270) (0.0366)
Homeownership 0.133* 0.138** 0.129* 0.101 0.144** 0.156
(0.0697) (0.0692) (0.0676) (0.0941) (0.0723) (0.103) Father Years of Education 0.0223** 0.0287*** 0.0228** 0.00577 0.0250** 0.00257 (0.0103) (0.0100) (0.0102) (0.0138) (0.0111) (0.0154)
Comm. STEM 0.0432
(0.321)
Comm. Education 0.164** 0.107*** 0.175*** 0.102*** 0.194***
(0.0647) (0.0284) (0.0386) (0.0331) (0.0463) Comm. Prestige -0.0143
(0.0304)
Comm. Yearly Income -0.117 0.228** (0.246) (0.114)
Comm. Public Assistance 0.0118*** 0.00767*** 0.0102*** 0.0132*** 0.0118*** 0.0155*** (0.00326) (0.00180) (0.00195) (0.00247) (0.00243) (0.00303) Comm. Bounded
Solidarity -0.0973 -0.107 -0.192* -0.369*** -0.400** -0.640*** (0.150) (0.141) (0.102) (0.143) (0.160) (0.217) Comm. Social Closure -0.00162 -0.00209
(0.00432) (0.00255)
Neighborhood Quality -0.151* -0.155*
(0.0848) (0.0941)
GNI per capita
-7.16*10^-06 -4.11*10^-06 (9.16*10^-06) (1.15*10^-05)
GDP growth -0.00270 -0.00278
(0.0146) (0.0207)
Infant Mortality -0.00587* -0.00581
(0.00323) (0.00444) Constant -1.891 -3.903*** -2.730*** -2.835*** -2.006*** -2.329*** (1.507) (0.987) (0.353) (0.516) (0.538) (0.775)
School Random Effects 0.00931 0.00868 0.00812 0.0141 0.00907 0.0117 (0.0106) (0.00983) (0.00914) (0.0152) (0.00989) (0.0191)
Observations 2,108 2,108 2,108 1,140 1,888 992
Number of schools 42 42 42 39 41 37