by
Thomas Hunold
Senior Honors Thesis Department of Biostatistics
University of North Carolina at Chapel Hill April 2016
Approved by:
Dr. Lisa Wruck, Advisor
Dr. Jane Brice, Principal Investigator
Abstract
Introduction
Critical care requires continued training of Emergency Medical Services (EMS) personnel so they will be prepared to implement rarely used skills in emergency situations. Currently, in-person education is regularly provided to both refresh knowledge of procedures and improve the abilities of prehospital care providers. Unfortunately, in-person education may not reach all professionals due to barriers which hamper attendance. A 2007 study showed that twenty-seven percent of EMS personnel did not recall any disaster training within the past year [1]. Additionally, a 2011 study suggested that pediatric care is suboptimal in comparison to adult care and requires increased training [2]. Because the current in-person education sessions do not reach all providers due to barriers, such as time, that hamper attendance, a new education format is required to reach more personnel and fill knowledge gaps. Little research exists regarding prehospital obstetrics care; however, two studies demonstrated significant neonatal morbidity and mortality in out-of-hospital deliveries [3, 4]. Evidence suggests that web-based education may meet this need. Web-based education is associated with improved knowledge and has the advantages of flexibility, accessibility, and practicality [1, 5–9]. Additionally, in one study, participants controlling avatars online showed no difference in the knowledge retained when compared to participants who completed real-world simulations [6]. Thus, web-based courses may be of great value in the continuing education of prehospital providers.
recommended topic [10].
EMS education is lacking in high-risk, low-volume patient populations like pediatrics and obstet-rics. A study from the mid-1990s determined that out-of-hospital obstetric deliveries occurred at a rate of 1.4 deliveries per month for an urban EMS system, and it is estimated that pediatric patients account for approximately 10% of all EMS cases [11–14]. Due to the scarcity of these cases, EMS personnel should focus on improving their skills in these areas because they have less experience with them in the field. Additional experiences in training are necessary because the anatomy and physiology of pediatrics and obstetrics patients is different than the more frequently seen populations and there are specific proce-dures for children and pregnant women. Evidence suggests that EMS personnel feel underprepared when dealing with pediatric patients and cases of childbirth [15]. Additional training in these areas could help providers feel more prepared, and prescription learning could help target providers’ knowledge deficits.
Prescription learning is a method that develops individual education plans to target a student’s identified knowledge deficits though an initial evaluation process. This method is most often employed in school systems and a few reports of this type of learning in resident education have appeared [16–18]. The use of this type of education plan has not previously been documented in EMS literature. This project will incorporate prescription learning in the education of EMS personnel in the high-risk, low-volume patient populations of pediatrics and obstetrics. An initial knowledge test was designed to elucidate knowledge deficiencies in pediatrics and obstetrics EMS protocols and procedures for individual providers. The results of this test will allow for individual education plans to be developed for each provider. Specific courses are being developed to educate providers in these areas and will be assigned throughout the continuation of this project.
Methods
Type of Study and IRB Approval
This preliminary analysis of the first year of larger five year stepped-wedge designed study to educate EMS personnel in the care of pediatrics and obstetrics patients. The University of North Carolina at Chapel Hill Institutional Review Board granted approval for this project, and Data Use Agreements (DUA) were established with the proper authorities prior to research activities.
System Selection
Nine North Carolina EMS Systems were selected based on their location and the likelihood that they would participate in the study, and all nine EMS System agreed to participate. These nine counties were categorized based upon their urbanicity classifications according to the United States Department of Agriculture. Due to the step-wise nature of the study, the EMS Systems were randomized into four blocks such that at least one urban and one rural county was included in each block as follows: [19]
Block Urbanicity System
1 Rural Chatham
Urban Alamance
2 Rural Caswell
Urban Durham
3 Rural Person
Urban Guilford
4 Rural Davie
Rural Stokes
Urban Orange
Knowledge Test
eighty percent or greater. The test was administered through an on-line platform over two time periods (May 18, 2015 to July 14, 2015 and October 21, 2015 to November, 29 2015). The order of questions and answers was randomized for each iteration of the knowledge test. The results for individual providers were provided to the researchers in a de-identified format consistent with established DUA.
Inclusion Criterion
For inclusion in the primary endpoint analyses, providers must have taken both knowledge tests, have a current EMS certification, and be serving in an EMS role within one of the nine EMS systems already specified.
For inclusion in the secondary endpoint, providers must meet the above criteria, but only need to have participated in one of the knowledge tests.
Statistical Analysis
Results
Study Population
Two-hundred twelve providers took both the first and second rounds of the knowledge test. This group consisted mainly of providers over the age of forty, male providers, white providers, full-time providers, providers working in only one county, and providers certified as paramedics. Over both knowl-edge tests, these remained the dominant demographics, showing small fluctuations, and were consistent with the sampling frame aside from lower participation rates of EMT-Basics. The overall demographics can be seen below in Table 1.
Table 1: Overall Demographics of the Sample Knowledge Test 1
% (n=619)
Knowledge Test 2 % (n=260) Both % (n=212) Sampling Frame % (n=1148) Age
18 - 24 10.18 (63) 10.04 (25) 9.91 (21) 14.11 (162)
25 - 29 19.55 (121) 20.48 (51) 17.92 (38) 20.82 (239)
30 - 34 16.8 (104) 15.26 (38) 14.15 (30) 16.03 (184)
35 - 40 12.44 (77) 13.65 (34) 14.62 (31) 12.46 (143)
>40 41.03 (254) 40.56 (101) 43.4 (92) 36.59 (420)
Gender
Female 28.76 (178) 31.73 (79) 30.19 (64) 30.14 (346)
Male 71.24 (441) 68.27 (170) 69.81 (148) 69.86 (802)
Race
Not White 10.25 (62) 8.75 (21) 7.84 (16) 11.64 (130)
White 89.75 (543) 91.25 (219) 92.16 (188) 88.36 (987)
Ethnicity
Hispanic or Latino 3.64 (22) 2.08 (5) 1.47 (3) 39 (3.49)
Not Hispanic or Latino 96.36 (583) 97.92 (235) 98.53 (201) 1077 (96.51) Employment Status
Full-Time 77.71 (481) 72.31 (188) 74.53 (158) 74.62 (832)
Part-Time 22.29 (138) 27.69 (72) 25.47 (54) 25.38 (283)
Counties
Multiple 7.43 (46) 21.54 (56) 20.28 (43) 21.17 (236)
Single 92.57 (573) 78.46 (204) 79.72 (169) 78.83 (879)
EMT Certification
Basic 15.83 (98) 14.86 (37) 10.85 (23) 30.81 (350)
Intermediate 7.43 (46) 4.02 (10) 4.25 (9) 6.78 (77)
Paramedic 76.74 (475) 81.12 (202) 84.91 (180) 63.41 (709)
Caswell, Chatham, and Durham). The overall demographics of the sample remained similar to those presented above with no meaningful deviations and can be seen in Table 2 in the appendix. Tables 15 through 18 in the appendix show the change in test results with all of the data included.
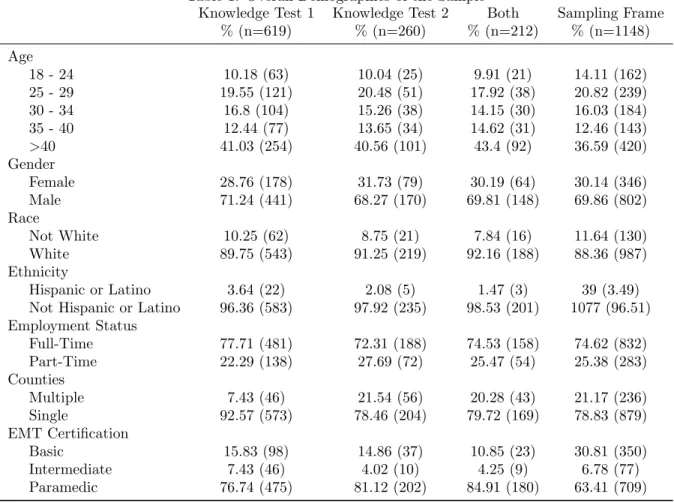
The mean score on the first knowledge test was 72.64 percent with a standard deviation of 10.57 percent, and the mean score on the second knowledge test was 73.39 percent with a standard deviation of 10.68 percent. The overall distributions of scores on the first and second knowledge tests were similar and can be seen in figure 1 below.
Figure 1: Histograms for both the first and second knowledge tests with normal curves overlaid
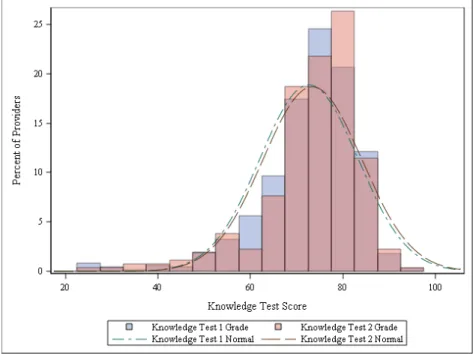
Change in Knowledge Test Scores
reference line indicates a higher score on the first knowledge test.
Figure 2: Change in Knowledge Test Score
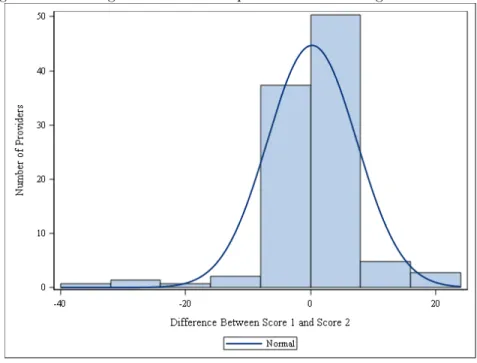
Figure 3: Scatter plot of Knowledge Test 1 Score versus Knowledge Test Two Score
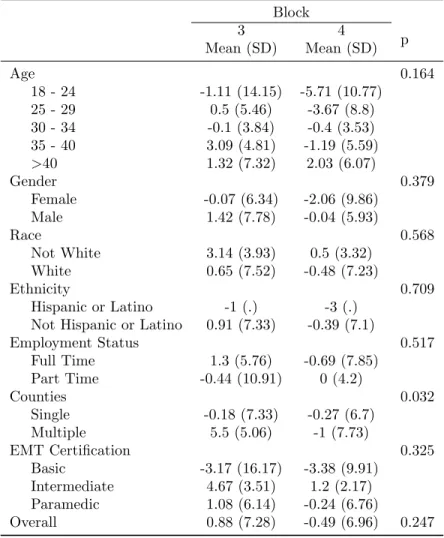
normal and can be seen in Figure 4. A t-test revealed that the mean change was not significantly different than zero (p=0.7207).
Figure 4: Knowledge Test 1 Score Graphed versus Knowledge Test Two Score
These data were further analyzed by block and urbanicity. A two sample t-test comparing the average change in test score between blocks 3 and 4 did not reveal a statistically significant result (p=0.247). Additionally, a two sample t-test comparing the average change in test score between the rural and urban providers did not reveal a statistically significant result (p=0.404).
Homogeneity of Blocks
Interaction Analysis
Two-way ANOVAs were conducted to elucidate possible interactions between demographic vari-ables and block membership as well as urbanicity in the change in knowledge test scores. A significant interaction was found between block membership and the number of counties for which a provider works (p=0.0316). Additionally,a significant interaction was found between urbanicity and gender (p=0.03345). These results can be seen in Tables 5 and 6 of the appendix, respectively.
Two backwards linear regression models were developed using these significant interactions in-cluded in addition to all demographic variables for both block and urbanicity. The first model inin-cluded all demographic variables, block, and the interaction between block and the number of counties for which a provider works. The final model had two significant predictors, block and the interaction between block and county and was not significant (p=0.061, R2=0.039). The second model included all demographic
variables, urbanicity, and the interaction between urbanicity and gender. The final model had significant predictors of urbanicity and the interaction between urbanicity and gender. This model was statistically significant (p=0.0334,R2=0.059). The results of this regression can be seen in Table 7 and 8.
Grade Restrictions
These analyses were also performed with grade restrictions imposed to determine if possible in-teractions were due to the ceiling effect. Providers with scores above 85 percent and below 50 percent were removed from the sample. These results did not reveal any significant interactions and can be seen in Tables 9 and 10 of the appendix.
Dropout Analysis
three EMS systems with low follow-up encompassed a higher percentage of providers who worked in only a single EMS System, full-time providers, and EMT-Intermediate certified providers. The test scores on the first knowledge test were also compared by block and urbanicity. Differences in the first knowledge test score were observed in the 18 to 24 years of age group, Hispanic or Latino ethnicity group, the single system provider group, and the EMT-Intermediate certified provider group. These results can be seen in Tables 11 and 12.
At Risk Groups
The scores received on the two knowledge tests were used to identify groups that performed particularly low. If a provider took the test twice, then the greater of their two scores was used. The mean score was calculated by each demographic and can be seen in Table 13 in the appendix. The overall mean was 73.23 percent with a standard deviation of 10.78 percent. The only group with a mean different than the overall mean by more than five percent was EMT-Basics (mean=63.96%; SD=12.22%). The frequency of assignment to coursework was also analyzed. The only major difference present was where EMT-Basic certified providers were assigned 18-24 courses more frequently than (71.83%) EMT-Intermediate (48.94%) and EMT-Paramedic (33.20%) certified providers. These results are pre-sented in Table 13 of the appendix.
Discussion
Study Population
The overall demographics of the study sample were consistent with the population of providers working in these nine North Carolina EMS Systems. The sample demographics were consistent across both tests, and aside from fewer EMT-Basic certified providers participating in the study than would be expected, the sample showed minimal deviations from the sampling frame. Unfortunately, several EMS Systems had low participation in the second knowledge test. As previously discussed, this compromised the validity of results in blocks 1 and 2. Therefore, only observations from blocks 3 and 4 were included in the analyses discussed below. The overall scores on the knowledge test were relatively consistent from the first to the second test and the change in score from the first to second test had an approximately normal distribution.
Change in Knowledge Test Scores
The primary outcome of interest for this study was the change in score between the first and second knowledge tests. For all of the data and for the data limited to blocks 3 and 4, non-significant t-tests implied that there is not enough evidence to conclude that the difference in scores is different than zero. Therefore, for the overall population of providers who participated in both knowledge tests, there is not sufficient evidence to conclude that over time their scores on the knowledge test changed. This implies that the level of knowledge of EMS providers in obstetrics and pediatric care was consistent over time.
Homogeneity of Blocks
providers in rural areas tend to make less money, and therefore, must work multiple positions in order to make the same amount as their urban counterpart [20]. This implies that there were not unexpected meaningful differences in the demographics of blocks 3 and 4 at baseline. The association between the number of counties for which a provider works and urbanicity should be examined moving forward for possible associations with knowledge test score and score differences.
Interaction Analysis
Analysis of possible interactions between block membership and demographic variables revealed a possible association between the number of counties for which a provider works and their block. This interaction is due to several large change values and small sample size. If these observations are removed, then the interaction is no longer observed. Urbanicity showed a significant interaction with the gender of the provider. A similar issue of small sample size and large change values was observed. These interactions were considered possible predictors and included in the linear regression models that follow. Linear regression modeling revealed block and the interaction between block and the number of counties for which a provider works as significant predictors of the change in knowledge test score. This model was not significant overall, and with a low R-squared value, it is likely that these are not meaningful predictors of the change in knowledge test score or that it does not follow a linear model. A similar model was constructed using urbanicity. The model revealed significant predictors to be the urbanicity of a provider and the interaction between their urbanicity and gender. The overall model was significant; however, the R-squared value was very small. Therefore, a different model may fit the data better than a linear model.
Overall, several statistically significant interactions were found by block and urbanicity; however, these were not found to have a linear relationship with the change in knowledge test score.
Grade Restrictions
was due to several large change values and deemed not meaningful. Overall, no significant difference between the change in knowledge test scores was observed when grade restrictions were imposed.
Dropout Analysis
Chi-squared analysis was used to determine if the providers taking only the first test differed demographically from those taking both tests. Providers taking only one test were more often full-time providers, more often worked for a single county, and more often certified as EMT-Intermediates. These differences should be noted moving forward. Additionally, an overall ANOVA did not reveal differences in the scores of these three groups. When analyzed by demographics, the test scores revealed several points of concern. The providers 18 to 24 years of age in the group of systems with low rates of follow-up had much lower scores on average than those in the counties with higher rates of follow up. Additionally, similar observations could be made about Hispanic or Latino providers, providers working in multiple counties, and EMT-Intermediate certified providers. However, several of these had small sample sizes where influential observations skewed the results. Because the overall ANOVA was not significant and the previous analyses show minimal differences in the change in test score by demographics, caution should be exercised when generalizing these results back the whole sample moving forward.
At Risk Groups
The only demographic sub-group considered at risk compared to the rest of the sample was EMT-Basics. EMT-Basic certified providers had a mean score of 63.96 percent with a standard deviation 12.22 percent. EMT-Basic certified providers being assigned more coursework is consistent with what would be expected as they did not perform as highly as the EMT-Intermediate and EMT-Paramedic certified providers. By the very nature of EMT-Basic certified providers having completed less EMT training, it is expected that they would not perform as highly as EMT-intermediate or EMT-Paramedic certified providers. Because of the lower overall scores and increased numbers of courses assigned, communication with EMT-Basics should be emphasized in hopes of reaching as many providers in this demographic as possible in the continuation of this project.
as the two most frequently assigned courses, and should be focused on first. However, pediatrics and obstetrics are two areas in which continuing education for our EMS providers needs to focus as twenty of the twenty-four topic areas were identified for over half of the providers as areas where they are deficient. Overall, the distribution of course assignments appeared to be split between pediatrics and obstetrics fairly evenly and performance on the questions related to pediatrics and obstetrics were similar with an overall difference in scores of 1.1 percent.
Conclusion
Based upon the overall analysis of difference in scores, we conclude that there was no significant change in knowledge over the initial time period, and based upon interaction analyses, we can conclude that the demographics in this sample did not have meaningful impacts on the difference in scores received on the knowledge tests. These results are consistent with those that were expected. No coursework relevant to pediatrics and obstetrics has been assigned yet. Therefore, no change in knowledge test score was expected. Because of this lack of impact of demographics, we can generalize these results back to the sample of providers; however, this should be done with strong caution as the retention rate between the first and second test was approximately 36 percent, and due to the demographics difference between the providers who participated in just the first test and both knowledge tests. The remaining providers who did not participate in the second test could strongly influence the results in later analyses. Communication with EMT-Basics should be emphasized as they scored consistently lower on the knowledge test and had more courses assigned. The topics of pediatrics and obstetrics are areas that should be highlighted by EMS continuing education because the percentage of provides assigned to coursework indicates a strong need in this area.
Limitations
perspective of the researchers. EMS Systems were allowed to implement their own rules and regulations around taking the test. This lead to issues with retention during the implementation of the second knowledge test leading to results that must be interpreted with strong caution. Another limitation may be that communication was with the EMS System Administrator rather than EMS providers themselves. As a result, there is the possibility that information is lost in communication. Additionally, the familiarity with web-based testing could impact a provider’s willingness to participate in the study.
References
[1] Christine J Chaput, Matthew R Deluhery, Christine E Stake, Katherine A Martens, and Mark E Cichon. Disaster training for prehospital providers. Prehospital Emergency Care, 11(4):458–465, 2007.
[2] Patrick C Drayna, Lorin R Browne, Clare E Guse, David C Brousseau, and E Brooke Lerner. Pre-hospital pediatric care: opportunities for training, treatment, and research. Prehospital Emergency Care, 19(3):441–447, 2015.
[3] Harry C Moscovitz, Urania Magriples, Mark Keissling, and John A Schriver. Care and outcome of out-of-hospital deliveries. Academic Emergency Medicine, 7(7):757–761, 2000.
[4] Vanessa A. Rodie, Andrew J. Thomson, and Jane E. Norman. Accidental out-of-hospital deliver-ies: an obstetric and neonatal case control study. Acta Obstetricia et Gynecologica Scandinavica, 81(1):50–54, 2002.
[6] Patricia Youngblood, Phillip M Harter, Sakti Srivastava, Shannon Moffett, Wm LeRoy Heinrichs, and Parvati Dev. Design, development, and evaluation of an online virtual emergency department for training trauma teams. Simulation in Healthcare, 3(3):146–153, 2008.
[7] Kreg Burnette, Maria Ramundo, Michelle Stevenson, and Michael S Beeson. Evaluation of a web-based asynchronous pediatric emergency medicine learning tool for residents and medical students.
Academic Emergency Medicine, 16(s2):S46–S50, 2009.
[8] Todd P Chang, Phung K Pham, Brad Sobolewski, Cara B Doughty, Nazreen Jamal, Karen Y Kwan, Kim Little, Timothy E Brenkert, and David J Mathison. Pediatric emergency medicine asynchronous e-learning: A multicenter randomized controlled solomon four-group study.Academic Emergency Medicine, 21(8):912–919, 2014.
[9] AER Meri´en, J Van de Ven, BW Mol, S Houterman, and SG Oei. Multidisciplinary team training in a simulation setting for acute obstetric emergencies: a systematic review.Obstetrics & Gynecology, 115(5):1021–1031, 2010.
[10] NC Division of Health Service Regulation Office of Emergency Medical Services. Credentialing and compliance, 2016.
[11] Vincent P. Verdile, Gregory Tutsock, Paul M. Paris, and Robert A. Kennedy. Out-of-hospital deliveries: A five-year experience. Prehospital and Disaster Medicine, 10:10–13, 3 1995.
[12] James S. Seidel, Mark Hornbein, Kathy Yoshiyama, Dorothy Kuznets, Jerry Z. Finklestein, and Joseph W. St Geme. Emergency medical services and the pediatric patient: Are the needs being met? Pediatrics, 73(6):769–772, 1984.
[13] Gene Kallsen et al. Epidemiology of pediatric prehospital care. Annals of emergency medicine, 16(3):284–292, 1987.
[15] Drew E Dawson, William E Brown, and Todd S Harwell. A ssessment of n ationally r egistered e mergency m edical t echnician c ertification t raining in the u nited s tates: T he l eads p roject.
Prehospital Emergency Care, 7(1):114–119, 2003.
[16] Michele Wilson Kamens. Learning to write ieps a personalized, reflective approach for preservice teachers. Intervention in school and clinic, 40(2):76–80, 2004.
[17] LLOYD RUCKER and ELIZABETH MORRISON. The ebm rx: An initial experience with an evidence-based learning prescription. Academic Medicine, 75(5):527–528, 2000.
[18] Jay B Prystowsky and Debra A DaRosa. A learning prescription permits feedback on feedback.
The American journal of surgery, 185(3):264–267, 2003.
[19] Usda ers - urban influence codes, Jul 2013.
Appendix
Table 2: Demographics of only Blocks 3 and 4 Knowledge Test 1
% (n=399)
Knowledge Test 2 % (n=187)
Both % (n=147)
Sampling Frame % (n=728) Age
18 - 24 11.5 (39) 10.92 (19) 10.95 (15) 15.38 (112)
25 - 29 20.94 (71) 21.26 (37) 19.71 (27) 22.12 (161)
30 - 34 17.4 (59) 15.52 (27) 12.41 (17) 16.62 (121)
35 - 40 13.57 (46) 16.67 (29) 18.98 (26) 12.91 (94)
>40 36.58 (124) 35.63 (62) 37.96 (52) 32.97 (240)
Gender
Female 30.68 (104) 31.03 (54) 29.2 (40) 30.49 (222)
Male 69.32 (235) 68.97 (120) 70.8 (97) 69.51 (506)
Race
Not White 8.04 (27) 9.3 (16) 8.15 (11) 9.65 (69)
White 91.96 (309) 90.7 (156) 91.85 (124) 90.35 (646)
Ethnicity
Hispanic or Latino 3.57 (12) 2.27 (4) 1.48 (2) 3.36 (24)
Not Hispanic or Latino 96.43 (324) 97.73 (172) 98.52 (133) 96.64 (691) Employment Status
Full Time 70.21 (238) 68.39 (119) 68.61 (94) 71.14 (520)
Part Time 29.79 (101) 31.61 (55) 31.39 (43) 28.86 (211)
Counties
Multiple 5.9 (20) 8.05 (14) 8.76 (12) 20.38 (149)
Single 94.1 (319) 91.95 (160) 91.24 (125) 79.62 (582)
EMT Certification
Basic 16.81 (57) 13.79 (24) 10.22 (14) 35.64 (258)
Intermediate 6.19 (21) 5.17 (9) 5.84 (8) 6.08 (44)
Table 3: Demographics by Block for Only Blocks 3 and 4 Block
3 % (n)
4
% (n) p
Age 0.219
18 - 24 12.00 (9) 9.72 (7)
25 - 29 26.67 (20) 12.50 (9)
30 - 34 13.33 (10) 13.89 (10)
35 - 40 14.67 (11) 22.22 (16)
>40 33.33 (25) 41.67 (30)
Gender 0.066
Female 36.00 (27) 22.22 (16)
Male 64.00 (48) 77.78 (56)
Race 0.411
Not White 9.33 (7) 5.71 (4)
White 90.67 (68) 94.29 (66)
Ethnicity 0.961
Hispanic or Latino 1.33 (1) 1.43 (1) Not Hispanic or Latino 98.67 (74) 98.57 (69)
Employment Status 0.478
Full Time 76.00 (57) 70.83 (51) Part Time 24.00 (18) 29.17 (21)
Counties 0.135
Single 81.33 (61) 70.83 (51)
Multiple 18.67 (14) 29.17 (21)
EMT Certification 0.572
Basic 8.00 (6) 11.11 (8)
Intermediate 4.00 (3) 6.94 (5) Paramedic 88.00 (66) 81.94 (59)
Table 4: Demographics by Urbanicity for Only Blocks 3 and 4 Urbanicity
Rural % (n)
Urban
% (n) p
Age 0.257
18 - 24 8.57 (6) 12.99 (10)
25 - 29 14.29 (10) 24.68 (19)
30 - 34 14.29 (10) 12.99 (10)
35 - 40 24.29 (17) 12.99 (10)
>40 38.57 (27) 36.36 (28)
Gender 0.369
Female 25.71 (18) 32.47 (25)
Male 74.29 (52) 67.53 (52)
Race 0.597
Not White 8.82 (6) 6.49 (5)
White 91.18 (62) 93.51 (72)
Ethnicity 0.929
Hispanic or Latino 1.47 (1) 1.3 (1) Not Hispanic or Latino 98.53 (67) 98.7 (76)
Employment Status 0.557
Full Time 75.71 (53) 71.43 (55)
Part Time 24.29 (17) 28.57 (22)
Counties <0.001
Single 60 (42) 90.91 (70)
Multiple 40 (28) 9.09 (7)
EMT Certification 0.324
Basic 5.71 (4) 12.99 (10)
Intermediate 5.71 (4) 5.2 (4)
Paramedic 88.57 (62) 81.82 (63)
Table 5: Interaction Analysis for Change in Score by Block Block
3 Mean (SD)
4
Mean (SD) p
Age 0.164
18 - 24 -1.11 (14.15) -5.71 (10.77)
25 - 29 0.5 (5.46) -3.67 (8.8)
30 - 34 -0.1 (3.84) -0.4 (3.53)
35 - 40 3.09 (4.81) -1.19 (5.59)
>40 1.32 (7.32) 2.03 (6.07)
Gender 0.379
Female -0.07 (6.34) -2.06 (9.86)
Male 1.42 (7.78) -0.04 (5.93)
Race 0.568
Not White 3.14 (3.93) 0.5 (3.32)
White 0.65 (7.52) -0.48 (7.23)
Ethnicity 0.709
Hispanic or Latino -1 (.) -3 (.) Not Hispanic or Latino 0.91 (7.33) -0.39 (7.1)
Employment Status 0.517
Full Time 1.3 (5.76) -0.69 (7.85)
Part Time -0.44 (10.91) 0 (4.2)
Counties 0.032
Single -0.18 (7.33) -0.27 (6.7)
Multiple 5.5 (5.06) -1 (7.73)
EMT Certification 0.325
Basic -3.17 (16.17) -3.38 (9.91)
Intermediate 4.67 (3.51) 1.2 (2.17) Paramedic 1.08 (6.14) -0.24 (6.76)
Table 6: Interaction Analysis for Change in Score by Urbanicity Urbanicity
Rural Mean (SD)
Urban Mean (SD) p
Age 0.432
18 - 24 -2.33 (13.88) -3.60 (12.52)
25 - 29 -0.90 (9.92) -0.74 (4.77)
30 - 34 -1.50 (3.54) 1.00 (3.37)
35 - 40 0.47 (5.54) 0.70 (6.04)
>40 3.00 (8.51) 0.46 (3.8)
Gender 0.033
Female -3.11 (10.68) 0.84 (4.28)
Male 2.06 (6.73) -0.79 (6.73)
Race 0.473
Not White 0.83 (2.64) 3.80 (4.6)
White 0.82 (8.63) -0.54 (6.08)
Ethnicity 0.796
Hispanic or Latino -1.00 (.) -3.00 (.) Not Hispanic or Latino 0.85 (8.33) -0.22 (6.1)
Employment Status 0.294
Full Time 0.25 (8.84) 0.47 (4.26)
Part Time 2.24 (5.52) -2.09 (9.02)
Counties 0.470
Single -0.21 (8.2) -0.23 (6.27)
Multiple 2.14 (8.06) -0.57 (3.78)
EMT Certification 0.276
Basic -6.00 (13.83) -2.20 (12.38)
Intermediate 1.50 (2.38) 3.50 (3.7) Paramedic 1.11 (7.92) -0.19 (4.54)
Table 7: Change in Scores Linear Regression Results for Block Analysis
Parameter Level Slope (SE) t p
Full Model
Intercept 2.3735 (1.7601) 1.35 0.180
Block 3 0.5723 (1.3903) 0.41 0.681
Age 18-24 -4.7607 (2.2161) -2.15 0.034
Age 25-29 -2.7821 (1.7388) -1.60 0.112
Age 30-34 -2.9865 (1.9284) -1.55 0.124
Age 35-40 -1.2265 (1.6795) -0.73 0.467
Gender Female -0.8839 (1.3454) -0.66 0.512
Race Not-White 1.9818 (2.2500) 0.88 0.380
Ethnicity Hispanic or Latino -0.4463 (5.1943) -0.09 0.932 Employment Status Full Time -1.3215 (1.4390) -0.92 0.360
County Multiple -0.4736 (1.8742) -0.25 0.801
EMT Certification Basic -2.3005 (2.1475) -1.07 0.286 EMT Certification Intermediate 1.6967 (2.6286) 0.65 0.520 Block * County 3 * Multiple 6.2869 (2.8224) 2.23 0.028 Reduced Model
Intercept 0.3923 (0.5940) 0.66 0.510
Block 3 1.4087 (0.6881) 2.05 0.043
Block * County 3 * Multiple 1.4697 (0.6937) 2.12 0.036
Table 8: Change in Scores Linear Regression Results for Urbanicity Analysis
Parameter Level Slope (SE) t p
Full Model
Intercept 1.055 (1.7332) 0.61 0.544
Urbanicity Rural 1.7635 (1.5395) 1.15 0.254
Age 18-24 -4.0215 (2.229) -1.80 0.074
Age 25-29 -2.1946 (1.7473) -1.26 0.211
Age 30-34 -2.4504 (1.9474) -1.26 0.211
Age 35-40 -1.1458 (1.7071) -0.67 0.503
Gender Female 1.9342 (1.7749) 1.09 0.278
Race Not-White 1.4589 (2.3093) 0.63 0.529
Ethnicity Hispanic or Latino 1.2795 (5.2869) 0.24 0.809 Employment Status Full Time -0.7128 (1.4309) -0.5 0.619
County Multiple 1.9489 (1.5554) 1.25 0.212
EMT Certification Basic -2.3874 (2.1658) -1.1 0.272 EMT Certification Intermediate 2.2863 (2.629) 0.87 0.386 Urbanicity * Gender Rural * Female -6.1507 (2.6728) -2.3 0.023 Reduced Model
Intercept -0.7885 (0.9701) -0.81 0.418
Urbanicity Rural 2.8462 (1.372) 2.07 0.040
Table 9: Grade Restrictions: Interaction Analysis for Change in Score by Block Block
3 Mean (SD)
4
Mean (SD) p
Age 0.213
18 - 24 -1.11 (14.15) -5.83 (11.79)
25 - 29 0.11 (5.1) -3.67 (8.80)
30 - 34 1.00 (3.21) -0.11 (3.62)
35 - 40 3.09 (4.81) -0.80 (5.56)
>40 1.38 (7.47) 2.25 (6.23)
Gender 0.463
Female 0.28 (6.42) -2.13 (10.2)
Male 1.33 (7.87) 0.27 (6.02)
Race 0.668
Not White 3.14 (3.93) 0.50 (3.32)
White 0.71 (7.63) -0.25 (7.44)
Ethnicity 0.788
Hispanic or Latino -1.00 (.) -3.00 (.) Not Hispanic or Latino 0.99 (7.41) -0.16 (7.29)
Employment Status 0.608
Full Time 1.38 (5.68) -0.49 (8.13) Part Time -0.35 (11.24) 0.25 (4.14)
Counties 0.100
Single 0.02 (7.52) -0.10 (6.83)
Multiple 5.08 (5.01) -0.68 (8.07)
EMT Certification 0.357
Basic -3.17 (16.17) -3.38 (9.91)
Intermediate 4.67 (3.51) 1.20 (2.17)
Paramedic 1.18 (6.13) 0.06 (6.96)
Table 10: Grade Restrictions: Interaction Analysis for Change in Score by Urbanicity Urbanicity
Rural Mean (SD)
Urban Mean (SD) p
Age 0.463
18 - 24 -2.33 (13.88) -2.93 (12.19)
25 - 29 -2.22 (9.54) -0.41 (5.43)
30 - 34 -0.63 (3.25) 1.00 (6.55)
35 - 40 0.94 (5.36) 1.69 (7.18)
>40 3.00 (8.51) 1.21 (4.57)
Gender 0.053
Female -2.88 (10.96) 1.39 (4.88)
Male 2.16 (6.65) 0.02 (7.12)
Race 0.519
Not White 0.83 (2.64) 2.89 (6.79)
White 0.98 (8.69) 0.18 (6.52)
Ethnicity 0.812
Hispanic or Latino -1.00 (.) -0.50 (3.54) Not Hispanic or Latino 1.00 (8.36) 0.39 (6.59)
Employment Status 0.361
Full Time 0.39 (8.94) 0.69 (5.76)
Part Time 2.24 (5.52) -0.28 (8.52)
Counties 0.646
Single 0.13 (8.26) 0.27 (6.69)
Multiple 2.00 (8.12) 2.25 (4.20)
EMT Certification 0.283
Basic -6.00 (13.83) 1.47 (10.76)
Intermediate 1.50 (2.38) 3.00 (3.39)
Paramedic 1.29 (7.92) 0.15 (5.6)
Table 11: Non-Response: Demographic Analysis
Knowledge Test 1 Knowledge Test 2 Low Response Systems
% (n)
Other Systems % (n)
All Systems
% (n) p
Age 0.857
18 - 24 9.71 (17) 10.78 (25) 9.91 (21)
25 - 29 21.14 (37) 19.83 (46) 17.92 (38)
30 - 34 17.14 (30) 18.97 (44) 14.15 (30)
35 - 40 12.00 (21) 10.78 (25) 14.62 (31)
>40 40.00 (70) 39.66 (92) 43.4 (92)
Gender 0.573
Female 25.71 (45) 29.74 (69) 30.19 (64)
Male 74.29 (130) 70.26 (163) 69.81 (148)
Race 0.163
Not White 13.71 (24) 9.74 (22) 7.84 (16)
White 86.29 (151) 90.27 (204) 92.16 (188)
Ethnicity 0.126
Hispanic or Latino 4.57 (8) 4.87 (11) 1.47 (3)
Not Hispanic or Latino 95.43 (167) 95.13 (215) 98.53 (201)
Employment Status <0.001
Full Time 92.00 (161) 72.84 (169) 74.53 (158)
Part Time 8.00 (14) 27.16 (63) 25.47 (54)
Counties <0.001
Multiple 7.43 (13) 6.90 (16) 20.28 (43)
Single 92.57 (162) 93.1 (216) 79.72 (169)
EMT Certification <0.001
Basic 14.86 (26) 21.12 (49) 10.85 (23)
Intermediate 12.57 (22) 6.47 (15) 4.25 (9)
Paramedic 72.57 (127) 72.41 (168) 84.91 (180)
Table 12: Non-Response: Grade Comparisons
Knowledge Test 1 Knowledge Test 2 Low Response Systems
Mean (SD)
Other Systems Mean (SD)
All Systems Mean (SD) Age
18 - 24 65.65 (15.76) 72.12 (8.7) 71.76 (10.12)
25 - 29 70.24 (14.14) 70.37 (11.37) 73.71 (10.87)
30 - 34 70.65 (16.29) 72.70 (9.25) 76.43 (5.82)
35 - 40 77.43 (7.12) 72.96 (9.81) 72.58 (10.98)
>40 73.69 (9.84) 71.65 (10.05) 74.19 (8.01)
Gender
Female 72.64 (14.56) 74.26 (7.78) 75.75 (7.57)
Male 71.92 (12.13) 70.71 (10.63) 73.18 (9.48)
Race
Not White 69.5 (14.89) 69.68 (10.38) 72.00 (8.52)
White 72.52 (12.39) 72.17 (9.69) 74.28 (9.03)
Ethnicity
Hispanic or Latino 66.75 (11.34) 73.00 (5.74) 79.33 (5.03) Not Hispanic or Latino 72.36 (12.79) 71.87 (9.94) 74.02 (9.02) Employment Status
Full Time 72.01 (12.78) 70.98 (10.22) 73.67 (8.91)
Part Time 73.29 (12.77) 73.87 (9.06) 74.67 (9.29)
Counties
Multiple 65.40 (19.57) 73.14 (10.25) 71.00 (13.21)
Single 72.73 (11.82) 71.7 (9.98) 74.20 (8.56)
EMT Certification
Basic 62.19 (15.46) 63.47 (9.57) 65.26 (8.77)
Intermediate 71.14 (12.07) 62.53 (13.13) 73.78 (5.78)
Paramedic 74.27 (11.32) 75.18 (7.48) 75.04 (8.6)
Table 13: Mean Test Scores by Demographics and Course Assignment Frequencies Knowledge Test Score
Mean (SD)
Number of Courses Assigned
6-11 12-17 18-24
Age (n=656)
18 - 24 70.85 (11.55) 14.93 (10) 53.73 (36) 31.34 (21)
25 - 29 71.60 (12.55) 13.43 (18) 48.51 (65) 38.06 (51)
30 - 34 73.54 (11.50) 22.32 (25) 42.86 (48) 34.82 (39)
35 - 40 75.25 (8.58) 20.00 (16) 51.25 (41) 28.75 (23)
>40 74.05 (9.62) 15.59 (41) 39.16 (103) 45.25 (119)
Gender (n=656)
Female 75.34 (9.55) 22.28 (43) 43.01 (83) 34.72 (67)
Male 72.42 (11.11) 14.47 (67) 42.12 (195) 43.41 (195)
Race (n=641)
Not White 70.69 (11.73) 13.43 (9) 35.82 (24) 50.75 (34)
White 73.66 (10.58) 17.42 (100) 43.38 (249) 39.20 (225)
Ethnicity (n=641)
Hispanic or Latino 71.88 (8.60) 16.67 (4) 45.83 (11) 37.50 (9) Not Hispanic or Latino 73.40 (10.81) 17.02 (105) 42.46 (262) 40.52 (262) Employment Status (n=619)
Full Time 72.64 (11.11) 16.22 (78) 40.12 (193) 43.66 (210)
Part Time 75.28 (9.30) 18.12 (25) 52.17 (72) 29.71 (41)
Counties (n=619)
Multiple 72.53 (10.32) 19.57 (9) 43.48 (20) 36.96 (17)
Single 73.33 (13.59) 16.40 (94) 42.76 (245) 40.84 (234)
EMT Certification (n=656)
Basic 63.96 (12.22) 2.68 (3) 25.89 (29) 71.43 (80)
Table 14: Course Assignment Frequency
Course Frequency Count Percent
Pediatric Destination Decision-Making 639 95.80
Pediatric Complicated Trauma 606 90.85
Pediatric Behavioral/Psychiatric Emergencies 596 89.36
OB General Trauma 594 89.06
Pediatric General Trauma 594 89.06
Pediatric Abuse 584 87.56
Normal Childbirth 541 81.11
Infant & Newborn 500 74.96
Pediatric Assessment and Development 477 71.51
Pediatric Asthma 469 70.31
Pediatric Neuro 456 68.37
Pediatric GI 456 68.37
Late OB Emergencies 448 67.17
OB Abuse 446 66.87
Pediatric Allergic Reaction & Anaphylaxis 438 65.67
Abnormal Childbirth 421 63.12
Pediatric Upper Airway and Obstructions 388 58.17
Pediatric Medical Response 364 54.57
Pediatric Poisoning 348 52.17
Pediatric Lower Airway and Interparenchymal 337 50.52
Pediatric Thermoregulation 295 44.23
Pediatric Cardiac 282 42.28
Early OB Emergencies 275 41.23
OB Emergencies 232 34.78
Overall Performance Mean (%) SD (%)
Pediatrics 72.77 11.94
Table 15: Demographics by Block Block 1
% (n)
2 % (n)
3 % (n)
4 % (n) Age
18 - 24 7.81 (5) 0 (0) 12.00 (9) 9.72 (7)
25 - 29 14.06 (9) 33.33 (1) 26.67 (20) 12.50 (9) 30 - 34 15.63 (10) 33.33 (1) 13.33 (10) 13.89 (10)
35 - 40 6.25 (4) 0 (0) 14.67 (11) 22.22 (16)
>40 56.25 (36) 33.33 (1) 33.33 (25) 41.67 (30) Gender
Female 32.81 (21) 0 (0) 36.00 (27) 22.22 (16)
Male 67.19 (43) 100 (3) 64.00 (48) 77.78 (56)
Race
Not White 8.62 (5) 0 (0) 9.33 (7) 5.71 (4)
White 91.38 (53) 100 (3) 90.67 (68) 94.29 (66)
Ethnicity
Hispanic or Latino 1.72 (1) 0 (0) 1.33 (1) 1.43 (1) Not Hispanic or Latino 98.28 (57) 100 (3) 98.67 (74) 98.57 (69) Employment Status
Full Time 75.00 (48) 100 (3) 70.67 (53) 68.06 (49) Part Time 25.00 (16) 0 (0) 29.33 (22) 31.94 (23) Counties
Single 96.88 (62) 0 (0) 88.00 (66) 93.06 (67)
Multiple 3.13 (2) 100 (3) 12.00 (9) 6.94 (5)
EMT Certification
Basic 14.06 (9) 33.33 (1) 8.00 (6) 11.11 (8)
Intermediate 1.56 (1) 0 (0) 4.00 (3) 6.94 (5)
Table 16: Demographics by Urbanicity Urbanicity Rural
% (n)
Urban % (n) Age
18 - 24 8.11 (6) 10.71 (15)
25 - 29 14.86 (11) 20.00 (28)
30 - 34 14.86 (11) 14.29 (20)
35 - 40 25.68 (19) 8.57 (12)
>40 36.49 (27) 46.43 (65)
Gender
Female 25.68 (19) 32.14 (45)
Male 74.32 (55) 67.86 (95)
Race
Not White 8.33 (6) 7.46 (10)
White 91.67 (66) 92.54 (124)
Ethnicity
Hispanic or Latino 1.39 (1) 1.49 (2) Not Hispanic or Latino 98.61 (71) 98.51 (132) Employment Status
Full Time 68.92 (51) 72.86 (102)
Part Time 31.08 (23) 27.14 (38)
Counties
Single 83.78 (62) 95.00 (133)
Multiple 16.22 (12) 5.00 (7)
EMT Certification
Basic 6.76 (5) 13.57 (19)
Intermediate 5.41 (4) 3.57 (5)
Paramedic 87.84 (65) 82.86 (116)
Table 17: Change in Score by Block Block 1
Mean (SD)
2 Mean (SD)
3 Mean (SD)
4 Mean (SD) Age
18 - 24 -2.00 (11.38) . (.) -1.11 (14.15) -5.71 (10.77) 25 - 29 0.00 (6.71) 37.00 (.) 0.50 (5.46) -3.67 (8.8) 30 - 34 0.70 (8.68) 4.00 (.) -0.10 (3.84) -0.40 (3.53)
35 - 40 7.25 (10.14) . (.) 3.09 (4.81) -1.19 (5.59)
>40 1.00 (5.31) 0 (.) 1.32 (7.32) 2.03 (6.07)
Gender
Female 1.00 (5.7) . (.) -0.07 (6.34) -2.06 (9.86)
Male 0.95 (7.58) 13.67 (20.31) 1.42 (7.78) -0.04 (5.93) Race
Not White 0.4 (8.82) . (.) 3.14 (3.93) 0.50 (3.32)
White 0.91 (7.01) 13.67 (20.31) 0.65 (7.52) -0.48 (7.23) Ethnicity
Hispanic or Latino 2.00 (.) . (.) -1.00 (.) -3.00 (.) Not Hispanic or Latino 0.84 (7.15) 13.67 (20.31) 0.91 (7.33) -0.39 (7.1) Employment Status
Full Time 0.69 (7.16) 13.67 (20.31) 1.02 (5.88) -0.18 (7.12)
Part Time 1.81 (6.5) . (.) 0.55 (10.05) -1.13 (6.74)
Counties
Single 0.94 (7.08) . (.) 0.03 (7.11) -0.46 (7.13)
Multiple 2.00 (1.41) 13.67 (20.31) 7.11 (5.51) -0.8 (4.66) EMT Certification
Basic 5.56 (7.25) 37.00 (.) -3.17 (16.17) -3.38 (9.91)
Intermediate 1.00 (.) . (.) 4.67 (3.51) 1.2 (2.17)
Table 18: Change in Score by Urbanicity Urbanicity Rural
Mean (SD)
Urban Mean (SD) Age
18 - 24 -2.33 (13.88) -3.07 (11.76)
25 - 29 2.55 (14.8) -0.50 (5.35)
30 - 34 -1.00 (3.74) 0.85 (6.41)
35 - 40 0.37 (5.23) 3.08 (8.18)
>40 3.00 (8.51) 0.75 (4.64)
Gender
Female -3.00 (10.39) 0.96 (4.97)
Male 2.69 (8.07) 0.00 (7.14)
Race
Not White 0.83 (2.64) 2.1 (6.87)
White 1.38 (9.48) 0.08 (6.53)
Ethnicity
Hispanic or Latino -1.00 (.) -0.50 (3.54) Not Hispanic or Latino 1.37 (9.16) 0.24 (6.59) Employment Status
Full Time 1.16 (9.6) 0.59 (5.8)
Part Time 1.39 (7.7) -0.45 (8.2)
Counties
Single -0.23 (8.04) 0.32 (6.64)
Multiple 8.75 (10.31) 0.00 (4)
EMT Certification
Basic 2.6 (22.66) 1.47 (10.76)
Intermediate 1.5 (2.38) 3.00 (3.39)
Paramedic 1.11 (7.74) 0.00 (5.68)