1.
Abstract
To the best of our knowledge, there is no literature at this point in time which indicates how heavily the physician considers the evolving story of clinical support behind each off-label use of a drug. According to previous studies, off-label prescriptions, or any FDA unapproved use for an approved drug, comprise over 30% of all prescriptions by physicians in the United States. Though the FDA currently bans promotion of drugs for off-label uses, a physician is free to prescribe the choice that maximizes their patient’s health. In this paper, we use prescription level data from the Medical Expenditure Panel Survey (MEPS) from 2007 to 2011. We first determine
whether each prescription was an on-label or off-label, and then match the off-label indications
2.
Acknowledgements
I’d like to first thank my advisor, Dr. Jonathan Wallace Williams, for helping me through
every step of the journey that is the senior’s honors thesis. As a student with little knowledge of
econometrics prior to this year, I had much to learn about statistics, programming, and their
applications to the discipline of economics. Dr. Williams’s brilliance, limitless patience, and
dedication to his research have been both grounding and inspiring, and I am incredibly thankful
for his guidance during the writing of this paper. His ability to answer the most complex
questions with simple and powerful models has demonstrated to me the scope of econometrics
and its applicability to whatever I choose to study in the future. His mentorship has left me with
a deep respect for academia and an enthusiasm to continue studying the healthcare sector after
the completion of this thesis.
I’d also like to thank Dr. Klara Peter, our faculty advisor, for her unending support over
the course of the year and desire to push us to our limits through the thesis class. It has been truly
humbling to learn advanced econometric approaches from an experienced researcher and
academic such as herself. I especially appreciate and am grateful for her willingness to take time
outside class and sit down with us to troubleshoot data or econometric issues at any given point
of this year. Last but not least, it has been an honor to undertake this research project along with
my classmates in the department, who are not only driven and bright, but also collegial and kind.
I feel very fortunate to have been able to expand my knowledge and research experience with the
3.
Introduction
Currently, the Food and Drug Administration (FDA) bans the promotion of off-label uses
of approved drugs as “misbranding” and has restricted marketing to only “on label” indications.
An off-label indication is essentially any use of a drug for which it did not receive FDA
approval, and has varying degrees of support in clinical studies (Shapiro 2016). Though off-label
promotion is prohibited by the FDA, physicians are permitted to prescribe patients any drug that
they deem most effective, given that it is FDA-approved for some indication. In this thesis, we
took prescription level data, determined whether an observation was on-label or off-label, and
then matched the off-label indications to their associated clinical support. We then used an
alternative-specific conditional logit model to evaluate the marginal effects of clinical support
variables on off-label prescribing behaviors, while controlling for other determinants of the
physician’s choice. Our results found that physicians favor off-labelled indications with greater
clinical support, specifically indications with randomized/controlled studies, efficacy, and
supporting publications.
1.1 Welfare Implications of Off-label Prescriptions
Due to the ambiguous effects of off-label drug use in the past, the prohibition of off-label
promotion is strictly enforced by the United States Department of Justice (DOJ) through the
Federal False Claims Act (FCA) (CMS 2015). Unlawful off-label promotion is a controversial
topic due to two main challenges these type of prescriptions pose. Firstly, they provide drug
manufacturers with an additional channel to make claims for payments from Medicaid, possibly
off-label drugs could actually pose as potentially harmful to the health of the patients they are
prescribed to.
Despite all the stringent legislation on off-label promotion, the physician has complete
legal say over what is actually being prescribed to the patient, with the expectation that he/she
will choose the health-maximizing option. However, the literature has shown mixed results in the
clinical practice of off-label uses. An example of a positive outcome is beta-blockers which were
traditionally used as drugs for hypertension among other cardiovascular diseases. Medical
professionals eventually realized that these drugs could also be used to curb anxiety and thus
prescribed them off-label. In fact, 52% of prescriptions for beta-blockers were off-label from
1999 to 2002 (Williams et al. 2014). That said, there have been cases where off-label use has led
to harmful results for patients. In the 1990s, an off-label combination of weight loss drugs, which
were individually safe, led to heart-valve damage for several of its users.
The variable effects of off-label prescriptions are what make the physician’s choice an
interesting one to investigate. If the off-label alternative is only slightly more effective than an
on-label medication, prescribing it may be considered an unnecessary risk. On the other hand, if
the off-label treatment has been proven to be much more effective than any existing
FDA-approved options, then the physician’s prescription of it could provide significant benefit to the
patient. To the best of our knowledge, there is no literature at this point in time which indicates
how heavily the physician considers the evolving story of clinical support behind each off-label
use. Through our research, we make a number of contributions towards quantifying the clinical
support of off-label indications and determining whether prescribing practices are actually
1.2 Regulatory Environment and Recent Settlements
The dual standard of the off-label promotion ban coupled with the freedom the physician
has to choose any prescription has been a source of controversy between pharmaceutical
companies and regulatory bodies. From 1993 to 2008, the proportion of off-label prescriptions
rose from 30.2% to 39.1% (Williams et al. 2014). Likewise, since 2004, the FDA has pursued
over 30 cases with pharmaceutical companies, who have paid over $12 billion of fines over
off-label promotion activities (Shapiro 2016). As the frequency of off-off-label prescribing increased
over the past few decades, so has the stringency of FDA regulation on off-label drug promotion.
However, since the early 2000s, the FDA has faced a string of legal setbacks over
off-label promotion, among which the most publicized case has been Amarin Pharma, Inc. v. FDA
(2014). The FDA charged Amarin, the drug manufacturer of the cardiovascular drug, Vascepa,
for promoting the drug’s off-label use of targeting blood lipids. This was a use that was well
supported by clinical evidence and accredited by the physician community. Thus, Amarin’s
conviction was dropped by the Supreme Court citing the First Amendment, that “the government
may not prohibit or criminalize truthful off-label speech.” In other words, Amarin and other
manufacturers whom the FDA has lost settlements to have legal jurisdiction to promote off-label
uses of their drugs, as long as they have valid clinical support.
This landmark settlement, though not technically setting legal precedent, has paved the
way for other well-supported off-label uses to be promoted openly by manufacturers. Many
believe the outcomes of these cases can change how rigorously the DOJ will now pursue
regulatory action against off-label promotion, since clinical evidence has been central to the
arguments of both sides of the debate. This could alter not only the promotional activities of
increase in off-label prescribing took place over the period characterized by several settlements
between the Department of Justice (DOJ) and drug manufacturers (Williams et al. 2014). Given
the change in the regulatory environment, our research on how well supported off-label
prescriptions are becomes even more pertinent and hopes to contribute to the ongoing discussion.
1.3 Policy Implications for Off-Label Promotion
Needless to say, the controversy around off-label promotion has been at the forefront of
the discussion for policymakers and regulators. Currently, the FDA is entertaining the possibility
of changing its regulatory policy and is holding public hearings on the topic of off-label
promotion (National Law Review 2016). Accordingly, as part of creating an open forum for
discussion, the agency is requesting any input from national stakeholders on the issue. They are
calling for research addressing several broad questions, among which two are potential areas of
contribution for our work, specifically:
(i) “How increased off-label promotions could impact public health”
(ii) “Factors the agency should consider in evaluating whether off-label promotions are
truthful or misleading.”
In order to answer these questions, we have constructed different measures that indicate
clinical support, through comprehensive study of the off-labelled indications described in the
online medical textbook, Merck Manual Professional Version. These measures include, but are
not limited, to the characteristics of the clinical studies, the safety and efficacy of the drug use
for the indication, and the level of publication in papers and guidelines. Our research thus gives
important insight for regulatory bodies into current off-label prescribing behavior, by
determining whether or not physicians are prescribing drugs in a manner that improves public
regulatory environment need to be prescribing alternatives that maximize patient utility.
Secondly, our research will be helpful in understanding and detecting for any potential
risks in usage. In addition to evaluating a drug’s efficacy, we have also encoded variables for
adverse drug reactions (ADRs) or boxed warnings as well as risk factors into our dataset, which
will flag for any safety hazards. Thus, our data provides a preliminary list of risky off-labeled
indications to go through for any regulatory agency seeking to check for untruthful or misleading
off-label promotion.
Overall, our thesis hopes to further the policy discussion started by the FDA by
investigating physician choices in a novel way and addressing a question that has previously
never been raised in the literature. Through this study, we have gained enormous insight into the
gains in public health by establishing a casual effect between clinical support for an indication
and off-label prescribing behavior. Given the relevance of this research in the current regulatory
climate and the significant welfare implications it could pose, our results could possibly even
4.
Literature Review
The literature on off-label prescriptions has been primarily anecdotal and comprises of
case-by-case reports of the usage for different indications. Of greater interest have been the
papers that model the factors affecting physician’s prescription choice. The current literature
looks at the relationship between marketing/promotion, adverse drug reactions (ADRs), and –
directly or indirectly – off-label prescriptions. These papers have been helpful in building the
conceptual framework for this model. However, at the same time, the literature has differed
widely in the variability of its results and there is no consistent message on the efficacy of
off-label uses and rarely ever a mention of clinical support as a significant factor in decision making
process. For this reason, we believe our research has bridged a wide gap in the literature in terms
of the drivers of off-label prescribing.
2.1 Off-label Use, Promotion, and Adverse Drug Reactions (ADR’s)
Though there is little doubt that instances of off-label use have resulted in positive public
health outcomes, there have also been situations where these prescriptions have led to
detrimental health. As mentioned earlier, in the 1990s, a physician Dr. Michael Weintraub
showed through a case study of 121 patients that a certain “off-label” drug combination was
effective for weight loss. Fenfluramine and phentermine, were both weight-loss drugs which
caused a loss of 30 pounds of average in the sample of study when used together. Since there had
been no previous evidence of adverse events for either drug, it was assumed that the interactions
of the “Fen-Phen” combination would be safe (Kolkata 1997). However, the study resulted in
several patients suffering from heart-valve damage (O’Reilly and Dalal 2003). This is a clear
The study does not, however, capture a causal relationship between lack of clinical support and
welfare effects, calling for further study on characteristics that determine an effective evidence.
The literature has also linked drug promotion – potentially off-label- with the likelihood
of adverse drug reactions (David et al. 2010). In their paper on the effects of drug marketing and
promotion on ADRs, David, Markowitz, and Richards-Shubik find the two most significant
factors to be the channel of promotion as well as the condition being treated. The salient
observation is that promotion overall can lead to more ADR’s for conditions where the diagnosis
or risks are harder to assess (arthritis pain, depression, etc.) This conclusion emphasizes the need
for greater surveillance on the promotion of drugs for these conditions and contextualizes the
FDA’s concerns over off-label promotional activity, since these indications have limited
information on safety (David et al. 2010). Though the unique safety-benefit portfolio model used
by the authors and the results are interesting, their study does not indicate which drugs are a
cause for concern or whether the prescriptions are on-label or off-label.
Another study takes a different approach in investigating the extent to which promotion
causes specifically off-label prescribing, but does not take into account the positive or negative
welfare effects of these prescribing behaviors (Shapiro 2016). Their model assumes that
information shocks, in the form of consensus statements released by clinical studies, will
increase the marketing activities of drug companies and potentially affect off-label prescribing
behavior. The marketing activities geared specifically towards physicians by sales
representatives is termed “detailing.” Shapiro concludes that through there is a positive and
statistically significant effect of detailing on off-label prescribing, detailing actually slightly
pushes the distribution of prescriptions towards on-label instead of off-label (Shapiro 2016).
off-label prescribing, there are two significant limitations that make it inapplicable to the focus of
our research and that we hope to address. Firstly, the literature only considers physicians that
receive detailing during the sample period that enter the estimation, a phenomenon that is termed
the “treatment effect on the treated.” Secondly, and more importantly, information shocks in the
form of consensus statements do not capture the evolving body of clinical support for each
off-labelled indication. In our study, we look at a much larger sample of physicians from the Medical
Expenditure Panel Survey (MEPS) to remove any bias on the estimation. Moreover, our dataset
evaluates a more comprehensive outlook on clinical support for various indications, providing
better measures of the information that is out there on off-label uses and how responsive
physicians are to said information.
2.2 Trends and Drivers of Off-label Prescribing
There is also a great degree of variability in the literature on the actual off-label
prescribing rates among physicians in the United States. In the two papers that attempt to
determine this rate, the empirical models use an innovative combination of data, which involves
matching prescriptions from the panel survey to the database of drugs and approved indications,
in order to determine whether a prescription is on- or off- label (Shapiro 2016; Williams et al.
2014). However, only one of these papers takes into account the problem of detection. Off-label
prescribing could be underreported due to administrative errors, form limitations (in this case
NAMCS), or even the incentive for physicians to misreport. By using a detection controlled
estimation (DCE) methodology to investigate this behavior, a much higher rate of off-label
prescribing is determined, nearly 35% in comparison to the 14% without the control (Shapiro
Williams, Bradford, and Turner in their DCE study examine physician prescribing
behavior more generally and looked for trends and drivers of off-label prescriptions. The results
of their model made several novel conclusions, with the main being a general trend in off-label
prescribing increasing from 30.2% to 39.1% from 1993 to 2008 (Williams et al. 2014). Medicaid
patients are the most likely to be prescribed off-label with an estimate of 34.2%; given that
Medicaid expenditures total $15.2 billion (as of 2008), this finding becomes an important focus
for further study. Moreover, certain off-label prescribing patterns are consistent with welfare
enhancement as a 10% increase in on-label alternatives would decrease off-label prescribing by
5% (Williams et al. 2014). This paper largely informs the basis for my empirical model and
highlights significant variables I should control for when determining the casual effect of clinical
support on off-label prescribing.
In sum, though there are numerous clinical papers written anecdotally on off-label use,
there has been relatively little work done so far on off-label prescribing and the factors that drive
it. A few papers have looked at modelling the physician’s prescription choice; however, even the
most relevant and recent work does not take into account the impact of clinical support on
decision making (Williams et al. 2014; Paker et al. 2016). To the best of our knowledge, there
has been no pre-existing literature studying clinical data in such a comprehensive manner, which
has greatly influenced our choice of topic and where we hope to make a major contribution in
this relatively understudied body of research. For this reason, clinical support is a major focus
for understanding off-label prescribing behavior and is important in the prediction of related
5.
Data Sources
Our analysis seeks to use an unconventional combination of data from sources that have
previously been utilized in the literature on off-label prescriptions as well as sources that have
never been leveraged in this area of study and that have lent novel insights.
The Medical Expenditure Panel Survey (MEPS) comprises the bulk of our data,
informing our dependent and control variables. MEPS can be used to provide an extensive range
of information on the civilian population in the U.S, including but not limited to demographics,
insurance status, and various measures of health status. In addition to this data, we are interested
in the detailed (generic) drug name, drug class, and an ICD-9 code for every active prescription.
The ICD-9 code essentially indicates the diagnosis for which the prescription is being provided
to the patient. Our data looks at approximately 231, 237 non –refill prescriptions from 60, 750
patients over the period of 2007-2011, which is the time period of the study (Paker et al. 2016).
In order to be able to identify whether each prescription is on-label or off-label, we
further link the MEPS data with data from the Physicians’ Desk Reference (PDR), which lists the
FDA-approved indications, for each drug over the period of 2007-2011. This information was
extracted from hard copies of the annual editions of the PDR through the usage of
high-resolution scanner and Optical Character Recognition software (Paker et al. 2016). The text
descriptions of those indications were then translated into their corresponding ICD-9 codes by a
Clinical Documentation Specialist from a major medical center in Cleveland, OH (Paker et al.
2016). With these two datasets, we were able to determine whether or not the ICD-9 code (from
MEPS) for the prescribed drug matched any of the ICD-9 codes for approved uses (from the
PDR). If there was a match, the prescription was considered on-label; the lack thereof indicated
An online version of The Merck Manual, a database of drug information and oldest
medical textbook, provided drug-level information on our independent variables, including but
not limited to generic name, labelled indications, off-labelled indications, boxed warnings etc.
The Merck Manual is a dataset that has never been utilized in relevant literature and has imparted
significant insight into physicians’ off-label prescribing behavior. Data was scrubbed from the
website and the off-labelled content for each drug, of significance to our study, was further
divided into individual indications, each of which contained a description on various
characteristics of clinical support for each off-label use.
We manually read through and analyzed each description in order to identify different
attributes of clinical support that could drive a prescription decision – level of control or
randomization in each clinical study, the presence of placebo, the degree of observations, the
incidence of ADRs, whether or not the study has been published, and if so in how many and
which papers and journals. The Manual also includes information on drug interactions, boxed
warnings, and importantly, the generic name of the drug. The generic name was one component
we used to eventually merge the Merck data with the MEPS data.
We then had the same Clinical Documentation Specialist codify the Merck descriptions of
the off-labelled indications into their respective ICD-9 codes. We used this information to
construct a separate database which contained ICD-9 codes for both on-label and off-label
indications at a drug-level. Using this data, we created a choice set for a particular diagnosis; for
example, an ICD-9 code of “556” could have 2 on-label alternatives and 8-off label alternatives.
This choice set was then merged with Merck data (based on generic name and ICD-9 code) so
that each off-label alternative possessed a vector of clinical support variables. This merged
dataset for regression analysis was in long form, listing first the actual MEPS prescription choice
and underneath it all the foregone on-label and off-label alternatives for a particular ICD-9 code.
One of the limitations posed by the MEPS form was that ICD-9 codes could contain only
two or three characters (no decimals), and thus we extracted only the first 3 digits of each code
transcribed by the specialist. Due to this decrease in specificity, the Merck data had to be sorted
based on generic name and ICD-9 code; on a drug level, this led to there being several
off-labelled indications with the same ICD-9 code. We therefore collapsed Merck observations with
the same generic name and ICD-9 code, by averaging of the values of the categorical variables
for clinical support variables. Our rationale for doing so was firstly to make the merge between
Merck, MEPS, and the choice sets feasible in Stata through unique matches of generic name
and/or ICD-9 code. Secondly, we assumed that off-labelled indications with the same 3-digit
6.
Theoretical Model and Econometric Methodology
The theoretical model for my paper follows that of a discrete choice random utility
model, a framework that is well supported in the literature (Greene 2009) and is used to analyze
a decision maker’s preferences among a finite set of alternatives. The individual choice is viewed
as the physician’s, who considers multiple factors before arriving at a prescription choice that
would maximize the patient’s utility. However, we cannot observe all factors that could affect
the physician’s preferences and thus we will use a functional representation of latent utility that
captures observed and unobserved factors. To demonstrate this, consider a physician’s choice
among two prescription alternatives, 𝑎 and 𝑏, and let utility for the two options be given by:
𝑈$ = 𝑥$𝛽 + 𝜀$
𝑈+ = 𝑥+𝛽 + 𝜀+
In this representation, 𝑥 includes observable attributes of the two options, such as
whether the option is FDA-approved for the patient’s ailment or the clinical support if the option
is off-label, and 𝜀 captures the unobservable features, such as patient risk factors, complications,
medical history, etc. We assume that the utility is observable to the physician and patient, and
that the option with the highest utility is chosen for the patient (Greene 2009).
However, because 𝜀 is unobserved to us, only probabilistic statements can be offered as a
function of 𝑥 and the parameter vector 𝛽. For example, in the two-option example above, the
probability that option 𝑎 is chosen is:
𝑃𝑟 𝑈$ > 𝑈+
= 𝑃𝑟 𝑥$𝛽 + 𝜀$ > 𝑥+𝛽 + 𝜀+
= 𝑃𝑟 𝜀+− 𝜀$ < 𝑥$𝛽 − 𝑥+𝛽
where 𝜀 = 𝜀$− 𝜀+, 𝑥 = 𝑥$ − 𝑥+, and 𝐹3 is the cumulative distribution function of 𝜀. If
parametric assumptions are made on 𝐹3, the probability of option 𝑎 (and subsequently option 𝑏)
can be calculated for any value of the preference parameter, 𝛽. The goal would then be to infer
𝛽 via maximum likelihood estimation techniques (Greene 2009).
In our application, we must enrich the simple binary choice example to include a varying
number of alternatives for each patient and make parametric assumptions so that the model is
computationally tractable. We assume that 𝐹3 is such that the predicted probabilities yield a
conditional multinomial logit model. Specifically, if there are 𝐽(𝑖) alternatives for patient 𝑖, the
probability that an alternative 𝑘 is chosen amongst the alternatives is:
𝑃:;<= 𝑃𝑟 𝜀= < 𝜀;+ 𝑥;𝛽 − 𝑥=𝛽, ∀𝑗 ≠ 𝑘 =
𝑒𝑥𝑝 (𝑥;<𝛽) 𝑒𝑥𝑝 (𝑥=<𝛽)
C(:) =DE
Each alternative 𝑘 is associated with a vector of regressors, which is specific to the
alternative; our analysis in particular deals with a vector of clinical support variables. The other
prescribing drivers - which include patient characteristics, insurance status, the number of
FDA-approved drugs for the condition - vary across prescriptions but not across the alternatives for
each case. This results in all patient-specific variables factoring out of the probability and
cancelling out. Thus, our structural model of physician decision making will only identify the
role of variables describing clinical support across the alternatives for the patient’s ailment.
In order to estimate the 𝛽 vector that measures the important of different measures of
clinical support in physician decision making, we construct the likelihood function
corresponding to the alternative-specific conditional logit model we describe above. This is a
ℒ = 𝑃:;<
:
where 𝑃:;< denotes the probability that patient i chose option 𝑘 among their 𝐽(𝑖) options. Our
estimate of 𝛽 maximizes this likelihood function, characterizing the data-generating process that
most likely generated our data. The estimates obtained for the alternative-specific parameters
will inform our analysis on how the nature of clinical support affects off-label prescribing, since
we only have alternative-specific vectors for the off-label alternatives.
While the alternative-specific conditional logit model is flexible, it is not without its
limitations. One of the limitations of standard logit model is the independence of irrelevant
alternatives (IIA) property (Green 2009). This implies that adding or changing an alternative
does not affect the relative odds between two existing options, which is not necessarily a realistic
depiction of decision-making behavior. One way to relax this assumption would be to rank
alternatives through a nested logit; however, due to the problem of unobservable attributes, we
are unable to determine this ranking. Thus, the probabilistic estimation of the parameters must be
7.
Results
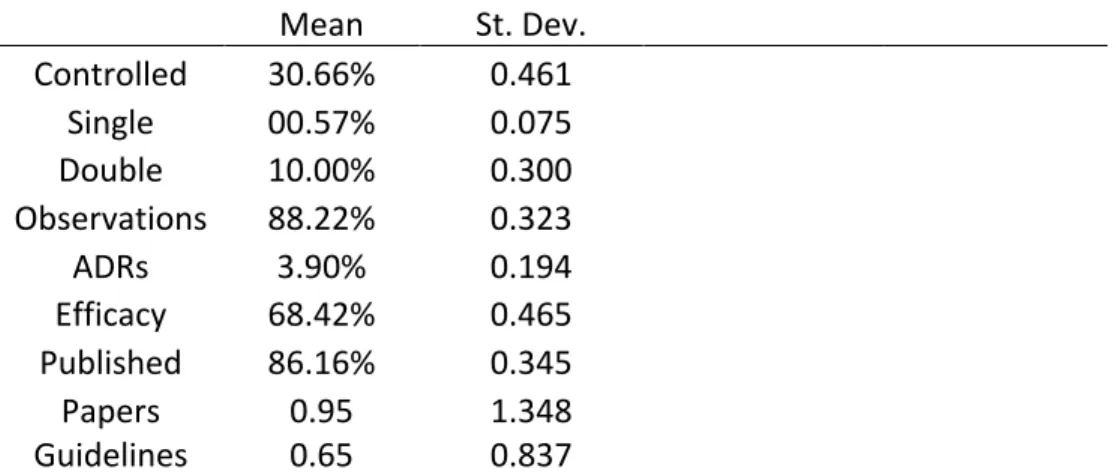
Descriptive statistics for the Merck Manual and MEPS data have been presented in Table
1 and Tables 2-4 respectively. Table 1, in particular, summarizes the different features of clinical
support that we encoded for. We can see that a high percentage of off-labelled indications in
Merck Manual dataset are considered safe and effective by the clinical community. 68% of the
current sample recommends the usage of a drug for the off-labelled indication. Furthermore,
nearly 86% of the off-labelled indications have been published in either papers or journal
guidelines with regards to their safety and efficacy, though there is relatively high degree of
variation in the number of papers or guidelines mentioned.
That said, clinical evidence for each indication on average was published in 0.86 papers
and 0.93 guidelines. Also promising is that less than 4% of the total sample mentioned the
presence of an adverse drug reaction (ADR) for the off-labelled indication. Finally, 30% of all
observations demonstrated clinical rigor by showing a level of randomization or control in a
clinical trial study, and 10% of these were double-blinded (where both participants and
researchers of the study are unaware as to who received the treatment). Overall, the summary
statistics seem to demonstrate a high caliber of clinical support for the off-labelled indications
listed in the Merck Manual.
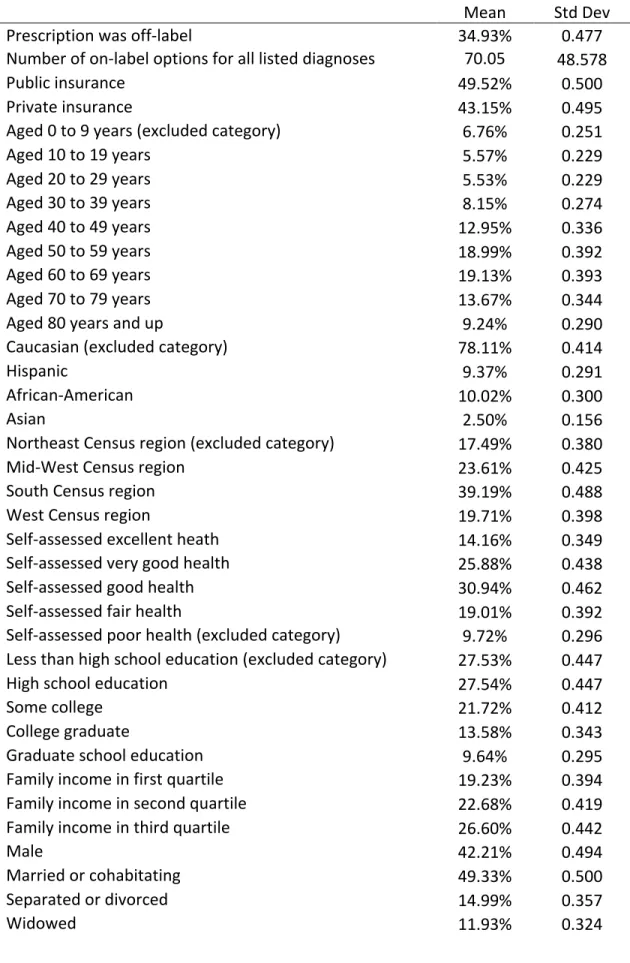
Table 2 provides descriptive statistics for the nationally representative MEPS sample
across the estimated period 2007-2011. From 231, 237 total prescriptions it was found that
34.93% of prescriptions of our overall MEPS sample were for off-label uses from 2007-2011.
The estimate is consistent with the results of a previous study mentioned that used detection
controlled estimation (DCE) methodology on National Ambulatory Medical Care Survey data
for all listed diagnoses, which was 70.05, with a large standard deviation of 48.578, indicating a
wide distribution (Paker et al. 2016).
The table also describes the case-specific variables used later in the alternative-specific
conditional logit model, including but not limited to patient characteristics (race, age, sex,
education levels, patient health status, etc.), source of payment for healthcare, number of ER and
doctor visits in a year, drug class, and so on. Though these descriptive statistics are interesting to
examine, they do not lend much insight into how each characteristic affects the physician’s
choice to prescribe off-label. Thus, we used linear probability and logit regressions to estimate
the marginal effects of these characteristics by controlling for effects of numerous determinants.
These results will be discussed later in this section.
Table 3 presents information on the rate of off-label prescribing specific to the various
drug categories. These categories were defined by the Multum Lexicon class codes, and the
classification was observed for all MEPS prescriptions. Across categories, we see variable
frequencies of off-label prescribing. Genitourinary track agents at 58.68% demonstrated the
highest incidence of off-label prescriptions, followed by central nervous system agents at
50.99%. The lowest rates of off-label prescribing were observed for metabolic agents at 13.40%
and respiratory agents at 27.70% (Paker et al. 2016).
Table 4, similarly, summarizes the variation of frequencies in off-label rates, but this time
for the twenty-five most-prescribed drugs in the MEPS sample. Again, we see a wide range in
the off-label prescribing rate from 3.09% (for insulin) to 76.20% (for gabapentin). Surprisingly,
these frequently prescribed drugs overall accounted for only 39% of the prescriptions in the
sample, which indicates that physicians extensively consider the available drug choices when
this analysis particularly due to their importance to regulators. Given that the clinical and public
health implications of off-label prescriptions are not completely understood, if the FDA sought to
monitor the practice to assure it did not lead to health inequities, this information would be
helpful in highlighting specific drugs and drugs classes.
Table 5 reports the results from the earlier mention probabilistic analysis of the effects of
different determinants of physician prescribing behavior (not looking at clinical support yet).
Two model specifications, the linear probability and logit models are used, where the
independent variable is the determinant and dependent variable is binary, indicating whether the
prescription is on-label or off-label. The first column shows estimated coefficients from the
linear probability model (LPM) and the second column presents marginal effects from the logit
model. Given the similarity of the results, our analysis will be focused on the latter model
specification. Controlling for other factors, most of these estimates were found to be significant
at the p<0.01 level.
From the table, we see that off-label rates are higher depending on certain patient
characteristics, and tend to affect more minorities and vulnerable populations. For example, the
incidence is higher for older populations as opposed to younger populations. The age group most
likely to be prescribed off-label were the oldest patients in the sample, over 80 years old, and
were 10.2% more likely to be prescribed than patients aged 10 to 19. Moreover, patients who
identified as something other than “White/Other” were significantly more likely to be prescribed
off-label (Paker et al. 2016). Hispanics (3.9%), Asians (3.5%), followed by African-Americans
(2.4%) were more likely to receive an off-label prescription than a person who did not identify as
a racial minority.
that a higher level of patient education decrease the likelihood of being prescribed off-label. As
an extreme example, a patient that completed their graduate studies is 1.9% less likely to be
subjected to this practice. Another important insight, particularly for government regulators, is
that patients with public insurance on average have slightly higher off-label rates (0.6%) than
those with private insurance. Furthermore, patients who self-reported to have experienced
declining health (through health status and number of ER visits, hospital visits, and doctor visits)
have a much higher likelihood of being prescribed off-label. Another extreme comparison shows
that a patient with poor health is 5.5% more likely to receive an unapproved prescription than a
patient that is in supposedly excellent health (Paker et al. 2016).
Lastly, and importantly, the logit results demonstrate the effect of the number of on-label
alternatives on the probability of an off-label drug being prescribed. For a given indication, the
number of FDA-approved alternatives were counted using data from the Physician’s Desk
Reference. We found that with an increase in one on-label option for a particular diagnosis, the
probability of an off-label prescription decreases by 0.4%. Up until now, the results have shown
that incidence of off-label prescribing has been more likely in older, minority, less educated, and
less healthy patients. This particular result in the first to show that off-label prescribing, by
increasing the alternatives available to the physician when there are few on-label options
available, have the potential to increase welfare.
Having looked at the different trends and drivers of off-label prescribing, we now
evaluate the actual public health implications of the practice by linking off-label prescription
data to variables of clinical support. Table 6 shows the marginal effects results for the
alternative-specific conditional logit model that was described in the empirical framework. Only
The primary conclusion that can be made from this model is what we had hoped to
expect – efficacy, the presence of randomized/controlled studies, and the publication of clinical
evidence in guidelines have a positive and significant effect on the probability of an off-label
prescription being chosen. An off-labeled indication is 4.1% more likely to be prescribed if it
was tested with an RCT, 2.5% more likely to prescribed if it was deemed effective by the clinical
literature, and 2.0% more likely to be prescribed for each additional medical guideline that
published and recommended its use. This essentially means that physicians on average are
prescribing drugs for off-labelled uses that have been tested in clinical trials and shown to be
effective and deemed effective by the physician community.
There is also significant relationship (p<0.10) between publication in papers and off-label
prescribing. The magnitude of the marginal effect is strikingly large and positive and shows that
with each additional paper published, the off-labelled indication is 18.4% more likely to be
prescribed. This may initially be a confounding result as papers, unlike guidelines, can publish
either an effective or ineffective finding for an off-label use of a drug. Guidelines, on the other
hand, are recommendations based on clinical evidence and tend to include consensus statements
on the best and most effective practices in medicine. However, the result can be explained by
positive selection bias, that is, clinical trials and studies devote more time and energy towards
researching off-label uses that they believe are more likely to effective than not.
Next, the table shows that physicians are negatively responsive to claims that the drug
has adverse reactions for a particular use and risky for patients with certain characteristics. To
reiterate, an adverse drug reaction (ADR) is a harmful effect caused by taking the drug. Patient
risk factors are certain characteristics that make the patient more prone to harm when taking the
or risk factors, likely not coincidentally, giving us a small sample for comparison. Thus, though
these results are not statistically significant, the general negative trend is promising.
Not included in this regression table were certain characteristics of clinical trials
(single-blind, double-(single-blind, observational intensity). These were highly correlated with the other clinical
support variables, for example “single-blind” with “RCTs”, and were therefore dropped for
clarity in interpretation.
In addition to the IIA assumption made earlier, another major limitation to our results is
the potential bias created by the imputation of missing values. The descriptions for clinical
support varied in length and detail across off-labelled indications and thus the variables were
defined in a way that could encompass the scope of the data. For example, if level of
randomization/control was not mentioned for a study, that observation would get a value of “0”
for the categorical variable.
Our assumption was that missing values were not random in nature and Merck would not
deliberately leave out critical pieces of clinical evidence if they were existent. This allowed us to
impute values that were not described in the data. Furthermore, we took a practical and
conservative approach in our imputation to decrease the likelihood of an upward bias on the
estimators. Thus, it is likely that physicians are even more positively affected by the nature of
8.
Conclusion
Off-label prescriptions are highly prevalent yet understudied, and the levels of their clinical support even less so. In this paper, we take a crucial step towards identifying the factors that drive physician behavior, particularly off-label prescribing. We were optimistic that our findings would show welfare-maximizing practices, and our results indeed demonstrated that –
efficacy, the presence of randomized/controlled studies, and the publication of clinical evidence
in guidelines and papers have a positive and significant effect on the probability of an off-label
prescription being chosen.
Though our results do not indicate a direct policy measure, they are of particular
importance given recent policy developments. Despite some recent settlements that opposed the ban, the DOJ is still enforcing the FDA guidelines that outlaw off-label promotion for drugs. The literature has shown that this ban has the potential to harm welfare by limiting information to the physician and thereby decreasing the choice of drug alternatives available to them for patients with a given diagnosis. However, previously reported findings were not able to determine whether or not the practice of off-label prescribing was actually a boon for public health. This research study has proven off-label use increases welfare, because physicians are responsive to positive clinical support backing off-labelled indications.
Table 1: Variable Means and Standard Deviation (Merck Manual)
Mean St. Dev. Observations % of SampleControlled 30.66% 0.461 1409 100
Single 00.57% 0.075 1409 100
Double 10.00% 0.300 1409 100
Observations 88.22% 0.323 1409 100
ADRs 3.90% 0.194 1409 100
Efficacy 68.42% 0.465 1409 100
Published 86.16% 0.345 1409 100
Papers 0.95 1.348 1409 100
Guidelines 0.65 0.837 1409 100
Table 2: Variable Means and Standard Deviation (MEPS)
Mean Std Dev
Prescription was off-label 34.93% 0.477
Number of on-label options for all listed diagnoses 70.05 48.578
Public insurance 49.52% 0.500
Private insurance 43.15% 0.495
Aged 0 to 9 years (excluded category) 6.76% 0.251
Aged 10 to 19 years 5.57% 0.229
Aged 20 to 29 years 5.53% 0.229
Aged 30 to 39 years 8.15% 0.274
Aged 40 to 49 years 12.95% 0.336
Aged 50 to 59 years 18.99% 0.392
Aged 60 to 69 years 19.13% 0.393
Aged 70 to 79 years 13.67% 0.344
Aged 80 years and up 9.24% 0.290
Caucasian (excluded category) 78.11% 0.414
Hispanic 9.37% 0.291
African-American 10.02% 0.300
Asian 2.50% 0.156
Northeast Census region (excluded category) 17.49% 0.380
Mid-West Census region 23.61% 0.425
South Census region 39.19% 0.488
West Census region 19.71% 0.398
Self-assessed excellent heath 14.16% 0.349
Self-assessed very good health 25.88% 0.438
Self-assessed good health 30.94% 0.462
Self-assessed fair health 19.01% 0.392
Self-assessed poor health (excluded category) 9.72% 0.296 Less than high school education (excluded category) 27.53% 0.447
High school education 27.54% 0.447
Some college 21.72% 0.412
College graduate 13.58% 0.343
Graduate school education 9.64% 0.295
Family income in first quartile 19.23% 0.394
Family income in second quartile 22.68% 0.419
Family income in third quartile 26.60% 0.442
Male 42.21% 0.494
Married or cohabitating 49.33% 0.500
Never married (excluded category) 13.80% 0.345
Employed 41.87% 0.493
No ER visits in year (excluded category) 75.71% 0.429
One ER visit in year 16.49% 0.371
Two or more ER visits in year 7.80% 0.268
No inpatient admissions in year (excluded category) 82.66% 0.379
One inpatient admission in year 11.83% 0.323
Two or more inpatient admissions in year 5.51% 0.228 Less than three doctor visits in year (excluded category) 20.33% 0.402
Three to six doctor visits in year 22.80% 0.420
Six to twelve doctor visits in year 28.19% 0.450
More than thirteen doctor visits in year 28.69% 0.452
Other Drug Class 0.93% 0.096
Anti-Infectives 15.98% 0.366
Biologicals 0.01% 0.012
Cardiovascular Agents 20.94% 0.407
Central Nervous System Agents 9.89% 0.299
Coagulation Modifiers 1.01% 0.100
Gastrointestinal Agents 5.37% 0.225
Hormones/Hormone Modifiers 6.54% 0.247
Miscellaneous Agents 0.99% 0.099
Genitourinary Tract Agents 0.54% 0.073
Nutritional Products 1.11% 0.105
Respiratory Agents 8.99% 0.286
Topical Agents 8.11% 0.273
Psychotherapeutic Agents 6.50% 0.246
Metabolic Agents 13.11% 0.337
Year = 2007 23.55% 0.424
Year = 2008 18.98% 0.392
Year = 2009 19.49% 0.396
Year = 2010 19.09% 0.393
Year = 2011 18.88% 0.391
Observations 231,237
Table 3: Frequency of Off-Label Status, by Multum Drug Class
Off-Label Percent Prescriptions Number of in Category
Percent of Sample
Cardiovascular Agents 28.14% 49,770 21.52%
Anti-Infectives 40.51% 35,661 15.42%
Metabolic Agents 13.40% 31,582 13.66%
Central Nervous System Agents 50.99% 22,686 9.81%
Respiratory Agents 27.70% 22,152 9.58%
Topical Agents 42.77% 18,313 7.92%
Psychotherapeutic Agents 41.95% 14,383 6.22%
Hormones/Hormone Modifiers 48.34% 13,876 6.00%
Gastrointestinal Agents 40.39% 12,611 5.45%
Nutritional Products 37.99% 2,640 1.14%
Coagulation Modifiers 70.93% 2,136 0.92%
Miscellaneous Agents 40.70% 2,108 0.91%
Other Drug Class 39.87% 2,097 0.91%
Genitourinary Tract Agents 58.68% 1181 0.51%
Biologicals 73.17% 41 0.02%
Totals 231,237 99.99%
Weighted Average 34.93%
Table 4: Frequency of Off-Label Status for the 25 Most-Prescribed Drugs
Off-Label
Percent Prescriptions Number of Percent of Sample
Amoxicillin 17.32% 9053 3.92%
Azithromycin 47.81% 8593 3.72%
Lisinopril 22.01% 6138 2.65%
Albuterol 26.66% 6025 2.61%
Simvastatin 16.01% 5684 2.46%
Metoprolol 29.98% 4944 2.14%
Levothyroxine 55.12% 4434 1.92%
Metformin 7.37% 4329 1.87%
Hydrochlorothiazide 7.21% 3896 1.68%
Omeprazole 28.18% 3556 1.54%
Prednisone 38.76% 3367 1.46%
Atorvastatin 3.37% 3120 1.35%
Amlodipine Besylate 13.21% 3095 1.34%
Furosemide 41.68% 2973 1.29%
Atenolol 20.13% 2816 1.22%
Montelukast 16.33% 2419 1.05%
Cephalexin 67.72% 2209 0.96%
Ciprofloxacin 37.28% 2020 0.87%
Gabapentin 76.20% 1937 0.84%
Insulin 3.09% 1846 0.80%
Esomeprazole 28.90% 1841 0.80%
Sertraline 20.63% 1784 0.77%
Alprazolam 34.16% 1780 0.77%
Clavulanate Potassium 29.10% 1739 0.75%
Potassium 30.62% 1698 0.73%
Totals 91,296 39.48%
Table 5: Models for Probability of Off-Label Prescription
(1) (2)
LPM Coefficients Logit Marginal Effects
Number of on-label options for all listed diagnoses -0.004*** -0.004*** (-110.21) (-132.19)
Public insurance 0.007 0.007
(1.45) (1.48)
Private insurance -0.008* -0.006
(-1.68) (-1.23)
Aged 10 to 19 years -0.007 -0.007
(-0.93) (-1.02)
Aged 20 to 29 years 0.049*** 0.045***
(5.21) (5.00)
Aged 30 to 39 years 0.065*** 0.058***
(6.73) (6.39)
Aged 40 to 49 years 0.070*** 0.061***
(7.16) (6.48)
Aged 50 to 59 years 0.074*** 0.065***
(7.82) (7.11)
Aged 60 to 69 years 0.082*** 0.073***
(8.82) (7.86)
Aged 70 to 79 years 0.090*** 0.080***
(9.13) (8.34)
Aged 80 years and up 0.114*** 0.102***
(10.89) (9.96)
Hispanic 0.040*** 0.039***
(7.21) (7.22)
African-American 0.024*** 0.024***
(6.64) (6.47)
Asian 0.033*** 0.035***
(4.84) (5.25)
Mid-West Census region -0.002 -0.001
(-0.37) (-0.30)
South Census region 0.015*** 0.015***
(3.30) (3.16)
West Census region 0.009* 0.008*
(1.85) (1.77)
(-9.97) (-9.35)
Self-assessed very good health -0.047*** -0.044***
(-7.99) (-7.76)
Self-assessed good health -0.029*** -0.028***
(-5.45) (-5.45)
Self-assessed fair health -0.014** -0.012**
(-2.34) (-2.27)
High school education -0.006 -0.006
(-1.43) (-1.56)
Some college -0.016*** -0.015***
(-3.33) (-3.43)
College graduate -0.007 -0.006
(-1.20) (-1.06)
Graduate school education -0.020*** -0.019***
(-3.01) (-2.86)
Family income in first quartile 0.000 0.000
(0.01) (0.08)
Family income in second quartile 0.002 0.002
(0.49) (0.54)
Family income in third quartile -0.004 -0.004
(-1.19) (-1.07)
Male 0.023*** 0.019***
(9.53) (8.07)
Married or cohabitating 0.004 0.005
(0.79) (0.96)
Separated or divorced 0.001 0.000
(0.08) (0.03)
Widowed 0.000 0.001
(0.02) (0.20)
Employed -0.002 -0.001
(-0.40) (-0.23)
One ER visit in year 0.009** 0.008**
(2.38) (2.27)
Two or more ER visits in year 0.008 0.006
(1.55) (1.12)
One inpatient admission in year 0.013*** 0.012***
(2.87) (2.86)
Two or more inpatient admissions in year 0.018*** 0.017***
(2.78) (2.76)
(2.27) (2.38)
Six to twelve doctor visits in year 0.006* 0.006
(1.67) (1.55)
More than thirteen doctor visits in year 0.017*** 0.016***
-4.09 (3.84)
Drug Category Fixed Effects
Yes Yes
Year Fixed Effects
Yes Yes
Number of Observations 231,237 231,237
* p<0.10, ** p<0.05, *** p<0.01
Table 6: Conditional Logit Estimates for Clinical Support Effects
(1)
Logit Marginal Effects
On-label Indicator 0.220***
(150.21)
Off-label Support: RCT count 0.041***
(35.04)
Off-label Support: Effective 0.025***
(19.36)
Off-label Support: ADRS -0.013
(-1.19)
Off-label Support: Risky -0.025
(-0.37)
Off-label Support: Published Papers 0.184*
(1.74)
Off-label Support: Guidelines 0.020***
(17.83) Year Fixed Effects
Yes
Number of Observations 231,237
* p<0.10, ** p<0.05, *** p<0.01
Bibliography
Bradford, David, John L. Turner, and Jonathan W. Williams. "Off-Label Use of Pharmaceuticals: Trends and Drivers." SSRN Electronic Journal (2014): Web.
Shapiro, Bradley. "Informational Shocks and the Effects of Physician Detailing." SSRN
Electronic Journal SSRN Journal (2016): Web.
"Off-Label Pharmaceutical Marketing: How to Recognize and Report It." Centers for Medicaid and Medicaid Services. October 2015. Accessed December 2, 2016.
David, Guy, Sara Markowitz, and Seth Richards-Shubik. "The Effects of Pharmaceutical
Marketing and Promotion on Adverse Drug Events and Regulation." American Economic Review
2.4 (2010): 1-25. Working Papers & Publications. The National Bureau of Economic Research, Jan. 2009. Web. 11 Oct. 2016.
Peeples-Dyer, Veleka, Vernessa T. Pollard, and Anisa Mohanty. "FDA Announces Public Hearing on Off-Label Communications; Registration Deadline October 19, 2016." The National
Law Review. The National Law Review, 20 Sept. 2016. Web. 8 Oct. 2016.
Greene, William. "Going Beyond Simple Discrete Choice." Handbook of Choice Modelling 2, no. 4 (2008). Accessed December 5, 2016. doi:10.4337/9781781003152.00022.