ISSN: 2278-3369
International Journal of Advances in Management and Economics Available online at: www.managementjournal.info
RESEARCH ARTICLE
Efficiency and Total Factor Productivity of Public Hospitals in
Haryana (India): A Data Envelopment Analysis
Singh Surat
1, Singh Dalbir
2* Singh Kamlesh
31Professor, University School of Business, Chandigarh University Mohali, Punjab, India
2Assistant Professor, Department of Economics, M.L.N. College Yamuna Nagar, Haryana, India 3Associate Professor, S.D. College Ambala Cantonment, Haryana, India
*Corresponding Author: Email: [email protected]
Abstract
The present study endeavors to analyze the efficiency and total factor productivity of public hospitals in the state of Haryana, one of the leading states of India, using Data Envelopment Analysis. The input variables identified for the study are doctors and support staff (including nurses, lab technicians and pharmacists) for measuring efficiency and total factor productivity. Similarly, inpatients and outpatients have been taken as outputs. Twenty hospitals have been chosen for the study. The study is based on primary and secondary data collected from officials and record maintained by public hospitals. Data Envelopment Analysis (DEA) is used to evaluate efficiency, allocative efficiency and total factor productivity (TFP) change making use of DEAP software. 90% hospitals have been observed to be technically inefficient having a mean TE score of 32%. Overall average TE score is 0.39 which implies that the public hospitals in Haryana may reduce the consumption of inputs by 61% without reducing the outputs. 90% hospitals have been observed to be scale inefficient having a mean SE score of 39%. Overall average scale efficiency has been observed 0.44. 60% hospitals make efficient use of input related to doctors whereas 35% hospitals have been efficient in using support staff efficiently. 60% hospitals were found working efficiently regarding inpatients. 85% hospitals were found working efficiently regarding outpatients. 15% hospitals were found to be allocatively efficient. The score of TFPCH (1.094) indicates that out of 9.4% growth, 5.9% is by TECHCH (1.059) and 3.3% by EFFCH (1.033). It is suggested by the study that on an average, scale inefficiency has been due to the increasing returns to scale. The estimate of total elasticity also suggests the operation of increasing returns to scale in public hospitals of Haryana State.
Keywords: Public Hospitals, DEA, Efficiency, TFP, Haryana, India.
Introduction
India has faced many serious challenges in healthcare sector over the years. There are various factors such as the ageing population, the increased personal use of health care and medical advances that have opened the way for more treatment options and diagnostics.
All these factors have contributed to a rise in the demand for health care. The country has created vast public infrastructure of Sub Centers (SCs), Primary Health Centers (PHCs) and Community Health Centers (CHCs).
There is also large cadre of health care providers (ANMs, male health workers, lady health visitors and health assistants male etc.).
Health Infrastructure in Haryana
At that time state economy was predominantly rural and agricultural based. In 1969-70, the contribution of agriculture and allied sector in the GSDP at constant prices was 60.7 % followed by service (21.7%) and industrial (17.6%) sectors. Thereafter, the major drive towards diversification and modernization of state economy started and continued successfully in the following years. As a result, the share of agriculture and allied sector in GSDP declined to 14.1% while the shares of industrial sector and service sector increased to 27% and 58.9% respectively in 2014-15 [1].
The Health Department of Haryana has been constantly upgrading itself in terms of infrastructure, human resource, equipment, drugs etc. State’s Health Department is responding to the health needs of all categories of its populace including infants, children, adolescents, mothers, eligible couples, the elderly in addition to the sick and trauma victims.
The health services in the state are being provided to the people through a well-connected network of Government Hospitals, Community Health Centres, Primary Health Centres, Sub Centres, District Tuberculosis Centres, Dispensaries, Mobile units and Mobile Dental Dispensaries and Urban Health Posts. In addition, there is a Post-Graduate Institute of Medical Education and Research Centre at Rohtak with a capacity of 1276 beds and specialties services which also provides Medical Training at the Graduate and Post-Graduate level. There is another Medical College at Agroha, Hissar. Thus the state has made tremendous progress in the augmentation of health and medical services [1].
An amount of Rs. 9599.59 crore (55.70 %) was kept for social services sector in the revised outlay of the state’s Annual Plan 2013-14. Out of this allocation, an amount of Rs. 2876.83 crore (16.7 %) was kept for Education and Technical Education and Rs.927.35 crore (5.38%) for Health Services, Medical Education etc. State is focusing on improving the child health services and Child Sex Ratio (CSR). For this, various initiatives have been taken. Beti Bachao Beti Padhao (BBBP) Programme is one of them that has been launched by Honorable Prime
Minister of India on 22nd January, 2015 in district Panipat[1].
Thus, increased pressures on health care resources have led policy makers, administrators to search for more efficient ways to deliver health services. The evaluation of relative efficiency of health facilities can guide decision makers in ensuring the optimum utilization of the available resources and this evaluation can be done using two classes of methodologies: stochastic parametric regression-based methods and non-stochastic nonparametric mathematical programming methods.
Data envelopment analysis (DEA) is the most used family of linear programming models. The present study is based on DEA technique to analyze the efficiency, allocative efficiency and total factor productivity growth (TFPG) change in public hospitals in the state of Haryana, the detail of which is given in methodology section.
Many research scholars have used data envelopment analysis (DEA) to analyze the efficiency in wide range of organizations including hospitals, schools, agriculture, ports, pharmaceutical industry, railway, research laboratory etc. However, the usage of DEA in the hospital sector has been recent phenomena.
The review of previous studies reveals the fact that most of the studies have used DEA to evaluate one or the other economic aspect at a time–efficiency, allocative efficiency or total factor productivity (TFP) change [2-8].
The present study is a humble attempt to use DEA to evaluate all the economic aspects– efficiency, allocative efficiency and total factor productivity (TFP) change simultaneously. The objectives of the study are; to evaluate the efficiency, allocative efficiency and total factor productivity growth (TFPG) changes over the period of time of public hospitals.
Research Methodology
in Haryana, the output elasticities and data and variables.
Measurement of Efficiency
To examine the efficiency level of public hospitals in Haryana the data envelopment analysis has been used. The DEA was pioneered by Farrell [9]. It was introduced by Charnes et al. [10] and was formulated by Banker et al. [11]. DEA is a non-parametric mathematical programming approach to estimate the efficient frontier for a group of decision making units (DMUs) with multiple inputs and outputs.
This technique can separate the efficient operating units i.e., firms, organizations, managers etc. form inefficient units on the basis of whether they lie on the efficient frontier or not. Data envelopment analysis (DEA) can also be used to decompose the technical efficiency into pure technical efficiency (PTE) and scale efficiency (SE). The DEA model employed is an input-oriented model which identifies technical efficiency as a proportional reduction in inputs. In order to evaluate the overall efficiency of the public hospitals in Haryana, we apply two DEA models, namely, (i)
Charnes, Cooper and Rhodes (CCR) model and (ii) Banker, Charnes and Cooper (BCC) model. The study uses slack variable analysis to carry out a more detailed investigation. A brief view of these modes is in order.
The CCR Model (Constant Returns to Scale)
The CCR DEA model assumes constant returns to scale (CRS) in its production possibility set. The DEA model involves optimizing a scoring function (H), defined by the ratio of all outputs over all inputs subject to the constraints that the similar ratios for every DMU be less than or equal to one, implying that efficient DMUs will have a score of one. In other words, the best way to introduce DEA is via the ratio form. For each DMU we have to obtain a measure of the ratio of the weighted sum of all outputs and the weighted sum of all inputs, such as
i i
u' y / v'x , where u is m*1 vector of output weights and v is a k*1 vector of input weights. In order to select optimal weights, we specify the mathematical programming problem:
i x /v' i y u' v
u, H
Max
Subject to 𝒖’ yj / 𝒗’xj ≤ 1 … (1) And u,v ≥ 0
Where m: outputs, k: inputs, N: DMUs and i stands for ith DMU
This involves finding values of u and v, such that the efficiency measure of the ith DMU is
maximized subject to the constraint that all efficiency measures must be less than or equal to one. Obviously, the optimal value of equation (1) must not exceed unity. If the optimal value of equation (1) is equal to unity, then a particular DMU is located on
the CRS frontier, and a score of less than unity implies that it is inefficient. One problem with this particular ratio formulation is that, it is difficult to solve because it has an infinite number of solutions. Following the Charnes et al. [10] transformation, this leads us to the following equivalent linear programming model:
iu, v
Max H u' y
Subject to 𝒗′xi = 1 ... (2)
𝒖′yj- 𝒗′xj ≤ 0 , j = 1, 2,...N And u, v ≥ 0
This form is known as multiplier form of the linear programming problem. The dual of the above multiplier form is called envelopment form, which is easier to solve
θ, λ
crs
TE
= Min θ
Subject to -yi + Yλ ≥ 0
θ xi – X λ ≥ 0 ...(3)
And λ ≥ 0
Where λ is an N*1 vector of constants, Y and X, are m*1 and k*1 vectors of outputs and inputs respectively and θ is a scalar. The value of θ obtained will be the efficiency score for the ith DMU. It will satisfy θ ≤ 1,
with a value of 1 indicating a point on the frontier and hence a technically efficient DMU.
The BCC Model (Variable Returns to Scale)
The Charnes, Cooper and Rhodes (CCR) model as has been described above is
appropriate only when all DMUs are operating at an optimal scale. However, imperfect competition, government control, financial constraints etc. may cause a DMU not to be operating at optimal scale. Banker et al. [11] modified the CCR model to account for technologies that exhibit variable returns to scale (VRS). In other words, the CRS linear programming problem can easily be extended to account for VRS by adding the convexity constraint: N 1' λ to
equation (3) to provide:
θ, λ
vrs
TE
Min θ
Subject to -yi + Yλ ≥ 0
θ xi – X λ ≥ 0 ...(4)
And N 1' λ≥ 0
Where N1 is an N*1 vector of ones
The CCR technical efficiency score can be decomposed into two components namely, (i) Scale efficiency, and (ii) Pure technical efficiency. If there is a difference between the CCR and BCC technical efficiency scores for a particular DMU, then this indicates that the particular DMU has scale inefficiency. Since the CCR efficiency score is a product of scale efficiency and pure technical efficiency, therefore, the scale efficiency score can be obtained by dividing the technical efficiency score resulting from the CCR model by the efficiency score resulting from the BCC model (Technical efficiency=Scale efficiency*Pure technical efficiency). These efficiency scores are bounded between zero and unity.
Following Pascoe et al. and Singh [12, 13], the analysis has been undertaken by making use of DEAP programme [14]. Technical efficiency obtained by using CRS model is decomposed into Pure Technical Efficiency (PTE) and Scale Efficiency (SE) by applying both CRS and VRS DEA on the same data. The scale efficiency score is worked out by dividing the CRS score by the VRS score.
The decomposition of technical efficiency into PTE and SE depicts the sources of inefficiency, i.e., whether it is caused by inefficient operation (PTE) or by disadvantageous conditions displayed by the scale efficiency (SE) or both [15].
Measurement of Allocative Efficiency Following Data Envelopment Analysis (DEA), cost minimization is associated with three types of efficiency measures: cost efficiency, allocative efficiency and technical efficiency. In the present study, we have also used DEA approach to measure allocative efficiency of public hospitals in Haryana.
Allocative efficiency can be measured by using the cost minimization DEA model. The present study used a multi output and multi input-Constant Returns to Scale input oriented DEA model. Following Coelli et al., we considered N decision making units (DMUs). Each of the N DMUs produce m outputs using k inputs [16]. A cost minimization linear programming problem is solved for each DMU. The cost-minimization problem for the ith DMU is
*
* i
i ' i
Min W x
λ,x
Subject to
N* i qi qi i=1
λ Y - Y > 0
… (5)
N*
i qi qi
i=1
λ Y - Y > 0
1
i
N 1' λ
And i> 0
Where
Wi = vector of the unit price of inputs utilized by DMUi
xi* = vector of input quantities of DMUi with respect to production cost minimization.
Yqi = amount of output q produced by DMUi
xji*= amount of input j utilized by DMUi
N1 = an N*1 vector of ones. λi =dual variables.
In the framework of cost minimization, the total Cost-Efficiency (CE) or Economic Efficiency (EE) of the ith DMU is measured
by the ratio of minimum cost to observed cost as:
CE = ' i
W
x
*i/Wi' xi ... (6)A DMU is said to have realized allocative efficiency if it is operating with the optimal combination of inputs, given their respective prices. The allocative efficiency is calculated
residually by using the following relationship between Cost Efficiency (CE) and Technical Efficiency (TE) as:
AE = CE/TE ... (7)
Where AE = Allocative Efficiency CE = Cost Efficiency TE = Technical Efficiency The following ranges of allocative efficiency (Laha and Kuri, 2011) [17] can be defined as: Efficient in allocating resources: AE=1 A small allocative inefficiency: 0.9≤AE<1
Moderate allocative inefficiency: 0.7≤AE<0.9 Inefficient in allocating resources: AE<0.7
... (8)
Measurement of Total Factor Productivity (TFP) Change [Malmquist Productivity Index]
The TFP is an index of outputs divided by an index of inputs and refers to the change in the productivity over time. The different approaches of TFP measurement are Growth Accounting (GA) approach, stochastic frontier analysis (SFA) and DEA based Malmquist Productivity Index [18]. The DEA has important advantages over GA and SFA approaches such as:
It does not require any functional form for the production function [18].
It compares the DMUs to the ‘best’ practice technology rather than ‘average’ practice technology as in the case of econometric approaches [19].
It does not require information on the input and output prices.
It does not require the profit maximization or cost minimization assumption.
TECHCH EFFCH
The MPI, which is an application of DEA to a panel data to calculate the indices of TFP change was initially introduced by Caves et al. (1982) [20] and was empirically used
later on by Fare et al. [21,22]. To avoid choosing the MPI of an arbitrary period Fare et al. [22] specified the Malmquist productivity change index as:
1
t t +1 2
t +1 t +1 t +1 t +1
o o
o t +1 t +1 t t t t +1
t t t t
o o
X , Y X , Y
m Y , X , Y , X = x ... (9) X , Y X , Y
d
d
d
d
This represents the productivity of the production point (Xt+1, Yt+1) relative to the
production point (Xt,Yt). This index is, in
fact, the geometric mean of two Malmquist TFP indices. One index uses period ‘t’
technology and the other uses period‘t+1’ technology. Fare et al. (1994) further state that the MPI formula in equation (9) can be equivalently rewritten as:
1
t +1 t t 2
t +1 t +1 t +1 t +1 t t
o o o
o t +1 t +1 t t t t +1 t +1
t t t +1 t +1 t t
o o o
X , Y X , Y X , Y
m Y , X , Y , X = X X ... (10) X , Y X , Y X , Y
d
d
d
d
d
d
The first ratio on the right hand side of equation (10) measures the changes in Technical Efficiency (EFFCH) between period ‘t’ and ‘t+1’ as a catching-up to the frontier effect. The second term measures
the change in production technology i.e. Technical change (TECHCH), usually referred to as a shift in production frontier. The TFP growth rate can be estimated as:
TFP (per cent) = (TFPCH-1)*100
Further, a value of m0 greater than unity will indicate positive TFP growth from period ‘t’ to period‘t+1’. More specifically, m0>1 reflects a positive TFP growth between two consecutive years. Similarly, improvements in any of the components of m0 are also associated with the values greater than unity of these components and deterioration is associated with the values less than unity. Also m0=1 reflects no change or no improvement.
Output Elasticities
It will be of great use to examine how the output will respond to a change in the level of inputs. This is analyzed by estimating the elasticities of outputs with respect to each input used. The elasticities of outputs (Y) of
government hospitals in Haryana with respect to two inputs namely doctors (X1)
and support staff (X2) are estimated by
applying Cobb-Douglas type of production function in the log-linear form as:
𝐘𝐢= 𝐀𝑿𝟏𝒊𝒃𝟏𝑿 𝟐𝒊 𝒃𝟐𝒆𝒖𝒊
The logarithmic specification of Cobb-Douglas type of production function is:
Log Yi = Log A+ b1 Log X1i +b2 Log X2i +ui Or
Log Yi = bo+ b1 Log X1i +b2 Log X2i +ui ... (11) [∵Log A=b0]
X2 =Support Staff
u = Stochastic disturbance term
b0, b1 and b2 = Parameters of the model and
b1 = elasticity of output with respect to doctors,
b2 = elasticity of output with respect to support staff.
Total elasticity (e) is estimated by adding elasticities of output of government hospitals in Haryana with respect to individual inputs. That is,
e = b1+b2 ...(12)
Data and Variables
The study is based on primary and secondary data collected from the official records of twenty government hospitals in Ambala district of Haryana state. We have taken two inputs- doctors and the number of support staff, which includes nurses, laboratory technicians, pharmacists etc. And two outputs namely outpatients and inpatients. The number of inpatients was computed by multiplying the average bed occupancy with 365. The bed availability could have also been taken as one of the inputs, but we confined our study to two inputs and two outputs case for the sake of simplicity.
Therefore, the study involves four variables- two inputs and two outputs on which the information for the year 2015 has been gathered from the records of government hospitals and information given by the officials. Then the data for the years 2013 and 2014 were also prepared on the basis of records available with the hospitals in Haryana and information given by officials. Data Envelopment Analysis (DEA) technique has been used to work out
efficiency, allocative efficiency and Total Factor Productivity (TFP) indices of government hospitals in Haryana. The efficiency and allocative efficiency results are based on mean data which has been obtained by averaging the three years data for 2013, 2014 and 2015. Since Malmquist Productivity Index (MPI) is based on Panel data, therefore, we used the data from 2013 to 2015 to compute total factor productivity (TFP) change index. Output elasticities with respect to individual inputs have also been worked out by using the Cobb- Douglas type of production function in log- linear form.
Results
Estimates of Technical and Scale Efficiencies
Technical efficiency means how efficiently a firm utilizes its inputs to produce a given level of output, whereas scale efficiency means to produce more by changing the size of operations with the same input mix. It is possible that a firm may be technically efficient but the scale of operation of the firm may not be optimal.
Table 1: Efficiency scores of government hospitals in Haryana
DMU CCR model (TE) BCC Model (PTE) Scale Efficiency (SE) Returns to scale
19 1.000 1.000 1.000 Crs 20 1.000 1.000 1.000 Crs
Mean 0.388 0.854 0.441 Irs
irs= Increasing returns to scale, drs= decreasing returns to scale, crs= constant returns to scale. Source: Authors’ calculation
Table 1 shows the technical efficiency scores obtained from both the CCR (Eq.3) and BCC (Eq.4) input-oriented models and scale efficiency scores for public hospitals in Haryana. A difference in CRS (CCR model) and VRS (BCC model) efficiency scores for a particular DMU indicates scale inefficiency.
A scale efficiency score having value unity demonstrates that a particular DMU is scale efficient and a value less than unity indicates that a particular DMU is scale inefficient. Table1 exhibits that two (10%) public hospitals have SE score of 100% implying thereby that they have the most productive scale size for a particular input-output mix. The remaining eighteen (90%) hospitals have been observed to be scale inefficient having a mean SE score of 39%. Overall average scale efficiency has been observed 0.44 for the sample units as a whole. Similarly two (10%) public hospitals have been observed to be technically efficient having TE score of 100% whereas the remaining eighteen (90%) hospitals have been observed to be technically inefficient having a mean TE score of 32%.
Average TE and PTE efficiency scores, the distance of a DMU from the best practice, are computed as 0.39 and 0.85, respectively. The average score of TE 0.39 means that the public hospitals in Haryana may possibly reduce the consumption of inputs by 61% {(1-TE)*100} without reducing the outputs. Comparing these three efficiencies, it is observed that in public hospitals in Haryana
aggregate efficiency has been contributed more by the efficient conversion of inputs than by the increase in size of plant, as PTE score (0.85) is much higher than the SE score (0.44). Table1 shows that out of 18 scale-inefficient hospitals, 17 (94%) hospitals depict IRS which implies that they are too small to operate at their most productive scale size. Therefore they need to expand their scale of operations. One (6%) hospital shows DRS, which implies that it needs to scale down its operations for achieving CRS. Analysis of Input-Slacks
Input slacks means to produce the same level of output with less input mix. In other words if a firm (DMU) can produce the same level of output with the less amount of inputs, this is called input slacks. In order to make a DMU efficient all input slacks have to be eliminated. This is shown in the following Table 2.
The government hospitals possessing value of technical efficiency score less than unity indicates inefficiency and observes slacks in the inputs. In order to identify the causes of inefficiency in government hospitals, input-slacks have been computed through DEA CCR model (eq.3).Table 2 contains the inputs actually used in government hospitals, estimated slacks and target inputs in them. To make a particular hospital efficient, all slacks in inputs have to be eliminated. An efficient hospital does not have any input slacks.
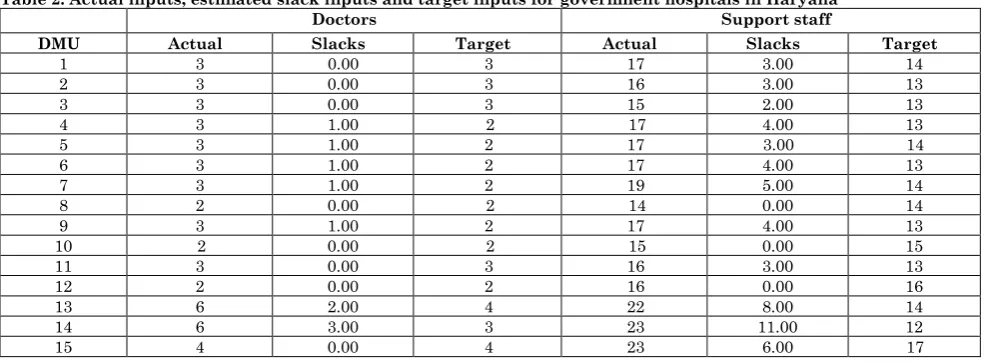
Table 2: Actual inputs, estimated slack inputs and target inputs for government hospitals in Haryana
Doctors Support staff
DMU Actual Slacks Target Actual Slacks Target
16 3 1.00 2 21 5.00 16 17 5 0.00 5 07 0.00 07 18 18 0.00 18 28 0.00 28 19 8 0.00 8 18 0.00 18 20 7 0.00 7 14 0.00 14 Source: Authors’ calculation
Table 2 reveals that the twelve (60%) hospitals out of twenty make efficient use of input related to doctors, while rest of eight (40%) hospitals are found to be inefficient in making efficient use of doctors. Similarly, only seven (35%) hospitals have been efficient in using support staff efficiently. Analysis of Output Slacks
Output slacks means to produce more output with the same inputs. In other words if a firm can produce more of an output with same input mix, this is called output slacks. And in order to make a firm (DMU) efficient
all output slacks have to be eliminated. This is shown in the following Table 3. On similar lines of input-slacks, we can discuss the efficiency of government hospitals on the basis of output-slacks. The government hospitals possessing value of technical efficiency score less than unity indicates inefficiency and observes slacks in the outputs. In order to identify the causes of inefficiency in government hospitals, output-slacks have been computed through DEA CCR model (eq.3).
Table 3: Actual output, estimated slack outputs and target outputs for government Hospitals in Haryana
Inpatient Outpatient
DMU Actual Slacks Target Actual Slacks Target
1 132 179 311 40800 0.00 40800 2 136 97 233 33600 0.00 33600 3 112 72 184 29200 0.00 29200 4 144 37 181 28600 0.00 28600 5 132 72 204 30800 0.00 30800 6 132 0.00 132 16880 6569 23449 7 156 55 211 31200 0.00 31200 8 108 0.00 108 21320 0.00 21320 9 160 0.00 160 18320 7104 25424 10 108 0.00 108 25360 0.00 25360 11 128 0.00 128 17020 6280 23300 12 140 0.00 140 28600 0.00 28600 13 268 669 937 100800 0.00 100800 14 268 0.00 268 35000 0.00 35000 15 420 931 1351 114000 0.00 114000 16 268 0.00 268 38400 0.00 38400 17 96 0.00 96 24400 0.00 24400 18 5560 0.00 5560 406400 0.00 406400 19 4160 0.00 4160 312000 0.00 312000 20 2640 0.00 2640 263600 0.00 263600 Source: Authors’ calculation
Table 3 contains the outputs actually produced in government hospitals, estimated slacks and target outputs in them. To make a particular hospital efficient, all slacks in outputs have to be eliminated. An efficient hospital does not have any output-slacks. Table 3 reveals that the twelve hospitals out of twenty do not have any output-slack regarding inpatients. In other words, twelve hospitals (60%) are working efficiently while rest of the eight hospitals (40%) are having output-slacks, meaning thereby these hospitals are having less number of inpatients which can be increased to make these hospitals efficient. Similarly, seventeen hospitals (85%) were
found working efficiently regarding outpatients and only three (15%) hospitals out of twenty were found inefficient, meaning thereby the number of outpatients can be increased to make these hospitals efficient.
The average allocative efficiency for the sample of all hospitals is 78%. Allocative efficiency may be computed as:
AE = CE/TE Where
AE = Allocative efficiency
CE = Cost efficiency / economic efficiency
TE = Technical efficiency
As is obvious from Table 4, only three hospitals were found to be allocatively efficient, because their allocative efficiency is unity.
Table 4: Allocative Efficiency of Government hospitals in Haryana
DMU TE AE CE
1 0.817 0.749 0.611 2 0.837 0.764 0.639 3 0.865 0.783 0.677 4 0.792 0.744 0.589 5 0.796 0.744 0.593 6 0.782 0.750 0.587 7 0.736 0.711 0.524 8 1.000 0.688 0.688 9 0.788 0.751 0.592 10 1.000 0.635 0.635 11 0.816 0.769 0.627 12 1.000 0.595 0.595 13 0.625 0.898 0.561 14 0.524 0.876 0.459 15 0.952 0.580 0.552 16 0.744 0.646 0.481 17 1.000 0.860 0.860 18 1.000 1.000 1.000 19 1.000 1.000 1.000 20 1.000 1.000 1.000
Mean 0.854 0.777 0.664
Source: Authors’ calculation
These hospitals are efficient in allocating their resources. The other three hospitals are little inefficient in the allocation of their resources, because the allocative efficiency of these hospitals lies between 0.9 and 1. About 55% government hospitals (11) are moderately efficient in allocating their resources, because their allocative efficiency scores lay between 0.7 and 0.9.
Lastly, the other three hospitals are found to be inefficient in allocating their resources, because their allocative efficiency is less than 0.7. Since cost efficiency (CE) is a product of technical efficiency (TE) and allocative efficiency (AE) [i.e. CE=TE*AE], it has been observed that technical efficiency has the major contribution in cost-efficiency,
because the technical efficiency score is much higher than the allocative efficiency score.
Measurement of Total Factor Productivity (TFP) Change
Table 5 depicts the inter-hospital variation in TFP growth in Haryana. Total factor productivity change has been estimated by using multi-input and multi-output constant returns to scale Input-Oriented DEA model (eq.10). A value of TFPCH greater than unity will indicate positive TFP growth from period‘t’ to ‘t+1’. The value of TFPCH equal to unity shows no change from period ‘t’ to period ‘t+1’ and the value of TFPCH less than unity indicates the deterioration of TFP growth from period ‘t’ to period ‘t+1’.
Table 5: Total factor productivity Growth of government hospitals in Haryana
DMU EFFCH TECHCH PECH SECH TFPCH
12 1.029 1.059 1.000 1.029 1.090 13 1.061 1.059 1.017 1.043 1.124 14 1.020 1.059 1.001 1.018 1.080 15 0.995 1.059 0.999 0.996 1.054 16 1.005 1.059 0.997 1.008 1.065 17 1.040 1.035 1.000 1.040 1.076 18 0.974 1.083 1.000 0.974 1.054 19 1.000 1.074 1.000 1.000 1.074 20 1.000 1.045 1.000 1.000 1.045
Mean 1.033 1.059 1.001 1.032 1.094
Source: Authors’ calculation [Note that all Malmquist index averages are geometric means]
As is obvious from Table 5 the value of TFPCH in our sample of public hospitals in Haryana is greater than unity indicating positive TFP growth from period ‘t’ to period ‘t+1’. Comparing efficiency change (EFFCH) [which is a product of pure efficiency change (PECH) and scale efficiency change (SECH)] and technical change (TECHCH), it has been observed in public hospitals in Haryana that the major contribution for the growth of total factor productivity (TFP) is of technical change because the TECHCH score is much higher than the EFFCH score. That is the score of TFPCH (1.094) indicates that out of 9.4% growth, 5.9% is by TECHCH (1.059) and 3.3% by EFFCH (1.033).
Output Elasticities
The elasticities of outputs (inpatients and outpatients) with respect to each input used, namely doctors and support staff (eq.11) is estimated using Cobb-Douglas type of the production function in the log-linear form. The estimated model in log-linear form is:
LogIP=0.511+1.82 LogDOC+0.685 Log SS
SE = (0.691) (0.300) (0.492) t = 0.740 6.06 1.16 R2 = 0.74, F = 24.02
And
LogOP = 3.18+1.40 LogDOC +0.54 Log SS
SE = (0.576) (0.251) (0.492) t = 5.52 5.59 1.09 R2 = 0.71, F = 20.50
Where IP: inpatients, OP: outpatients, DOC: doctors, SS: support staff.
The value of R2 being 0.74 and 0.71
respectively in both the models suggests that our model fits the data well. The value of F-statistic being very high suggests that the independent variables jointly affect the dependent variable in both the models
significantly. Individually doctors play a significant role in both the models. The estimate of total elasticity in both the models (eq.12) suggests the operation of increasing returns to scale in government hospitals in Haryana.
Discussion
Technical and Scale Efficiencies
The present study shows that 90% hospitals have been observed to be technically inefficient having a mean TE score of 32%. Whereas 90% hospitals have been observed scale inefficient having a mean SE score of 39%. Overall average TE and SE scores have been observed 0.39 and 0.44 respectively for the sample units as a whole.
Tlotlego et al.[26] undertook DEA among 21 non-teaching hospitals in the Republic of Botswana over the period (2006 to 2008) and found that average PTE scores were 70.4%, 74.2% and 76.3% respectively. The average SE scores were 79.2% in 2006, 84.7% in 2007 and 78.9 % in 2008. Another similar study of 19 secondary public community hospitals in Eritrea conducted by Kirigia et al. [27] revealed that 42% hospitals were technically efficient and 58% were relatively inefficient with TE score of 83%. Whereas 68% hospitals were technically efficient and 32% were technically inefficient with PTE score of 90%. 42% hospitals were scale efficient and 58% scale inefficient with SE scores of 88%. Thus, the available evidences from above studies indicate that technical efficiency (TE) scores vary between 49% and 90% whereas scale efficiency (SE) scores vary between 79% and 91%.
Total Factor Productivity (TFP) Change
The present study depicts that overall mean TFPCH is 1.094 which indicates that out of 9.4% growth, 5.9% is by TECHCH (1.059) and 3.3% by EFFCH (1.033).
A similar study of emergency units of 15 hospitals in Montreal Canada for 1997-98 and 1998-99 conducted by Ouellete and Vierstraete [28] revealed that overall mean TFPCH was 0.92, EFFCH was 0.94 and TECH was 1.05. That is, 8% decrease in productivity was primarily attributed to a decrease in efficiency.
Another study conducted by Gannon [29] on samples of 6 regional, 8 general and 22 country hospitals in Ireland for the period 1995 to 1998 revealed that regional hospitals had TFPCH of 1.028, EFFCH of 0.994, and TECH of 1.034. The general hospitals had TFPCH equal to 1.012, EFFCH equal to 0.999 and TECH equal to 1.013 The country hospitals had TFPCH of 0.997, EFFCH of 1.005 and TECH of 0.992. Therefore, on average the productivity of both regional and general hospitals improved while that of county hospitals declined between 1995 and 1998. Dash [30] applied Malmquist DEA to study productivity of 29 district headquarters hospitals in India during the period 2002 to 2007and found TFPCH value of 1.2358, EFFCH of 1.15 and TECH of 1.07.
Therefore, the 23.6% hospital productivity growth was explained by a 15% improvement in efficiency combined with a 7% increase in innovation. Kirigia et al.[31] estimated the performance of 28 municipal hospitals in Angola using Malmquist DEA over the period (2000-2002) and found TFPCH value of 1.045, EFFCH value of 1.127 and TECH of 0.927. Tlotlego et al.[26] applied Malmquist DEA to Botswana district hospitals and found an average TFPCH score of 0.985, EFFCH of 1.031 and TECH of 0.955. That is, TFPCH decreased by 1.5% due to 3.1% increase in EFFCH and 4.5% decrease in TECH. Mogha et al. [25] showed in their study that Uttarakhand hospitals had a TFPCH value of 1.049, TECH of 1.026 and TECHCH of 1.022. That is, the 4.9% hospital productivity growth was explained by a 2.6% improvement in TECH combined with a 2.2% increase in TECHCH. Thus, some of the available studies show TFPCH lower than one while others show greater than one.
Conclusion
The present study made an attempt to assess efficiency, allocative efficiency and total factor productivity growth in public hospitals of Haryana state and measured technical and scale efficiency applying DEA models, viz. (i) Charnes, Cooper and Rhodes (CCR) model and (ii) Banker, Charnes and Cooper (BCC) model. The slack variable analysis has been undertaken for greater understanding of the factors involved in each element’s productivity or non-productivity. The average value of TE 0.39 means that the government hospitals in Haryana may possibly reduce the consumption of inputs by 61 percent without reducing the outputs. The comparison of three efficiencies reveals that in government hospitals in Haryana, aggregate efficiency has been contributed more by the efficient conversion of inputs than by the increase in size of plant, as PTE score (0.85) is much higher than the SE score (0.44). The analysis of input and output slacks indicates the inefficiency of public hospitals in Haryana.
An efficient hospital does not have any input and output slacks. 60% hospitals make efficient use of input related to doctors whereas 35% hospitals have been efficient in using support staff efficiently.
Similarly 60% hospitals were found working efficiently regarding inpatients. 85% hospitals were found working efficiently regarding outpatients. About 55% government hospitals have been found moderately efficient in allocating their resources. Since cost efficiency (CE) is a product of technical efficiency (TE) and allocative efficiency (AE), it has been observed that technical efficiency has the major contribution in cost efficiency, because the technical efficiency score is much higher than allocative efficiency score.
TFP change has been estimated by using multi-input and multi-output constant returns to scale input oriented DEA model.
A value of TFPCH greater than unity will indicate positive TFP growth from period ‘t’ to period‘t+1’. The value of TFPCH in our sample of public hospitals is greater than unity indicating positive TFP growth from period ‘t’ to period ‘t+1’.
Comparing efficiency change (EFFCH) and technical change (TECHCH) it has been observed in government hospitals in Haryana that the major contribution for the growth of total factor productivity (TFP) is of technical change because the TECHCH score (1.059) is much higher than the EFFCH score (1.033). That is, overall mean TFPCH is 1.094 which indicates that 9.4% growth is driven 5.9% by TECHCH (1.059) and 3.3% by EFFCH (1.033). This study reveals that on an average scale inefficiency has been due to increasing returns to scale. The estimate of total elasticity also suggests the operation of increasing returns to scale in public hospitals in Haryana state.
References
1. Department of Economic and Statistical Analysis. (2015) Economic survey of Haryana, Department of Economic and Statistical Analysis Haryana, 1094. http://web1.hry.nic.in/budget/Esurvey.pdf, Accessed 10 October, 2015.
2. Dash U, Vaishnavi S D, Muraleedharan V R and Acharya D (2007) Benchmarking the performance of public hospitals in Tamil Nadu: An Application of Data Envelopment Analysis, Journal of Health Management, 9 (1): 59-74.
3. Friesner D, Neufelder D, Raisor J and Khayum M (2005) Benchmarking patient improvement in physical therapy with data envelopment analysis, International Journal of Health Care Quality Assurance, 18(6): 441-457.
4. Hollingsworth B (2003) Non-parametric and parametric applications measuring efficiency in health care, Health Care Management Science, 6: 203-218.
5. Mancebon, M, Jand Mar-Molinero C (2000) Performance in primary schools, Journal of the Operational Research Society, 51: 843-854.
6. Ohlan R (2013) Efficiency and total factor productivity growth in Indian dairy sector, Quarterly Journal of International Agriculture, 52 (1): 51-77. http://ageconsearch.umn.edu/bitstream/155486/2/3_Ohlan .pdf, Accessed 22 June, 2015.
7. Ray S C (1997) Regional variation in productivity growth in Indian manufacturing: A non-parametric analysis, Journal of Quantitative Economics, 13: 73-94.
8. Sehgal S and Sharma S (2011) Total factor productivity of manufacturing sector in India: A Regional Analysis for the State of Haryana, Economic Journal of Development issues, vol. 13 & 14 No. 1-2: 97-118. www.nepjol.info/index.php/EJDI/article/download/7213/58 41, Accessed 22 June, 2015.
9. Farrell M J (1957) The measurement of productive efficiency, Journal of Royal Statistical Society, series A 120: 253-290.
10. Charnes A, Cooper W W, Rhodes E (1978) Measuring the efficiency of decision making units, European Journal of Operational Research, 2: 429-444. http://www.utdallas.edu/~ryoung/phdseminar/CCR1978.p df, Accessed 22 June, 2015.
11. Banker R D, Charnes A and Cooper WW (1984) Some models for estimating technical and scale inefficiencies in data envelopment analysis, Management Science, 30: 1078-1092.
http://down.cenet.org.cn/upfile/181/200681741326146.pdf, Accessed 22 June, 2015.
12. Pascoe S, Kirrely J E and Greboval D F (2003) Measuring and assessing capacity in Fisheries, Issues and Methods,
FAO Rome.
ftp://ftp.fao.org/docrep/fao/006/Y5027E/Y5027E00.pdf, Accessed 22 June, 2015.
13. Singh S P (2004) Post WTO era: impact on export prospects of livestock products, Occasional Paper 32. Department of Economic Analysis and Research, National Bank for Agriculture and Rural Development, Mumbai.
14. Coelli T J (1996) A Guide to DEAP Version 2.1: A Data Envelopment Analysis (Computer) Program, CEPA Working Paper 96/08, Department of Econometrics, University of New England, Australia. http://www.owlnet.rice.edu/~econ380/DEAP.PDF, Accessed 22 June, 2015.
15. Cooper W W, L M Seiford and K. Tone (2007) Data envelopment analysis, a comprehensive text with models, applications, references and DEA-solver software. 2nd edition. Springer, Norwell, USA.
16. Coelli T, Rao D S P, O’Donnell C J and Battese G E (2005) An introduction to efficiency and productivity analysis. 2nd edition. Springer. http://facweb.knowlton.ohiostate.edu/pviton/courses/crp39 4/coelli_Intro_effic.pdf, Accessed 22 June, 2015.
Agricultural Research, 6 (5): 377-388. http://scialert.net/abstract/?doi=ijar.2011.377.388,
doi: 10.3923/ijar.2011.377.388, Accessed 25 July, 2015.
18.Joshi R N and Singh S P (2010) Estimation of total factor productivity in the Indian garment industry, Journal of Fashion Marketing and Management, 14(1): 145-160.
19.Grosskopf S (1986) The role of the reference technology in measuring productive efficiency, The Economic Journal, 96: 499-513.
20.Caves D W, Christensen L R and Diewert W E (1982) The economic theory of index numbers and the measurement of input, output and productivity. Econometrica, 50: 1393-1414.http://www.aae.wisc.edu/aae741/Ref/Caves%20Econo metrica%201982.pdf, Accessed 22 June, 2015.
21.Fare, R. and Grosskopf, S. (1992), Malmquist indexes and Fisher ideal indexes, The Economic Journal, 102 (410): 158-160.
22.Fare R, Grosskopf S, Norris M and Zhang Z (1994) Productivity growth, technical progress and efficiency changes in industrialized countries, American Economic review, 84: 66-83. www.aae.wisc.edu/aae741/Ref/Fare%20AER%201994.pdf, Accessed 30 June, 2015.
23.Osei D, George M D, Almeida S, Kirigia J M, Mensah A O, Kainyu L H (2005) Technical efficiency of public district hospitals and health centres in Ghana: a pilot study, Cost Effectiveness and Resource Allocation, 3-9. http://www.resource-allocation.com/content/3/1/9,
Accessed 30 October, 2015.
24.Jat T R and Sebastian M S (2013) Technical efficiency of public district hospitals in Madhya Pradesh, India: a data envelopment analysis, Glob Health Action, 6: 21742. http://dx.doi.org/10.3402/gha.v6i0.21742, Accessed 30 July, 2015.
25.Mogha S K., Yadav S P and Singh S P (2014) Technical efficiency and productivity growth in public sector hospitals of Uttarakhand (India), International Journal of System Assurance Engineering and Management, ISSN
0975-6809.http://dx. doi 10.1007/s13198-014-0270-1, Accessed 20 October, 2015.
26. Tlotlego N, Nonvignon J, Sambo L G, Asbu E Z, Kirigia J M (2010) Assessment of productivity of hospitals in Botswana: A DEA application, International Archives of Medicine, 3-27. http://dx. doi: 10.1186/1755-7682-3-27, Accessed 30 October, 2015.
27. Kirigia J M and Asbu E Z (2013) Technical and scale efficiency of public community hospitals in Eritrea: an exploratory study, Health Economics Review, 3-6.http://www.healtheconomicsreview.com/content/3/1/6, Accessed 25 August, 2015.
28. Ouellete P, Vierstraete V (2004) Technological change and efficiency in the presence of quasi-fixed inputs: a DEA application to the hospital sector, European Journal of Operational Research, 154:755-763.
29. Gannon B (2008) Total factor productivity growth of hospitals in Ireland: a nonparametric approach, Applied Economics Letters, 15(2):131-135.
30. Dash U (2009) Evaluating the comparative performance of District Head Quarters Hospitals, 2002-07: a non-parametric Malmquist approach. Mumbai, India: Indra Gandhi Institute of Development Research (IGIDR).