Journal of Electrical Engineering,
Electronics, Control and Computer Science
JEEECCS, Volume 2, Issue 4, pages 33-38, 2016
Laboratory Investigation of Fault Location in
Transmission Lines
Saeed ROOSTAEE
Research Scholar, Department of Electrical Engineering, Faculty of Engg. & Tech., Jamia
Millia Islamia, New Delhi, India [email protected]
Mini Shaji THOMAS and Shabana MEHFUZ
Faculty of Department of Electrical Engineering, Faculty of Engg. & Tech., Jamia Millia Islamia,
New Delhi, India
Abstract – A fault analysis tool should be able to detect the fault event by automatically interpreting recorded transients captured during relay trip operation and then estimate the fault location in the transmission line. Many methods and techniques have been introduced on fault location in transmission line. However, few of them focused on experimental results. This paper reviews some techniques which are used in today's modern protection relays and fault analysis software. Thereafter, to test and compare the techniques with experimental results, a fault location laboratory setup has been proposed and developed in substation automation laboratory of Jamia Millia Islamia University. In this setup, several types of fault in different location of a transmission line are simulated in PSCAD software, a secondary test kit is utilized to inject the associated three Phase voltage and current signals of the faults to a protection relay. The recorded fault events are loaded from the relay and analyzed with transient analysis software
Keywords: Fault Location; Transmission Line Fault Location; SEL-421; CMC 256
I. INTRODUCTION
Transmission Lines are exposed to faults as a result of lightning, short circuits, faulty equipment, mal-operation, human errors, overload, growing vegetation, aging, swaying trees, etc. When a fault occurs on a Transmission Line, it is very important to detect and isolate the faulty part as soon as possible. Protective relays detect and isolate the faults in transmission lines. Based on the recorded event, fault analysis tools find its location in order to take necessary remedial actions and restore power system. Most of these tools use voltage and current of the both end of transmission line. Based on these values, many methods and techniques were suggested to estimate the location of faults in transmission line. Following are some of them:
Voltage and current measurements of two ends [1]
Single end data during auto-reclose operation [2]
Single end travelling wave (wavelet) [3] Double end unsynchronized data [4-10] Double end synchronized data[11-17] Single end and un-transposed line [18] A considerable amount of literature has been published and proposed different method of estimation
of fault location in transmission line. However, far too little attention has been paid to experimental results. The purpose of this paper is to review recent research into the fault location and propose a lab setup structure to evaluate the fault location algorithm.
The overall structure of the study takes the form of seven sections, including this introductory section. Sections II, III, and IV reviews impedance, Phasor Measurement Unit (PMU), and travelling wave based fault location respectively. Section V presents a developed laboratory for fault location analysis. Section VI analysis the results of fault location for specific fault, also the other effective factor in fault location. Finally, the conclusion gives a brief summary of the findings.
II. MEASUREMENT TECHNIQUES
A. One terminal data methods
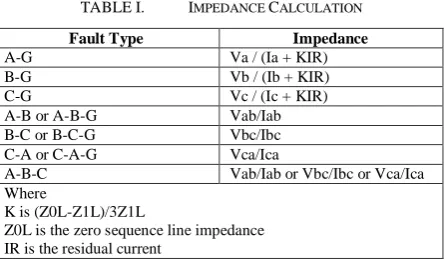
One end impedance fault locators calculate the location of a fault based on the impedance from one end of transmission line. In this technique, the ground phase voltage and current is needed. With assumption of the resistance of the fault is zero, we can estimate the location of faults for different type of fault in TABLE I.
TABLE I. IMPEDANCE CALCULATION
Fault Type Impedance
A-G Va / (Ia + KIR)
B-G Vb / (Ib + KIR)
C-G Vc / (Ic + KIR)
A-B or A-B-G Vab/Iab
B-C or B-C-G Vbc/Ibc
C-A or C-A-G Vca/Ica
A-B-C Vab/Iab or Vbc/Ibc or Vca/Ica
Where
K is (Z0L-Z1L)/3Z1L
Z0L is the zero sequence line impedance IR is the residual current
This technique is not very accurate because there are many factors which are not represented in this equation.
Zero sequence mutual effects
Uncertainty of parameter in transmission line
Accuracy of transmission line model Multi terminal lines
measurements errors
sampling rate of the equipment
B. Two terminal data methods
In this technique, the data must be collected and synchronized from the both ends of a transmission line. To implement this technique, microprocessor relays, communication facility, and analysis software are the most requirements. Nowadays, with advantages of electronic and information technology, this method is much easier.
C. Phasor Measurement Unit (PMU)
Synchronized sampling is referenced by individual GPS (Global Positioning System) clock to have a time reference. The sampled data can be generated either by protection relay or disturbance recorders. It can be send or transfer in proper format like event report and COMTRADE (Common format for Transient Data Exchange for power systems) file.
In this technique, the acquisition rate of each PMU must be considered. The accuracy of fault location depends to the acquisition rate of the PMU. High accuracy achieve by more samples [12, 13].
D. Traveling wave techniques
The basic principal of this method is comparing the arrival time of a travelled waved on each point of a transmission line. Switching operation, faults in line, and lightning strikes are the most common of generating of travelling waves in transmission lines. This technique can be applying on the measured current or voltage signals.
Fault location based on travelling wave, calculates the accurate time of an arrived surge due to a fault. As the surge speed is same as light speed, comparing the arrived surge on each terminal of a line can find the location of fault. Using the standard time reference at the both sides is the first requirement in this technique. Therefore, communication system, accurate time stamping, appropriate current or voltage sensor and microprocessor protection relay are the most required.
The accuracy of this technique is depending on two factors. The first is error in wave detection. This error happens when the number of transient waveform increased. For example, many lightning strikes occur on transmission line. The second is the accuracy of GPS and time stamping system.
III. LAB SETUP
Fig 1 illustrates the lab setup for fault location. In this setup, we can simulate faults in transmission line in PSCAD (Power System Computer Aided Design), after that the transient data for the fault is sent to secondary test kit which is CMC 256-6 in out setup. The CMC can play the transient values and generate the real three phase’s voltage and current. These three phase signals are connected throughout wiring to protection relay which is the SEL-421 relay. Therefore, in this setup, several faults can be simulated
and the signals can be generated to provide real values for fault location.
Fig 1. Fault Location developed in a laboratory (Laboratory setup)
Various types of faults in different locations of a transmission line can be simulated via PSCAD (Fig 2). These faults generate transient data. Transient data can describe the voltage and current signals both before and after the fault. There is a component in PSCAD which can record the transient data in the COMTRADE format. This format is a standard format for recording transient data and it can load to different fault analysis tools.
Fig 2. Different location and type of fault is simulated in PSCAD
The CMC 256 is a test set which can generate arbitrary three phase signals. Many applications such as testing synchronizer function, protection functions can be done with this test set. One of the most interesting features of this test set is that it can play transient data. Trans View play is software which can load COMTRADE file and generate corresponding signals. The signals can be utilized by protection relays to test functions.
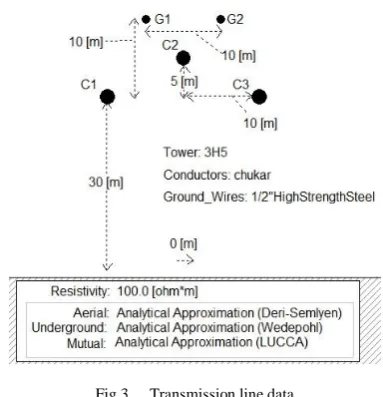
Fig 3. Transmission line data
An accurate fault location is depending on the accuracy of impedances estimations. There are many methods to determine line impedances. To have an accurate calculation, we apply mho component in PSCAD to calculate line impedance. The inputs of this component are voltage and current of one end of line. Based on these values, it can show the impedance in impedance plane.
int
ii ii
ik ik
R
R
R
R
R
/
km
(1)
0 int
0 int
2
.log
2
.log
2
i
ii ii
i ik
ik ik
ik
h
L
L
L
r
D
L
L
L
d
H/
km
(2)
00 1
2
1
.log
2
1
.log
2
i ii
i ik ik
ik
h
P
r
D
P
d
C
P
km/ F
(3)
Where µ0 is permeability of free space which is equal to 4π.10−4 H/km; ɛ0 is permittivity of free space which is equal to 8.8542.10−9 F/km; ri is radius of conductor i in meters; dik is distance between conductors i and k in meters; Dik is distance between conductor i and image of k in meters; hi is average height of conductor i above ground, in meters; Rint, Lint are internal resistance and inductance of conductor respectively; ΔRii, ΔRik are Carson R correction terms due to ground resistivity; ΔLii, ΔLik
are Carson L correction terms due to ground resistivity.
IV. TEST RESULTS AND DISCUSSION
This section presents testing of the fault location estimation algorithms. The testing of various fault scenarios is carried out by utilizing the hardware implementation in a laboratory environment. The transient data from the following fault is recorded for further analysis:
Fault Location: 75 km Fault type: AB-g (A-B-G) Fault Start: 0.22 s Fault duration: 0.15 s Fault Resistance: 0.001 Ohm
The OMICRON Trans View and the AcSELerator Analysis Assistant software are utilized to analysis fault location.
A. A. Fault Location in Omicron Trans-view software
The transient data for the fault which is mentioned in the first part of this section is simulated in OMICROM-Trans View software. Fig 4, screen capture of the software, shows an overview of the result of the fault.
Fig 4. Result in OMICRON-Trans view software
The results obtained from the preliminary analysis of the fault are summarized in TABLE II.
TABLE II. FAULTLOCATIONRESULT
Name OMICRON Trans view soft
Fault Type: Fault Location: Fault Current:
Fault Transition Resistance: Fault Location Procedure:
L1L2E
74.2 km distance to 'K1' 1.2 kA
11.5 Ohm
single-ended, measuring values of K1
Fault Type: Fault Location: Fault Current:
Fault Transition Resistance: Fault Location Procedure:
L1L2E
74.9 km distance to 'K1' 1.7 kA
2.4 Ohm
single-ended, measuring values of K2
Fault Type: Fault Location: Fault Current:
Fault Location Procedure:
L1L2E
75.3 km distance to 'K1' 3.3 kA
B. Fault Location with AcSELerator Analysis Assistant software
Three phase voltage and current signals of the fault, which is mentioned in the first part of section IV, are generated by CMC 256-6. These signals are connected to the SEL-421 relay. The SEL-421 is a transmission line relay and it has five zones of phase and ground. This relay has online fault location and after a trip, the estimation of fault location is recorded as an event report. The setting of this relay is important in fault location algorithm. Based on the data of the transmission line (Fig 3), following settings have been set in the relay:
Frequency: 60 Hz Line Length: 100
Positive Impedance Magnitude: 51.5 Positive Impedance Angle: 84.9 Zero Impedance: 146.93 Zero Impedance Angle: 72.2
After injection of transient data to the relay by CMC 256, the relay issues a trip signal. The relay detects an AB-g fault in zone one (Fig 5).
Fig 5. SEL-421 HMI
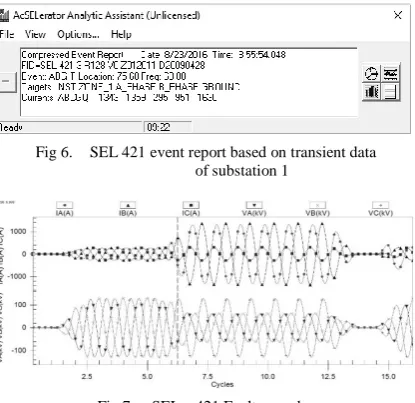
Fig 6 shows a screen capture of event report data from the fault based on transient data of substation 1. As can be seen form the report, an AB-g (ABG) fault happened in 75.68 km far from the relay in substation 1. Also, the voltage and current values can be seen from the event recorder. Fig 7 presents data of the fault form the event recorder in substation 1.
Fig 6. SEL 421 event report based on transient data of substation 1
Fig 7. SEL – 421 Fault recorder
With repetition of process based on the transient data from substation 2, an AB-g fault in 24.86 km is detected. Fig 8 shows a screen capture of event report data from the fault based on transient data of substation 2.
Fig 8. SEL 421 event report based on transient data of substation 2
TABLE III. compares the result obtained from the fault location of two methods. The top half of the table shows the accuracy of fault location with the Trans View software. And the bottom half of the table shows the accuracy of fault location with the AcSELerator Analysis software.
TABLE III. THE ACCURACY OF FAULT LOCATION
Type Error
(%) Sigle End (measuring value of substation 1)
Sigle End (measuring value of substation 2) Double End
0.8 0.1 0.7 Sigle End (measuring value of substation 1)
Sigle End (measuring value of substation 2
0.68 0.14
As can be seen from the table above, each of the software is very accurate. The maximum and minimum errors of the fault are 70 and 10 meter respectively.
Several faults with known fault location are simulated. The results obtained from the fault location with Trans View software can be compared in TABLE IV.
TABLE IV. ACCURACY FOR DIFFERENT LOCATION OF FAULT
Location Type Error
(%) 0 km to
S1
Sigle End (measuring value of substation 1) Sigle End (measuring value of substation 2) Double End
0 1.1 0 25 km to
S1
Sigle End (measuring value of substation 1) Sigle End (measuring value of substation 2) Double End
0.4 0.6 0.1 50 km to
S1
Sigle End (measuring value of substation 1) Sigle End (measuring value of substation 2) Double End
0.7 0.3 0.2 75 km to
S1
Sigle End (measuring value of substation 1) Sigle End (measuring value of substation 2) Double End
0.2 0.1 0.3 100 km
to S1
Sigle End (measuring value of substation 1) Sigle End (measuring value of substation 2) Double End
0.9 - 0
TABLE V. AB-G FAULT (DURATION 0.15) ABG Fault 0 ohm 5 ohm 10 ohm 15 ohm 20 ohm 30 ohm 40 ohm 50 ohm 0 km 1.1
0 0 5.8 1.2 0 11.1 2.5 0.1 16.1 3.9 0.1 20.7 5.5 0.2 29.3 9 0.2 37.1 13.3 0.4 58.6 18.3 15.8 25 km 24.4 24.6 25.1 29.3 26.6 25 33.2 28.9 25.2 36.9 31.3 25.1 40.3 34 25.2 46.9 40.1 25.2 53 47.5 25.3 58.6 100 37.5 50 km 49.7 49.3 50.2 53.2 52.6 50.2 56.1 56.1 50.1 58.9 60 50.2 61.5 64.3 50.2 66.5 74.5 50.3 71.1 47.5 37.8 94 100 61.1 75 km 74.9 74.2 75.3 77.3 79.1 75.2 79.4 84.5 75.2 81.4 90.8 75.2 83.4 97.8 75.2 87.1 - 75.3 71.1 - 64.5 94 - 93.3 100 km - 99.1 100 88.1 109 100 76.2 118.5 100 64.4 - 100 53 - 100 30.8 - 100 9.9 - 84.6 9.9 - 100 Numbers are distance (km) to substation 1
First line : Single end estimation based on data of substation 2 Second line : Single end estimation based on data of substation 1 Third line : Double end estimation
- : Not complete successfully
TABLE VI. PHASE A TO GROUND FAULT
AG Fault 0 ohm 5 ohm 10 ohm 15 ohm 20 ohm 30 ohm 40 ohm 50 ohm
0 km -
0 0.1 - 0.1 0.1 - 0.3 0.2 - 0.4 0.2 - 0.5 0.1 - 1.1 10.6 - 1.1 9.1 - 1.5 0.4 25 km 27 24.1 25.1 - 24.4 21.2 27.5 24.5 25.2 27.7 24.6 25.2 27.9 24.7 25.2 - 24.9 17.6 - 48.6 39.2 - 1.5 10.2 50 km 51.5 48.2 50.3 51.4 48.7 50.3 51.5 48.7 50.3 51.4 48.7 50.3 51.1 71.7 61.2 51.4 24.9 51.4 75 48.6 63.4 - 48.6 39 75 km 75.9 72.3 75.3 75.7 72.8 75.3 75.3 72.6 75.3 75.5 72.2 75.3 75.3 71.7 75.2 51.4 71 62.5 75 - 85.9 74.8 48.6 63.3 100 km - - 100 - - 100 99.8 - 100 99.6 - 100 99.3 - 90 99.3 71 92.3 98.8 - 90.5 98.8 - 100 Numbers are distance (km) to substation 1
First line : Single end estimation based on data of substation 2 Second line : Single end estimation based on data of substation 1 Third line : Double end estimation
- : Not complete successfully
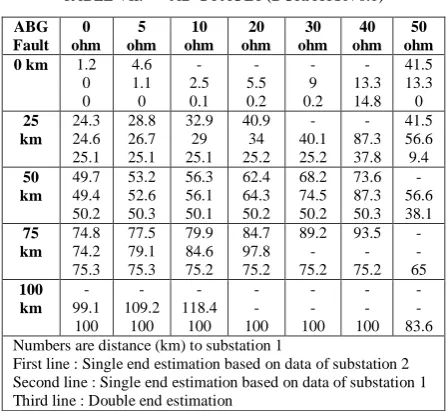
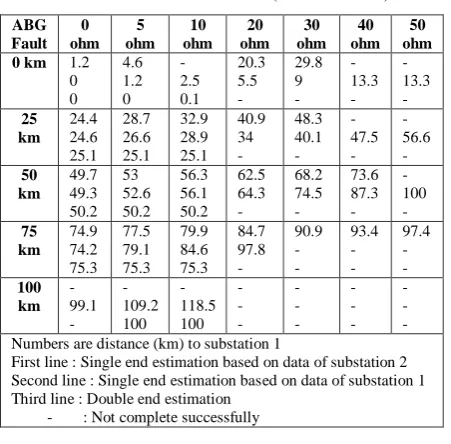
TABLE VII. AB-GFAULT(DURATION0.1)
ABG Fault 0 ohm 5 ohm 10 ohm 20 ohm 30 ohm 40 ohm 50 ohm 0 km 1.2
0 0 4.6 1.1 0 - 2.5 0.1 - 5.5 0.2 - 9 0.2 - 13.3 14.8 41.5 13.3 0 25 km 24.3 24.6 25.1 28.8 26.7 25.1 32.9 29 25.1 40.9 34 25.2 - 40.1 25.2 - 87.3 37.8 41.5 56.6 9.4 50 km 49.7 49.4 50.2 53.2 52.6 50.3 56.3 56.1 50.1 62.4 64.3 50.2 68.2 74.5 50.2 73.6 87.3 50.3 - 56.6 38.1 75 km 74.8 74.2 75.3 77.5 79.1 75.3 79.9 84.6 75.2 84.7 97.8 75.2 89.2 - 75.2 93.5 - 75.2 - - 65 100 km - 99.1 100 - 109.2 100 - 118.4 100 - - 100 - - 100 - - 100 - - 83.6 Numbers are distance (km) to substation 1
First line : Single end estimation based on data of substation 2 Second line : Single end estimation based on data of substation 1 Third line : Double end estimation
It is apparent from the two above tables that single end estimation is not accurate in high impedance
the effect of fault duration on fault location. The results obtained from Trans View software. TABLE VI. TABLE VII. provides the results obtained form an ABG fault with 0.1 s duration. 0presents and overview of fault location of an ABG fault with 0.2 s duration. What is interesting in this data is that fault time duration is not too effective in this method. The result of the bellow table shows that long fault duration is not successful is most of the cases.
TABLE VIII. AB-GFAULT(DURATION0.2)
ABG Fault
0 ohm
5 ohm
10 ohm
20 ohm
30 ohm
40 ohm
50 ohm 0 km 1.2
0 0
4.6 1.2 0
- 2.5 0.1
20.3 5.5 -
29.8 9 -
- 13.3 -
- 13.3 - 25
km 24.4 24.6 25.1
28.7 26.6 25.1
32.9 28.9 25.1
40.9 34 -
48.3 40.1 -
- 47.5 -
- 56.6 - 50
km 49.7 49.3 50.2
53 52.6 50.2
56.3 56.1 50.2
62.5 64.3 -
68.2 74.5 -
73.6 87.3 -
- 100 - 75
km 74.9 74.2 75.3
77.5 79.1 75.3
79.9 84.6 75.3
84.7 97.8 -
90.9 - -
93.4 - -
97.4 - - 100
km - 99.1 -
- 109.2 100
- 118.5 100
- - -
- - -
- - -
- - - Numbers are distance (km) to substation 1
First line : Single end estimation based on data of substation 2 Second line : Single end estimation based on data of substation 1 Third line : Double end estimation
- : Not complete successfully
V. CONCLUSION
There are many methods to estimate the location of faults in transmission line. This paper reviewed impedance based fault location, PMU based fault location, and transient wave based fault locations which are the most popular in today’s protection relay.
The advantages of synchronization, data acquisition, and communication systems have increased the interest of travelling wave methods to calculate the location of faults. Therefore, more research in this area is required.
A laboratory set up was developed to analysis the fault location. In the lab, a variety of fault can be simulated and the associated voltage and current signals can be generated for protection relays.To analysis fault location, this paper used the OMICRON Trans View and the AcSELerator Analysis Assistant software. It was shown; one end method is very accurate in low impedance faults. However, it is not accurate for high impedance faults where two end methods are more accurate.
VI. REFERENCES
[1] N. Kang, J. Chen, and Y. Liao, "A Fault-Location Algorithm for Series-Compensated Double-Circuit Transmission Lines Using the Distributed Parameter Line Model," Power Delivery, IEEE Transactions on, vol. 30, 2015.
[2] L. Ji, C. Booth, A. Dyśko, F. Kawano, and P. Beaumont, "Improved Fault Location Through Analysis of System Parameters During Autoreclose Operations on Transmission Lines," Power Delivery, IEEE Transactions on, vol. 29, 2014. [3] H. Livani and C. Y. Evrenosoglu, "A machine learning and wavelet-based fault location method for hybrid transmission
lines," in 2014 IEEE PES T&D Conference and Exposition, 2014, pp. 1-1.
[4] M. Ghazizadeh-Ahsaee, "Accurate NHIF Locator Utilizing Two-End Unsynchronized Measurements," Power Systems, IEEE Transactions on, vol. 28, 2013.
[5] J. Izykowski, E. Rosolowski, P. Balcerek, M. Fulczyk, and M. S. M., "Fault Location on Double-Circuit Series-
Compensated Lines Using Two-End Unsynchronized
Measurements," Power Delivery, IEEE Transactions on, vol. 26, 2011.
[6] C. E. M. de Pereira and L. C. Zanetta, "Fault Location in Multitapped Transmission Lines Using Unsynchronized Data and Superposition Theorem," Power Delivery, IEEE Transactions on, vol. 26, pp. 2081-2089, 2011.
[7] Liao, Yuan, and Ning Kang. "Fault-location algorithms without utilizing line parameters based on the distributed parameter line model." IEEE Transactions on Power Delivery 24.2 (2009): 579-584.
[8] Dalcastagnê, André Luís, et al. "An iterative two-terminal fault-location method based on unsynchronized phasors." IEEE Transactions on Power Delivery 23.4 (2008): 2318-2329. [9] Silveira, Eduardo G., and Clever Pereira. "Transmission line
fault location using two-terminal data without time synchronization." IEEE Transactions on Power Systems 22.1 (2007): 498-499.
[10] Izykowski, Jan, et al. "Accurate location of faults on power transmission lines with use of two-end unsynchronized measurements." IEEE Transactions on Power Delivery 21.2 (2006): 627-633.
[11] A. Salehi and A. M. Ranjb, "A Novel Method for Fault Location of Transmission Lines by Wide-Area Voltage Measurements Considering Measurement Errors," Smart Grid, IEEE Transactions on, vol. 6, 2015.
[12] L. Tzu-Chiao, L. Pei-Yin, and L. Chih-Wen, "An Algorithm for Locating Faults in Three-Terminal Multisection Nonhomogeneous Transmission Lines Using Synchrophasor Measurements," Smart Grid, IEEE Transactions on, vol. 5, pp. 38-50, 2014.
[13] Q. Jiang, B. Wang, and X. Li "An Efficient PMU-Based Fault-Location Technique for Multiterminal Transmission Lines," Power Delivery, IEEE Transactions on, vol. 29, 2014. [14] P. Dutta, A. Esmaeilian, and M. Kezunovic,
"Transmission-Line Fault Analysis Using Synchronized Sampling," Power Delivery, IEEE Transactions on, vol. 29, pp. 942-950, 2014. [15] Q. Jiang, X. Li, B. Wang, and H. Wang, "PMU-Based Fault
Location Using Voltage Measurements in Large Transmission Networks," Power Delivery, IEEE Transactions on, vol. 27, 2012.
[16] L. Ying-Hong, L. Chih-Wen, and C. Ching-Shan, "A new
PMU-based fault detection/location technique for
transmission lines with consideration of arcing fault discrimination-part I: theory and algorithms," Power Delivery, IEEE Transactions on, vol. 19, pp. 1587-1593, 2004.
[17] L. Ying-Hong, L. Chih-Wen, and C. Ching-Shan, "A new
PMU-based fault detection/location technique for
transmission lines with consideration of arcing fault discrimination-part II: performance evaluation," Power Delivery, IEEE Transactions on, vol. 19, pp. 1594-1601, 2004.