Abstract
Experiments made on ants as biological models revealed that a saccharose/sucralose 95.5/.05 mixture increased sugar water consumption, decreased general activity, precision of reaction, audacity, brood caring, cognition and ability in acquiring visual conditioning (short term memory), induced aggressiveness against nestmates, and slightly reduced tactile perception. It may not change the speed of locomotion and did not affect middle and long term memory. The adverse effects may be related to the strong sugared taste of the mixture (in presence of sugar and the saccharose/sucralose mixture, the ants slightly preferred the mixture) though it contains little sugar, and to the toxic chloropropanols sucralose may produce. When ants consumed again sugar instead of a saccharose/sucralose mixture, their aggressiveness rapidly decreased during eight hours and entirely vanished in 29 hours.
Keywords: Aggressiveness, Cognition, Conditioning, Food Consumption
Physiological and Ethological Disruptions Induced
by a Mixture of Saccharose/Sucralose
99.5/0.5 - A Study on Ants as Models
Marie-Claire Cammaerts
1*, Roger Cammaerts
2and Zoheir Rachidi
3 1Université Libre de Bruxelles, Faculte des Sciences, DBO, CP 160/12, 50 Av F.D. Roosevelt, 1050 Bruxelles,Belgium; [email protected] 2Bruxelles, Belgium; [email protected] 3Université Libre de Bruxelles, Campus Erasme, CP 609/01, 808 route de Lennik, 1070 Bruxelles, Belgium; [email protected]
1. Introduction
Sweeteners are largely consumed all over the world, the two more used being aspartame (in North America and Europe) and ‘stevia’ (in South America and Asia). According to a previous study made on ants as biological models, the strong sweet taste of aspartame, although being not a sugar, leads to ethological disturbances such as enhancing the search for food, increasing food consumption and decreasing several cognitive abilities1.
It hydrolyzes into phenylalanine, methanol and finally
formaldehyde in several tissues2. On the contrary,
stevia is a true glycoside extracted from the plant Stevia rebaudiana. It has few adverse effects but not a nice sweetened taste; it slightly reduces food consumption, and finally gives rise to steviol which is not without harmful
effects3. An adequate mixture of these two sweeteners
cancels the adverse effects of each4, but is presently not
on the market.
In the same way we have studied the effects of aspartame, stevia and a mixture of these two products1,3,4,
we here examine the effects of a commercially available mixture of saccharose/sucralose 99.5/0.5. We did not study the effects of sucralose alone, a non-sugar sweetener, because we know that consuming no sugar though having the perception of the sugar taste, thus of its presence, leads to strong ethological and physiological disruptions1.
We only wondered if a saccharose/sucralose 99.5/0.5 mixture could have no or nearly no adverse effect since, in addition to a pronounced sugar taste (the sweetness potency of sucralose is ca 600 times that of saccharose5),
Here below, we summarize what is known about sucralose and a commercial mixture of saccharose/ sucralose, why ants could be used as models, and what we intended to study.
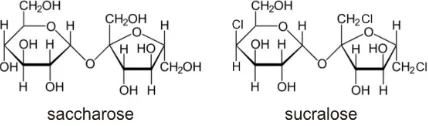
Sucralose structure is similar to that of saccharose, from which it is synthetized by selective replacement of three hydroxyl groups by chlorine (Figure 1). This synthesis and the pronounced sugared taste of sucralose
have been discovered in 19766. Sucralose was first
approved as food additive by Canada in 1991 and is nowadays authorized in more than 100 countries5,7. It
is not assimilated by the organism, being thus calorie-free; it is relatively non-reactive5, thus deemed having no
adverse effects. It can be consumed by children, pregnant women, and diabetics7. A saccharose/sucralose 99.5/0.5
mixture is commercialized under registered trademark. Sucralose has a stronger sweet taste than pure sugar. The mixture can thus contain far less sugar, and thus fewer calories, than pure sugar for obtaining an equivalent taste. No wonder that people do not hesitate to consume this mixture instead of pure sugar.
Most biological processes are similar for all animals. A lot of invertebrates and vertebrates can thus be used as models for studying biological subjects8. Invertebrates are
more and more used due to their short life cycle, simple anatomy, and availability. Among the invertebrates, insects
are good models9. Ants could advantageously be used.
Their colonies contain thousands of individuals and can be maintained in laboratories at low cost throughout the entire year. Ants are among the most complex and social invertebrate animals as for their morphology, physiology, social organization and behavior10. They have a unique
resting position of their labium, mandibles and maxilla,
as well as many glands emitting numerous efficient
pheromones. Their societies are highly organized with a strong division of labor, an age-based polyethism and a social regulation. Their behavior is well developed: They care for their brood, build sophisticated nests, chemically mark the inside of their nest, and, differently, their nest entrances, nest surroundings and foraging area. They generally use an alarm signal, a trail pheromone, and a recruitment signal; they navigate using memorized visual and olfactory cues; they efficiently recruit nestmates where, when and as long as it is necessary, and finally, they clean their nest and provide their area with cemeteries9,10.
According to the complexity of their society and behavior, it looks reasonable to use them as biological models for studying the effects of substances or treatments.
During many years, we worked on Myrmica ant
species, and among others, on Myrmica ruginodis
Nylander 1846. We know about their ecological traits, eye morphology11, subtended angle of vision12, visual
perception13, navigation system14, visual and olfactory
conditioning capabilities15, and recruitment strategy16.
The ontogenesis of cognitive abilities of Myrmica species has also been approached17. Studies on the impact of age,
activity and diet on their conditioning capability18 led to
presume that ants could be good biological models. This
was confirmed on Myrmica species by the study of the
effects of caffeine, theophylline, cocaine and atropine19,
of nicotine20, of morphine and quinine21, of fluoxetine
(an ‘ISRS’ antidepressant)22, of anafranil (an ‘ACT’
antidepressant) and efexor (an ‘IRSNa’ antidepressant)23, of
carbamazepine24, and of buprenorphine and methadone25.
Each time, effects observed on humans were confirmed and precised, and new information was produced. Here, we used M. ruginodis as a model for examining the effects of a sugar/sucralose 99.5/0.5 aqueous solution.
We first assessed 12 traits on ants consuming pure sugar, then, after one month, the same 12 traits on the same ants consuming sugar/sucralose, and finally three
more traits on the same ants going on consuming the
mixture. The 15 examined traits were:
• Sugar water and meat consumption, general activity.
• Locomotion (linear and angular speed), precision of
reaction, trail following behavior, audacity.
• Brood caring behavior, cognition, aggressiveness
against nestmates, tactile (pain) perception.
• Acquisition of visual conditioning and visual
memory.
• Preference between sugar water and an aqueous
solution of sugar/sucralose.
After these studies, we gave again sugar instead of sugar/sucralose to the ants and analyzed the decrease of the effect of the mixture on aggressiveness.
2. Material and Methods
2.1 Collection and Maintance of Ants
The experiments were performed on four colonies of M.
ruginodis collected in an old quarry of the Aise Valley (Ardenne, Belgium), on the borders of a forest, the ants nesting under stones or in wood. The colonies contained a queen, brood and about 250 workers. They were maintained in artificial nests made of three glass tubes half-filled with water, a cotton-plug separating the ants from the water. The glass tubes were set in a tray (34 cm x 23 cm x 4 cm), which internal sides were slightly covered with talc to prevent ants from escaping. The trays served as foraging areas, food being delivered in them. The ants
were fed with 30% sugar water provided ad libitum in
small glass tubes plugged with cotton, and with pieces of Tenebrio molitor larvae (Linnaeus, 1758) provided three times a week on a glass slide. After having made all the control assessments, the sugar water was replaced by an aqueous solution of sugar/sucralose 99.5/.05 w/w. Laboratory temperature was 18°C-22°C and the relative humidity circa 80%. Lighting had a constant intensity of 330 lux while caring for the ants, training and testing them; during other time periods, lighting was dimmed to 110 lux. The ambient electromagnetic field had an intensity of 2-3 µW/m2. All the members of a colony are
here named nestmates, as commonly done by researchers on social hymenoptera.
2.2 Aqueous Solution of Sugar/Sucralose
The used 99.5/0.5 sugar/sucralose mixture is commercialized as lumps under the label ‘Ti-light®’ by the manufacturer Raffinerie Tirlemontoise S.A. (Belgium, Südzucker Group). According to the manufacturer, one lump contains exactly 99.45% (=1.32 g) of sugar (saccharose and very few monosaccharides) and 0.55% (=0.07 g) of sucralose, furnishes 6 calories, and has the same sugared taste as (and even a nicer taste than) one lump of pure sugar (=6.25 g of sugar; 25 calories). Humans usually use one lump of the mixture into 150-200 ml of drink (coffee, tea, fruit juice…). In nature, ants consume nearly saturated sugared solutions. In the laboratory, we fed them with a solution of 10 lumps of pure sugar into 150 ml of water. Humans drink about
one litre per day, but insects proportionally drink about 10 times less. Consequently, for giving to ants an amount of sugar/sucralose similar to that consumed by humans, and for providing them with the sweetness to which they are accustomed, a solution of 10 lumps of the sugar/ sucralose 99.5/.05 mixture into 150 ml water must be used. The tubes used to provide sugar water to the ants had a capacity of 5 ml. We worked on four colonies (5
ml x 4 = 20 ml) and aimed to renew the solution each
week; we thus made a stock solution of 4 lumps of the mixture into 60 ml water. Five ml of that solution were poured into tubes then plugged with cotton and set on the ants’ foraging area. The cotton was refreshed each two days and the entire solution renewed every five or seven days. Sucralose is stable in water. A new stock solution was made when necessary. It was checked each day if ants actually consumed the aqueous solution of sugar/ sucralose.
All the assessments detailed below were made firstly, during one month, while ants did not consume that
mixture, and after that, while they continuously consumed it for about 6 weeks. The long time period between each kind of experiment made during the two different diets allowed using non-parametric χ² and Mann-Whitney
tests for analyzing some results26.
2.3 Sugar Water and Meat Consumption,
General Activity
For assessing the ants’ sugared water and meat food consumption, as well as their general activity, we counted during five days, four times per day, the ants of the four colonies present on the sugared food, on the T. molitor
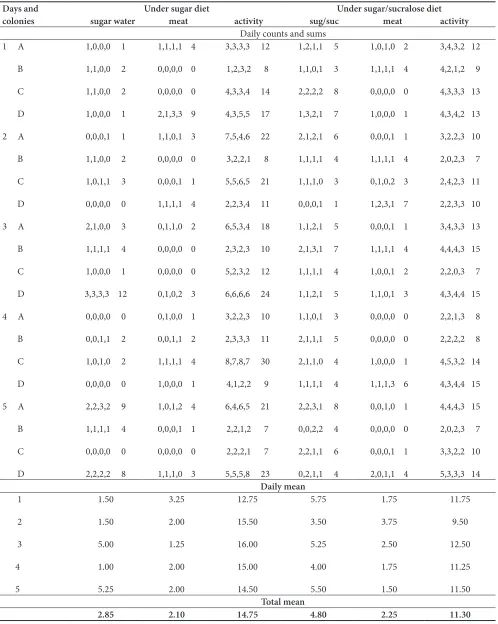
larvae, as well as those moving at any place in their environment (food sites, foraging area, nest entrances and inside nest). For each four colonies and each kind of counts, we added the four numbers obtained (Table 1, Daily counts). The mean of these daily counts was established for each kind of counts (Table 1, Daily mean). The five mean values obtained for ants under sugar/ sucralose diet were compared to those obtained when ants were under sugar diet using the non-parametric test of Wilcoxon26. We also established the average of these
Table 1. Effect of a sugar or a sugar/sucralose 99.5/0.5 diet on the ants’ consumption of the sugared (sugar or sug/suc) solution and of the meat food, and on their general activity. Experimental details and statistical analysis are given in the text. Briefly, the mixture increased sugared solution consumption, and reduced general activity
Days and
colonies sugar water meat activityUnder sugar diet sug/suc meat activityUnder sugar/sucralose diet
Daily counts and sums 1 A
B
C
D
2 A
B
C
D
3 A
B
C
D
4 A
B
C
D
5 A
B
C
D
1,0,0,0 1
1,1,0,0 2
1,1,0,0 2
1,0,0,0 1
0,0,0,1 1
1,1,0,0 2
1,0,1,1 3
0,0,0,0 0
2,1,0,0 3
1,1,1,1 4
1,0,0,0 1
3,3,3,3 12
0,0,0,0 0
0,0,1,1 2
1,0,1,0 2
0,0,0,0 0
2,2,3,2 9
1,1,1,1 4
0,0,0,0 0
2,2,2,2 8
1,1,1,1 4
0,0,0,0 0
0,0,0,0 0
2,1,3,3 9
1,1,0,1 3
0,0,0,0 0
0,0,0,1 1
1,1,1,1 4
0,1,1,0 2
0,0,0,0 0
0,0,0,0 0
0,1,0,2 3
0,1,0,0 1
0,0,1,1 2
1,1,1,1 4
1,0,0,0 1
1,0,1,2 4
0,0,0,1 1
0,0,0,0 0
1,1,1,0 3
3,3,3,3 12
1,2,3,2 8
4,3,3,4 14
4,3,5,5 17
7,5,4,6 22
3,2,2,1 8
5,5,6,5 21
2,2,3,4 11
6,5,3,4 18
2,3,2,3 10
5,2,3,2 12
6,6,6,6 24
3,2,2,3 10
2,3,3,3 11
8,7,8,7 30
4,1,2,2 9
6,4,6,5 21
2,2,1,2 7
2,2,2,1 7
5,5,5,8 23
1,2,1,1 5
1,1,0,1 3
2,2,2,2 8
1,3,2,1 7
2,1,2,1 6
1,1,1,1 4
1,1,1,0 3
0,0,0,1 1
1,1,2,1 5
2,1,3,1 7
1,1,1,1 4
1,1,2,1 5
1,1,0,1 3
2,1,1,1 5
2,1,1,0 4
1,1,1,1 4
2,2,3,1 8
0,0,2,2 4
2,2,1,1 6
0,2,1,1 4
1,0,1,0 2
1,1,1,1 4
0,0,0,0 0
1,0,0,0 1
0,0,0,1 1
1,1,1,1 4
0,1,0,2 3
1,2,3,1 7
0,0,0,1 1
1,1,1,1 4
1,0,0,1 2
1,1,0,1 3
0,0,0,0 0
0,0,0,0 0
1,0,0,0 1
1,1,1,3 6
0,0,1,0 1
0,0,0,0 0
0,0,0,1 1
2,0,1,1 4
3,4,3,2 12
4,2,1,2 9
4,3,3,3 13
4,3,4,2 13
3,2,2,3 10
2,0,2,3 7
2,4,2,3 11
2,2,3,3 10
3,4,3,3 13
4,4,4,3 15
2,2,0,3 7
4,3,4,4 15
2,2,1,3 8
2,2,2,2 8
4,5,3,2 14
4,3,4,4 15
4,4,4,3 15
2,0,2,3 7
3,3,2,2 10
5,3,3,3 14
Daily mean 1 2 3 4 5 1.50 1.50 5.00 1.00 5.25 3.25 2.00 1.25 2.00 2.00 12.75 15.50 16.00 15.00 14.50 5.75 3.50 5.25 4.00 5.50 1.75 3.75 2.50 1.75 1.50 11.75 9.50 12.50 11.25 11.50 Total mean
2.4 Linear and Angular Speed; Orientation
towards an Alarm Signal
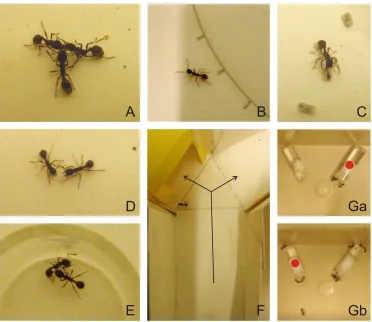
The assessments were made on ants freely moving on their foraging area. For each assessment, the movement of ten ants of each colony (n = 4 x 10 = 40 ants) was analyzed. Linear and angular speed was assessed without presenting stimulus to the ants. Orientation towards an alarm signal was assessed by presenting an isolated worker’s head to the ants. Such a head emits alarm pheromone just like an alarmed worker.
Trajectories were manually recorded, a metronome set at 1 second allowing assessing the total time of each trajectory, until the ant reached the stimulus or walked along about 6 cm. The trajectories were then copied on
transparent polyvinyl sheets remaining affixed to a PC monitor screen due to their own static electricity charge. They were analyzed using specifically designed software27,
each trajectory being entered in the software by clicking as many points as wanted with the mouse and by entering then the location of the presented worker’s head. After that, the total time of the trajectory was entered, and the software was asked to calculate the ant’s linear speed, angular speed and orientation. The linear speed (V, measured in mm/s) is the length of a trajectory divided by the time spent moving along it. The angular speed (S, measured in angular degrees/cm) is the sum of the angles, measured at each successive point of the trajectory, made by each segment ‘point i to point i – 1’ and the following
segment ‘point i to point i + 1’, divided by the length of the trajectory. The orientation (O, measured in angular degrees) towards a given point is the sum of the angles, measured at each successive point of the recorded trajectory, made by each segment ‘point i of the trajectory - given point’ and each segment ‘point i - point i + 1’, divided by the number of measured angles. When O is lower than 90°, the animal has a tendency to orient itself towards the point; when it is larger than 90°, the animal has a tendency to avoid the point. Each distribution was characterized by its median and quartiles (Table 2) and the distributions obtained for ants consuming sugar/ sucralose were compared to those obtained for ants under sugar diet, using the non-parametric χ2 test.
2.5 Trail following Behavior
The ants’ response to their trail pheromone was assessed by quantifying the reaction of 40 ants on an artificial circular trail. The trail pheromone of Myrmica ants is produced by the workers’ poison gland. Ten poison glands were isolated in 500 µl hexane and stored at -25°C. To perform one experiment, 50 µl of the solution was deposited, using a metallic normograph pen, on a circle (R = 5 cm) pencil drawn on a piece of white paper and divided into 10 angular degrees arcs (Figure 2(b)). One minute later, the piece of paper was set in the ants’ foraging area. When an ant came into contact with the trail, its response was assessed by the number of 10 angular degree arcs it walked without departing from the trail, even if it reversed its walking. If an ant turned back when coming in front of the trail, its response was assessed as “zero arc walked”; when it crossed the trail without following it, its response equaled “one walked arc”. Before testing the ants on a trail, they were observed on a “blank” circumference imbibed with 50 µl of pure hexane (Table 2). Each distribution of values was characterized by its median and quartiles. The distributions obtained for ants consuming sugar/ sucralose was compared to those obtained for ants under sugar diet using the non-parametric χ² test.
2.6 Audacity
This trait was assessed on the four colonies. A cylindrical tower built in strong white paper (Steinbach ®, height = 4 cm; diameter = 1.5 cm) was set on the ants’ foraging area, and the ants present on it, at any place, were counted 12 times within 12 min. The mean and extremes of the
obtained values were established (Table 2). The values obtained under the two kinds of diet were compared using the non-parametric Mann-Whitney U test.
2.7 Brood Caring Behavior
This trait was assessed on colonies A and C which contained numerous larvae. A few larvae were removed from the inside of the nest and deposited in front of the nest entrance. For each colony, five of them were observed, as well as the ants’ behavior in front of them (Figure 2(c)). The larvae still remaining out of the nest were counted after 5 s, 2, 4, 6, 8, and 10 min, and the numbers recorded for each colony added (Table 2). The results obtained for ants under sugar/sucralose diet were compared to those obtained for ants under sugar diet using the non-parametric Wilcoxon test.
2.8 Cognition
This trait was assessed on ants of colonies A and C using two apparatus, previously described20, one for each colony.
Each apparatus consisted in a small tray (15 cm x 7 cm x 4.5 cm) inside of which pieces of white extra strong paper (Steinbach ®, 12 cm x 4.5 cm) were inserted in order to create a way with twists and turns between a loggia too narrow for 15 ants (the initial loggia) and a large one. For each colony, 15 ants were collected and set in the initial loggia. Then, the ants located in the initial loggia and in the large one were counted after 5 s, 2, 4, 6, 8 and 10 minutes. The numbers obtained for the two colonies were added (Table 2), and the results obtained for ants under sugar/sucralose diet were compared to those obtained for these ants under sugar diet using the non-parametric Wilcoxon test.
2.9 Aggressiveness between Nestmates
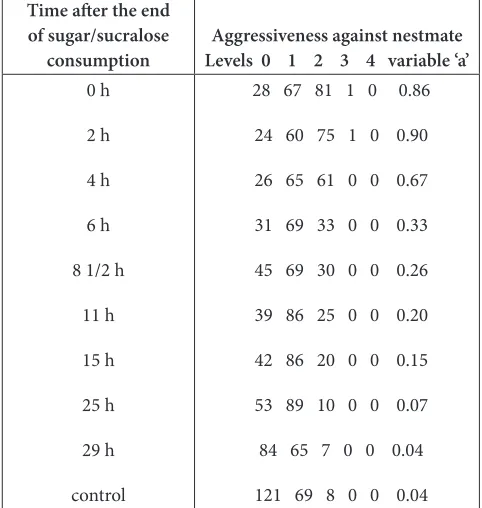
antennae (level 1), opened its mandibles (level 2, Figure 2(d)), gripped and/or pulled the other ant (level 3), tried to sting or stung the other ant (level 4). The numbers recorded for the two colonies were added (Table 2), and the results obtained for ants consuming the mixture were compared to those obtained when ants consumed sugar, using the non-parametric χ² test. We set up a variable ‘a’, equaled to the number of levels 2 + 3 + 4 divided by the number of levels 0 + 1, for easily examining the decrease of the ‘aggressiveness’ effect of the mixture after this mixture was replaced by sugar (Figure 3).
2.10 Tactile (Pain) Perception
This trait was assessed on ants of colonies A and C using two apparatus (one for each colony) made of a tray (15 cm x 7 cm x 4.5 cm) into which a piece (3 cm x 11 cm) of rough emery n° 280 paper, folded (11 cm: 2 cm + 7 cm + 2 cm), was tied to the bottom and the borders, dividing the tray in three zones: a initial smooth one 3 cm long (too small for 12 ants at a time), a 3 cm long one on which ants’ walking should be uncomfortable, and a large smooth one 9 cm long. For each colony, 12 ants were set all together in the initial zone, and the linear and angular speed of
12 ants (n = 2 x 12 = 24) moving on the rough substrate were assessed (Table 2, tactile (pain) perception). The values obtained for ants consuming the mixture were compared to those of ants consuming sugar using the non-parametric χ² test.
2.11 Acquisition of Visual Operant
Conditioning, and Visual Memory
This was examined on the four colonies. At a given time, a yellow hollow cube under which ants could enter was set above pieces of T. molitor larvae as food, the ants undergoing so visual operant conditioning. These cubes were made of strong paper according to previously instructions15, andthe wavelengths reflection
of the yellow paper has previously been determined. Tests were performed while ants were expected to acquire conditioning, and after removal of the yellow cube, while they were expected to partly lose their conditioning. Ants were individually tested in a Y-apparatus constructed of strong white paper, and set in a tray (30 cm x 15 cm x 4 cm) as previously explained15. Each colony had its own
Y-apparatus the sides of which were slightly covered
with talc, and the floor changed between tests. The Y-apparatus was provided with a yellow hollow cube in one of its branches. Half of the tests were conducted with the cube in the left branch, the other half with the cube in the right branch. Choosing the way with the yellow cube was considered as giving the correct choice. Control and training experiments had previously been made
on ants consuming sugar15 because, once an animal is
conditioned to a stimulus, it becomes no longer naïve for such an experiment. To conduct a test on a colony, 10 ants were transferred one by one onto the area at the entrance of the Y-apparatus. Each ant was observed until it turned to the left or to the right, and its first choice was recorded when it was beyond a pencil drawn line indicating the entrance of a branch (Figure 2(e)). After that, the ant was transferred into a polyacetate cup, until 10 ants were tested, this avoiding testing twice the same ant. All the tested ants were then returned in their foraging area. For each test, the numbers of ants (n = 10 x 4 = 40) which chose the correct way with the yellow cube, or went to the wrong empty branch of the Y were recorded, and the percentage of correct responses established (Table 3). Numerical results for ants consuming sugar/sucralose were compared to those for ants consuming sugar using the non-parametric Wilcoxon test.
2.12 Preference between Sugar Water and a
Sugar/Sucralose Solution
2.13 Loss of the Aggressiveness Effect of
Sugar/Sucralose after its Consumption
Ended
On day 22, after 21 days of continuous sugar/sucralose consumption, at 9:30, the tubes containing the mixture were removed from the ants’ tray and replaced by tubes containing sugar water. After that, the ants’ aggressiveness against nestmates was assessed in the course of time, in the way it had previously been assessed. The results (Table 4, Figure 3) were statistically analyzed using the non-parametric χ² test.
3. Results
3.1 Food Consumption and General Activity
Ants were more numerous on a sugar/sucralose solution than previously on a sugar solution, this being significant (Table 1, N = 5, T = 15, P = 0.031). They were as numerous on meat when provided with a sugar/sucralose solution as when receiving a sugar solution (Table 1, N = 5, T = -7, +8, NS). Ants under sugar/sucralose diet were significantly less active than those consuming sugar water (Table 1, N = 5, T = 15, P = 0.031).
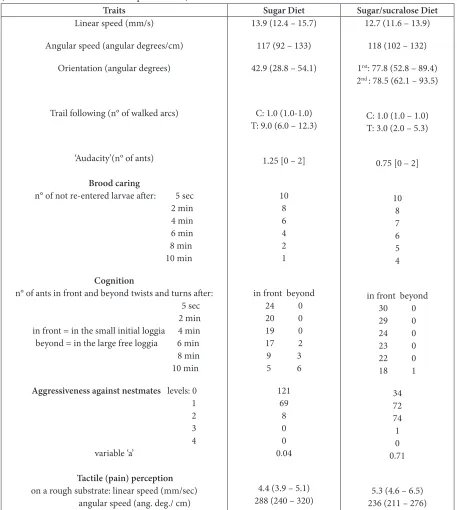
3.2 Speed of Locomotion
Under sugar/sucralose diet, the ants walked at a slightly lower speed than when they consumed sugar water, but the difference was not significant (χ² = 4.30, df = 2, NS). The ants moved with an identical sinuosity being under either diet (Table 2).
3.3 Orientation towards an Alarm Signal
This trait was affected by sugar/sucralose instead of sugar consumption (Table 2). While ants under sugar diet oriented themselves well towards a source of alarm pheromone, when consuming sugar/sucralose instead of sugar, they had difficulties in doing so, and their orientation was statistically less precise (χ² = 19.35, df = 2, P < 0.01). This result was checked and confirmed by a supplementary experiment (Table 2, Orientation, 2nd).
3.4 Trail following Behavior
This trait was affected by sugar/sucralose instead of sugar consumption (Table 2). Under sugar diet, ants followed a circular trail along about 9.0 arcs of 10°. Under sugar/ sucralose diet, they followed only 3.0 arcs of 10°. This
difference of ants’ capability in following a trail was significant: χ² = 29.01, df = 2, P < 0.01.
3.5 Audacity
This trait was affected by sugar/sucraloseinstead of sugar consumption (Table 2). Meanly 1.7 times more ants under sugar diet were counted on the apparatus and a few ones climbed to the top of the tower. Ants under sugar/ sucralose diet were less inclined in doing so and no ant climbed to the top of the tower. Such a difference between the two diets was significant: U = 485, Z adjusted = 3.4031, P = 0.00066.
3.6 Brood Caring Behavior
This trait was affected by sugar/sucralose instead of
sugar consumption (Table 2). Ants under sugar diet quickly found the larvae removed from the nest, took them between their mandibles, transported them to an entrance and re-entered them. After ten minutes, only one among the ten observed was not re-entered. Ants under sugar/sucralose diet found the larvae with difficulty. They delayed in holding them between their mandibles (Figure 2(c)) and walked erratically before reaching an entrance and re-entering the larvae. At the end of the ten minutes, four larvae, among the ten, were not re-entered. The difference between the two diets was at the limit of significance: N = 4, T = 10, P = 0.0625.
3.7 Cognition
This trait was affected by sugar/sucralose consumption (Table 2). Under sugar diet, ants soon moved into the twists and turns and, after the ten experimental minutes, only five ants were still in the initial loggia while six ones had reached the large loggia beyond the twists and turns. Ants under sugar/sucralose diet were less able to do so. A few ants went into the twists and turns but often turned back on their way so that after the ten experimental minutes, 18 ants were still in the initial loggia while only one had reached the large loggia.The difference in ants’ behavior between the two diets was significant: initial loggia: N = 6, T = 21, P = 0.016; large one: N = 3, NS, due to the smallness of the sample.
3.8 Aggressiveness against Nestmates
behavior against nestmates. They stayed near them slowly moving their antennae, they responded to the antennal movements of their nestmates and touched them with their antennae. They seldom opened their mandibles. Under sugar/sucralose diet, ants seldom stayed near
their nestmates. They contacted them roughly with their antennae and opened their mandibles many times. The difference of ants’ behavior during encountering was significant: χ² = 101.19, df = 2, P < 0.001.
Table 2. Effect of sugar/sucralose consumption on nine ants’ traits. Experimental details and statistics are given in the text. Briefly, the mixture modified at least five traits. C = Control (blank circumference); T = Test (circumference drawn with trail pheromone)
Traits Sugar Diet Sugar/sucralose Diet
Linear speed (mm/s)
Angular speed (angular degrees/cm)
Orientation (angular degrees)
Trail following (n° of walked arcs)
‘Audacity’(n° of ants)
Brood caring
n° of not re-entered larvae after: 5 sec 2 min 4 min 6 min 8 min 10 min
Cognition
n° of ants in front and beyond twists and turns after: 5 sec 2 min in front = in the small initial loggia 4 min beyond = in the large free loggia 6 min 8 min 10 min
Aggressiveness against nestmates levels: 0
1
2
3
4
variable ‘a’ Tactile (pain) perception on a rough substrate: linear speed (mm/sec) angular speed (ang. deg./ cm) 13.9 (12.4 – 15.7) 117 (92 – 133) 42.9 (28.8 – 54.1) C: 1.0 (1.0-1.0) T: 9.0 (6.0 – 12.3) 1.25 [0 – 2] 10 8 6 4 2 1 in front beyond 24 0
20 0
19 0
17 2
9 3
5 6
121 69 8 0 0 0.04 4.4 (3.9 – 5.1) 288 (240 – 320) 12.7 (11.6 – 13.9) 118 (102 – 132) 1rst: 77.8 (52.8 – 89.4) 2nd : 78.5 (62.1 – 93.5) C: 1.0 (1.0 – 1.0) T: 3.0 (2.0 – 5.3) 0.75 [0 – 2] 10 8 7 6 5 4 in front beyond 30 0
29 0
24 0
23 0
22 0
18 1
34 72 74 1 0 0.71
3.9 Tactile (Pain) Perception
This trait was slightly affected by sugar/sucralose instead of sugar consumption (Table 2). On a rough substrate, the ants under sugar diet moved with difficulty, very slowly and sinuously. This was less pronounced for ants under sugar/sucralose diet but the difference was at the limit of significance: linear speed: χ² = 3.2, df = 1, 0.05 < P < 0.10; angular speed: χ² = 6.66, df = 2, 0.02 < P < 0.05.
3.10 Visual Conditioning and Memory
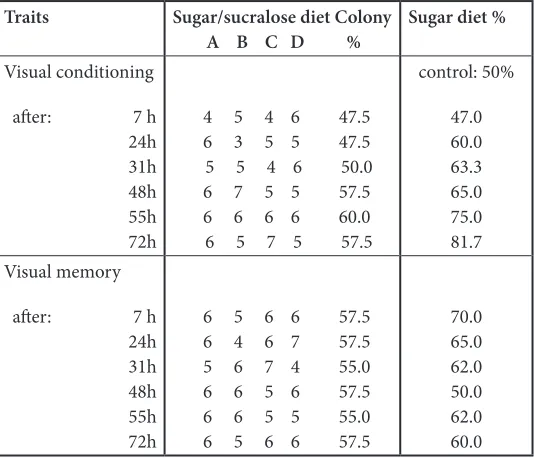
While ants under sugar diet acquired a conditioning score of 81-82 % in 72 hours, those consuming sugar/ sucralose reached only a score of 57.5-60 % in the same time period (Table 3). This difference of conditioning capability was significant: N = 5, T = -15, P = 0.031. After removal of the visual cue, ants under sugar diet lost part of their conditioning and retained about 10% of it. They successively lost 11%, 5%, 3%, 12%, gained 12%, lose again 2% of their conditioning after 7 h, 24 h, 31 h, 48 h, 55 h and 72 h respectively. After the same time
periods, ants under sugar/sucralosediet lost successively 0%, 0%, 2.5%, gained 2.5%, lost again 2.5% and gained again 2.5% of their conditioning (Table 3). The difference of ants’ memory did not statistically differ, even if ants under sugar/sucralose diet obviously retained nearly all of their poor conditioning: N = 6, T = 17, P = 0.109. Sugar/sucralose consumption affected thus the ants’ conditioning, so their short term memory, but did not reduce their middle and long term memory.
3.11 Preference between Sugar Water and a
Sugar/Sucralose Solution
In front of these two solutions, 21 ants of colony A went drinking the mixture while 30 ants went onto the sugar solution, and two ants of colony C went drinking the sugar solution while 28 ants went onto the mixture. Thus, 49 ants (60.5%) preferred the sugar/sucralose solution while 32 ones (39.5%) chose the sugar one. This result did not differ from that expected if ants randomly went drinking the two solutions (χ2= 1.40, df = 1, NS).
Table 3. Effect of sugar/sucralose consumption on ants’ visual conditioning and memory. The ants were trained to a yellow cube and tested in a Y apparatus provided with such a cube in one of its branch. The table gives the numbers of ants giving the correct response and the proportion of correct responses for the tested population. The mixture reduced the ants’ ability in acquiring visual conditioning, but did not impact their middle and long term memory
Traits Sugar/sucralose diet Colony
A B C D % Sugar diet %
Visual conditioning
after: 7 h 24h 31h 48h 55h 72h
4 5 4 6 47.5 6 3 5 5 47.5 5 5 4 6 50.0 6 7 5 5 57.5 6 6 6 6 60.0 6 5 7 5 57.5
control: 50%
47.0 60.0 63.3 65.0 75.0 81.7 Visual memory
after: 7 h 24h 31h 48h 55h 72h
6 5 6 6 57.5 6 4 6 7 57.5 5 6 7 4 55.0 6 6 5 6 57.5 6 6 5 5 55.0 6 5 6 6 57.5
Table 4. Decrease of the aggressiveness effect of sugar/ sucralose after its consumption ended. Details and statistics are given in the text. Briefly, the studied effect rapidly decreased from 2 h to about 8 h and fully vanished in 29 h
Time after the end of sugar/sucralose
consumption Levels 0 1 2 3 4 variable ‘a’Aggressiveness against nestmate
0 h
2 h
4 h
6 h
8 1/2 h
11 h
15 h
25 h
29 h
control
28 67 81 1 0 0.86
24 60 75 1 0 0.90
26 65 61 0 0 0.67
31 69 33 0 0 0.33
45 69 30 0 0 0.26
39 86 25 0 0 0.20
42 86 20 0 0 0.15
53 89 10 0 0 0.07
84 65 7 0 0 0.04
121 69 8 0 0 0.04
3.12 Loss of the Aggressiveness Effect of
Sugar/Sucralose after its Consumption
Ended
Results are detailed in Table 4 and partly illustrated in Figure 3. Before stopping consuming sugar/sucralose instead of sugar (t = 0 h), and still 2 h after having again consumed a sugar solution, the ants were aggressive against nestmates (t = 0 h: χ² = 119.18, df = 2, P < 0.001; t = 2 h: χ² = 116.39, df = 2, P < 0.001). This aggressiveness rapidly decreased from 2 h to about 8 h after the end of sugar/sucralose consumption; the results obtained after 2 h and 8 1/2 h statistically differed: χ² = 25.49, df = 2, P < 0.001. After that, the decrease of the aggressiveness effect slowed: the results obtained after 8 1/2 and 15 h did not statistically differ (χ² = 3.44, df = 2, NS). After a total of 25 h, the ants became slightly aggressive against nestmates: They repeatedly contacted them with their antennae but seldom opened their mandibles; the results still differed from the control ones (χ² = 23.53, df = 2, P < 0.001). After a total of 29 hours, the ants were no longer aggressive; the results were similar to the control ones (χ² = 2.28, df = 2,
Figure 3. Decrease of the aggressiveness effect of a sugar/ sucralose (99.5/0.5) solution after its consumption ended. Numerical details and results are given in Table 4; statistics are provided in the text.
4. Discussion
Using ants as models, we studied the effects of a sugar/ sucralose 99.5/0.5 mixture, an easily available substitute to sugar. This mixture increased sugar consumption and induced aggressiveness against nestmates. It decreased general activity, precision of reaction, orientation, audacity, cognition and conditioning ability, it slightly decreased brood caring behavior and tactile perception, but did not affect middle and long term memory. Having to choose between pure sugar and a sugar/sucralose mixture, the ants slightly but not significantly preferred the mixture, presenting thus no addiction to it. When ants stopped consuming the mixture and consumed again sugar, the aggressiveness effect of the mixture vanished in about 29 h.
contains some sugar, it does not affect middle and long term memory nor the perception of pheromones, it does not suppress brood caring behavior and does not lead to strong aggressiveness against nestmates, it does not act as an addictive product. However, it contains sucralose which might have, by itself, some adverse effects (see below).
Although no acute toxic effects have been observed in crustacea and fishes in presence of sucralose using standardized toxicity tests28, non-standard ecotoxicity
tests have shown significant feeding and behavioral alterations on crustacea after a short term exposure to this substance29,30. Sucralose was also shown to increase
swimming speed and height in Daphnia magna, as well
as more random orientation and lower respiration rate in Gammarus zaddachi29. Moreover, sucralose induced
biochemical responses in Daphnia magna31, with an
increase of Acetylcholinesterase (AChE) and antioxidative defense. Such an increase was shown in humans to be linked to neurodegenerative diseases. All these effects may partly explain the physiological and behavioral changes we observed in the ant M. ruginodis.
Contrary to some reviews stating the safety of sucralose5,32, a recent review shows that this substance is
not biologically inert and may be harmful33, even if not
hydrolyzed in chloropropanols. Sucralose even affects the insuline responses in obese people, although it is used for losing weight34.
We suggest testing a sugar/sucralose 99.9/0.1 mixture. It might have nearly no adverse effect since its content in sucralose is lower, its amount of sugar is higher and it should have a less pronounced sugared taste. It might be as safe as a stevia/aspartame 91/9 mixture4.
5. Conclusion
Using ants as models, the mixture sugar/sucralose (99.5/0.5), considered as inoffensive, was shown to induce physiological and ethological disruptions (i.e., more sugared food consumption, decrease of cognitive abilities, aggressiveness) because it has a strong sugared taste though containing little sugar, and because sucralose may metabolize into chloropropanols. The use of a saccharose/ sucralose mixture in the 99.5/0.5 proportion should thus be reconsidered.
6. Conflict of interest
We affirm having no conflict of interest concerning the use of the sugar/sucralose 99.5/0.5 mixture.
7. References
1. Cammaerts M-C, Cammaerts R. Aspartame increases food demand and impacts behavior: A study using ants as mod-els. Acta Biomedica Scientia. 2016; 3:9–23.
2. Trocho C, Pardo R, Rafecas I, Virgili J, Ramesar X, Fernan-dez-Lopez JA, Alemany M. Formaldehyde derived from dietary aspartame binds to tissue components in vivo. Life Sciences. 2009; 63:337–49.
3. Cammaerts M-C, Dero A, Cammaerts R. Stevia: A true glycoside used as a sweetener and not affecting behavior. Asian J Pharmaceutical Research and healthcare. 2016; 8(1):19–31.
4. Cammaerts M-C, Cammaerts R, Dero A. A 0.123% stevia/ aspartame 91/9 aqueous solution balances the effects of the two substances, and may thus be a safer and tastier sweet-ener to be used. J Pharmacy and Nutrition Sciences. 2015; 5:236–48.
5. Grotz VL, Molinary S, Peterson RC, Quinlan ME, Reo R. Sucralose. Chapter 12 in ‘Alternative Sweeteners’. 4th ed. FL: Lyn O’Brien Nabors, CRC Press, Taylor and Francis; 2011. p. 181–96.
6. Rodero AB, Rodero LS, Azoubel R. Toxicidad de la su-cralosa en humanos: Una revisión. Int J Morphol. 2009; 27(1):239–44.
7. Available from: https://fr.wikipedia.org/wiki/Sucralose
8. Kolb B, Whishaw IQ. Cerveau et comportement. De Boeck
Supérieur. Paris, Bruxelles; 2002. p. 649.
9. Andre RG, Wirtz RA, Das YT. Insect models for biomed-ical research. In Woodhead AD, editors, Nonmammalian Animal Models for Biomedical Research. Boca Raton, FL: CRC Press; 1989.
10. Holldobler B, Wilson EO. The ants. Berlin: Harvard Univer-sity Press, Springer-Verlag; 1990.
11. Rachidi Z, Cammaerts M-C, Debeir O. Morphometric study of the eye of three species of Myrmica (Formicidae). Belg J Entomol. 2008; 10:81–91.
12. Cammaerts M-C. Visual vertical subtended angle of
Myr-mica ruginodis and Myrmica rubra (Formicidae, Hymenop-tera). Bull Soc r belg Ent. 2011; 147:113–20.
13. Cammaerts M-C. The visual perception of the ant
Myrmi-ca ruginodis (Hymenoptera – Formicidae). Biologia. 2012; 67:1165–74.
14. Cammaerts M-C, Rachidi Z, Beke S, Essaadi Y. Use of
ol-factory and visual cues for traveling by the ant Myrmica
ru-ginodis (Hymenoptera, Formicidae). Myrmecological News 2012; 16:45–55.
15. Cammaerts M-C, Nemeghaire S. Why do workers of
relying mainly on their vision? Bull Soc r belg Ent. 2012; 148:42–52.
16. Cammaerts MC, Cammaerts R. Food recruitment
strate-gies of the ants Myrmica sabuleti and Myrmica ruginodis.
Behav Proc 1980; 5: 251-270.
17. Cammaerts M-C, Cammaerts R. Ontogenesis of ants’ cog-nitive abilities (Hymenoptera, Formicidae). Advances Stud-ies in Biology. 2015; 7:335–48 + synopsis: 349–50.
18. Cammaerts M-C, Gosset G. Impact of age, activity and diet
on the conditioning performance in the ant Myrmica
rugin-odis used as a biological model. Int J Biology. 2014; 6:10–20.
ISSN: 1916-9671 E-ISSN 1916-968X.
19. Cammaerts M-C, Rachidi Z, Gosset G. Physiological and ethological effects of caffeine, theophylline, cocaine and
atropine; study using the ant Myrmica sabuleti
(Hymenop-tera, Formicidae) as a biological model. Int J Biology. 2014; 3:64–84.
20. Cammaerts M-C, Gosset G, Rachidi Z. Some physiolog-ical and ethologphysiolog-ical effects of nicotine; studies on the ant
Myrmica sabuleti as a biological model. Int J Biology. 2014; 6:64–81.
21. Cammaerts M-C, Cammaerts R. Physiological and etho-logical effects of morphine and quinine, using ants as bio-logical models. J of Pharmaceutical Biology. 2014; 4:43–58. 22. Cammaerts M-C, Cammaerts D. Physiological and etho-logical effects of fluoxetine, on ants used as bioetho-logical mod-els. Int J Biology. 2015; 7(2):1–18. DOI: 10.5539/ijb.v7n2p1. 23. Cammaerts M-C, Cammaerts D. Physiological and etho-logical effects of antidepressants: A study using ants as bi-ological models. Int J Pharmac Sciences Invention. 2015; 4(2):4–24. Available from: http://www.ijpsi.org/current-is-sue.html#Paper2, 27.6718/04204024
24. Cammaerts M-C, Cammaerts D. Potential harmful effects of Carbamazepine on aquatic organisms, a study using ants as invertebrate models. Int J Biology 2015; 7(3):75–93. DOI: 10.5539/ijb.v7n3p75.
25. Cammaerts M-C, Cammaerts R. Effects of buprenorphine and methadone, two analgesics used for saving humans de-pendent on morphine consumption. Int J Pharmac Scienc-es Invention. 2015; 4:1–19.
26. Siegel S, Castellan NJ. Nonparametric statistics for the be-havioral sciences. Singapore: McGraw-Hill, Book Compa-ny; 1989.
27. Cammaerts M-C, Morel F, Martino F, Warzee N. An easy and cheap software-based method to assess two-di-mensional trajectories parameters. Belg J Zoology. 2012; 142:145–51.
28. Tollefsen KE, Nizzetto L, Hugget DB. Presence, fate and effects of the intense sweetener sucralose in the aquat-ic environment. Science of the Total Environment. 2012; 438:510–6.
29. Wiklund A-KE, Breitholtz M, Bengtsson B-E, Adolfs-son-Erici M. Sucralose- An ecotoxical challenger? Chemo-sphere. 2012; 86:50–5.
30. Hjorth M, Hansen JH, Camus L. Short-term effects of
sucralose on Calanus finmarchicus and Calanus glacialis
in Disko Bay, Greenland. Chemistry and Ecology. 2010; 26(45):385–93.
31. Wiklund A-KE, Adolfsson-Erici M, Liewenborg B,
Gorok-hova E. Sucralose induces biochemical responses in
Daph-nia magna. PLoS One 2014; 9(4):e92771. DOI: 10.1371/ journal.pone.0092771.
32. Grotz VL, Munro IC. An overview of the safety of sucralose. Regulatory Toxicology and Pharmacology. 2009; 55:1–5. 33. Schiffman SS, Rother KI. Sucralose, a synthetic
organochlo-rine sweetener: Overview of biological issues. J Toxicol En-viron Health, Part B. 2013; 16:399–451.