Australian Journal of Basic and Applied Sciences
2019 November; 13(11): pages 10-18 DOI: 10.22587/ajbas.2019.13.11.2
Original paper AENSI Publications Journal home page: www.ajbasweb.com
Australian Journal of Basic and Applied Sciences ISSN: 1991-8178, EISSN: 2309-8414
Migration of Plastic Bag Additives in
Attiéké
(A Fermented
Cassava-based Couscous in Côte d'Ivoire)
Kombo Mananga Olivier Simon1, Gnagne Agnes Essoh Jean Eudes Yves1, Gadji Alahou André Gabazé3, Ballet
Guy Tiama1 et Yapo Ossey Bernard1,2
1Laboratoire des Sciences de l’Environnement (LSE), Unité de Formation et de Recherches en Sciences et Gestion de l’Environnement (UFR-SGE), Université Nangui Abrogoua, 02 BP 801 ABIDJAN 02, Côte-D’ivoire
2Laboratoire Central de l’Environnement du Centre Ivoirien Anti-pollution (LCE-CIAPOL), 20 BP 650 ABIDJAN 20, Côte-d’Ivoire 3Station de recherche sur les cultures vivrières/CNRA, 01 BP 633 Bouaké 01, Côte-d’Ivoire
Correspondence Author: Kombo Mananga Olivier Simon, Laboratoire des Sciences de l’Environnement (LSE), Unité de Formation et de Recherches en Sciences et Gestion de l’Environnement (UFR-SGE), Université Nangui Abrogoua, 02 BP 801 ABIDJAN 02, Côte-D’ivoire
E-mail: [email protected]
Received date: 15 August 2019, Accepted date: 20 October 2019, Online date: 22 November 2019
Copyright: © 2019 Kombo Mananga Olivier Simon et al, This is an open-access article distributed under the terms of the Creative Commons Attribution License, which permits unrestricted use, distribution, and reproduction in any medium, provided the original author and source are credited.
Keywords: Attiéké, Additives, Plastic bags, Migration, Contamination
INTRODUCTION
Oil shortages, health risks such as endocrine disruptions (Yang et al., 2011 ; Tranfo et al., 2011 ; Hannas et al., 2011) and especially environmental problems caused by the use of fossil polymers (non-biodegradable, resistant in nature for about 400 years and causing soil and water pollution) have led several countries around the world including Côte d'Ivoire to ban the production and the use of plastic bags of fossil origin. However, due to a lack of alternative, the packaging of attiéké in its plastic bags is still topical. Attiéké, couscous made from fermented cassava, is a staple food in Côte d'Ivoire packaged in polythene plastic bags before being sold on the Ivorian markets. Its annual production is estimated between 18965 tonnes and 40 000 tonnes (Krabi et al., 2015). In order to improve the physicochemical properties of the bags, during their synthesis, several additives are incorporated into them, namely: Antioxidants such as BHT (2,6-di-tert-butyl-p-cresol) and Irgafos 168 (phosphorousacid, tris(2,4-di-ter-butylphenyl) ester), phthalates such as DEP (diethylphthalate) and DIBP (diisobutylphthalate) and UV stabilizers, Chimassorb 81 (2-hydroxy-4-n-octyloxybenzophenone) and Chimassorb 944 (Poly-{6-[1,1,3,3-tetramethylbutyl]-amino]-1,3,5-triazine-2,4-diyl}{2-(2,2,6,6-tetramethylpiperidyl)-amine}). Thus, we could notice the contamination of the attiéké by these substances contained in its packaging bags. Haitao et al. (2015) studies revealed the migration of antioxidant 2,6-di-tert-butyl-p-cresol (BHT) from high-density polythene packaging into food simulant. Miriany et al. (2014) showed the migration of phthalates from plastics to food simulants during microwave cooking. From the above, it would be interesting to study the migration of additives from plastic bags into attiéké. This will involve studying the packaging of the attiéké at different temperatures in the plastic bags used as packaging for the attiéké.
2. MATERIALS AND METHODS
2.1 Equipment
Abstract
Experimental procedures for detecting and quantifying antioxidants, phthalates and UV stabilizers in attiéké are based on the ASTM D 6953-2011 standard and studies conducted by Chengfa et al. (2014), Lahimer et al. (2013) and Kombo et al. (2019).
2.1.1 Study material
The materials studied are plastic bags sold in markets and attiéké (couscous made from fermented cassava).
2.1.2 Apparatus and chemicals
The qualitative and quantitative analysis of additives is carried out by a SCHIMADZU high-performance liquid chromatography chain. This line consists of a TRAY tank, DGU-20A5 degasser, SIL-20A autosampler, LC-20AT pump, CTO-20A oven and SPD-CTO-20A UV-VIS detector. The software used for data acquisition is LC solution. The separation of these 6 substances was done with a C18 column (Supelcosil LC 18, 15cm x 4.6 mm, 5µm). The BHT, DEP and DIBP were purchased from Sigma-Aldrich. Irgafos 168 and Chimassorb 944 were obtained from Ciba Specialty Chemicals. For n-hexane and toluene, they were supplied by Merck. The Chimassorb 81 was purchased from TCI America. Acetonitrile and methanol for HPLC were provided by BDH Laboratory Supplies.
2.2 Methodology
2.2.1 Sampling of plastic bags
The attiéké producers and attiéké sellers in detail from the nine municipalities of the city of Abidjan (Abobo, Adjamé, Attécoubé, Cocody, Koumassi, Marcory, Port-Bouet, Treichville and Yopougon) were investigated (Krabi et al., 2015). A total of 90 people (producers and saleswomen) were surveyed to find out what type of bags they use to package the attiéké. These surveys mainly identified plastic bags from six factories located in the industrial areas of Yopougon and Koumassi. Thus, sampling was about 120 plastic bag samples from these six plants at the rate of 20 bags per plant. Among these six (6) plants, three (3) have the most used bags: plant1, plant2 and plant3.
2.2.2. A sampling of the attiéké
Three-stage cluster sampling of units was used. At the primary level, the cities selected are Dabou, Jacqueville and Abidjan. Located in the south of Côte d'Ivoire, they are known to be the main producers of attiéké. At the secondary level, four municipalities in the city of Abidjan (Abobo, Attécoubé, Cocody and Marcory), 1 village in the city of DABOU and 1 village in the city of JACQUEVILLE. Attiéké production sites constitute the tertiary level (Krabi et al., 2015). Attiéké type 1 “small grain";
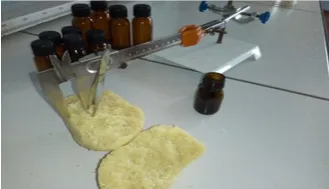
was collected from production sites in Dabou, Jacqueville and Aboboté in the municipality of Abobo. As for the attiéké type 2 “big grain"; called agbodjama, it was collected from production sites in Anono in the commune of Cocody, Anoumambo in the commune of Marcory and Abobodoumé in the commune of Attécoubé. At each site, approximately 200g of attiéké were collected (Figure 1). Samples were taken at 70°C, 60°C, 50°C, 40°C and 30°C. For each temperature, 9 samples were taken and packaged in plastic bags from plant1 (3), plant 2 (3) and plant 3 (3) that produce the most used bags. After each conditioning period (1 hour, 2 hours and 3 hours), using stainless steel pliers, 5 g of attiéké were collected at different levels of attiéké ball depths: at the surface (up to 0.5 cm), at 1 cm and at 1.5 cm (figure 2). A total of 45 attiéké balls were collected from each site and 270 attiéké
balls were collected from all 6 sites. The control consists of the attiéké taken under the same conditions and introduced into a brown glass vial (Kombo et al., 2019).
Figure 1: Attiéké packaged into the plastic bag
2.2.3 Determination of additives
2.2.3.1. Preparation of standard solutions
Ten milligrams of each compound are introduced into 10 mL of methanol to obtain solutions with a concentration of 1000 mg/L. The standard solutions of each substance were prepared by a series of dilutions in acetonitrile at 0.05, 0.1, 0.2, 0.5, 1.0, 2.0, 5.0, 10.0, 20.0, 50.0 and 100.0 mg/L. All its solutions are stored in brown glass vials at 4°C (Bo et al., 2014).
2.2.3.2. Mobile phase
Table 1 records the percentages of the mobile phase A (acetonitrile) and the mobile phase B (water) as a function of the duration of analysis (Gao et al., 2013).
Table 1: Percentages of mobile phases A and B according to the duration of the analyses Time (minutes) Acetonitrile Water
Duration (minutes) Acetonitrile Water
0 65 35
3 65 35
20 95 5
30 95 5
31 65 35
35 65 35
2.2.3.3. Extraction protocol of additives from plastic bags
Two grams of plastic bags are cut into thin strips and placed in an Erlenmeyer. Fifty millilitres of toluene are added. The mixture is heated to about 80°C and stirred manually until the polymer is completely dissolved. A hundred (100) mL of methano l is then introduced to precipitate the polymer (Li et al., 2017). The mixture is filtered twice using a Whattman grade 5 filter paper. The solvent is evaporated using a rotary evaporator at 70°C at 150 rpm (Lahimer et al., 2013). The volume is reduced to the last drop. This drop is then diluted with 1 mL acetonitrile and analyzed by HPLC (Chengfa et al., 2014).
2.2.3.4. Extraction protocol of additives from attiéké
The sample preparation is done according to ASTM D 6953 - 11 with some modifications. In a 125mL flat-bottomed flask, five grams of attiéké are introduced. Then 50 mL of n-hexane is added using a pipette. A magnetic bar is also introduced to homogenize the mixture. To improve extraction, two grams of sodium chloride are also added (Chengfa et al., 2014). The mixture is brought to a boil for one hour in a reflux system. Cooling is done at room temperature by removing the heated magnetic stirrer and holding the reflux device. The mixture is filtered (with Whatman grade 5 filter paper) under vacuum using a Büchner. Ten millilitres of n-hexane are added to the solid residue and filtered (this operation is repeated 3 times). The filtrate is concentrated using a rotary evaporator at a rate of 150 rpm at a temperature of 70°C (Lahimer et al., 2013). The volume is reduced to the last drop and this drop is then diluted with 1 mL acetonitrile and analyzed by HPLC (Chengfa et al., 2014).
2.2.3.5. Chromatographic conditions
A UV detector with a wavelength of 224 nm is used for detection. The flow rate is 1.00 mL/min and the analysis time is 40 minutes. The injection volume is 20µL. All analyses were performed at 30°C under isocratic conditions.
2.2.3.6. Detection limit / Quantification limit
The detection limit and quantification limit of the method are obtained by the signal-to-noise ratio of 3 and 10 times, respectively from the baseline of the blank matrix (CEAEQ, 2013). The blank matrix was prepared from the peeled cassava tubers, washed in distilled water and then crushed with a pestle and porcelain mortar. This matrix is processed according to the
attiéké additive extraction protocol described above. Detection and quantification limits are recorded in Table 2 (Kombo et al., 2019).
Table 2: Limit of detection (LOD) and limit of quantification (LOQ) of the different compounds
Compounds LOD (mg/Kg) LOQ (mg/Kg)
BHT 0.32 1
Irgafos 168 0.7 2.1
DEP 0.35 1.1
DIBP 0.06 0.18
Chimassorb 81 0.43 1.3
Chimassorb 944 0.82 2.5
2.2.3.7. Linearity
Table 3 : The model equation, the determination coefficient (R2) and the linearity range of the different compounds Compounds Compounds Model equation (y is the concentration in mg/L and x the peak area
in area units) R
2 Linearity range
(mg/L)
BHT y = 0.822699596011649+1.19592678718014x10-2x 0.9975 1.0 – 100.0
Irgafos 168 y = -0.490609398053458+1.81395998477025x10-2x 0.999 2.0 – 100.0
DEP y = 0.377747863732544+2.46646299321994x10-2x 0.9992 0.1 – 100.0
DIBP y = -0.963896971408552+1.65718898455463x10-2x 0.9992 0.2 – 100.0
Chimassorb 81 y = -0.242388605780558+1.40142106737983x10-2x 0.9985 1.0 – 100.0
Chimassorb
944 y = -0.241252050458893+5.27974981711409x10
-2
x 0.9984 2.0 – 100.0
2.2.3.8. Correlation test of different additives
The correlation test makes it possible to demonstrate a dependence between the various additives.
3. RESULTS
The chromatogram of the standard solutions obtained under the operating conditions described is shown in Figure 3, which clearly distinguishes the retention times of the different compounds. Besides, the injection of n-hexane did not give any peak to the retention time of the desired compounds, which shows the absence of memory effect.
Figure: 3 Chromatogram of the different compounds at 10 mg/L
3.1. Analysis of antioxidants, phthalates and UV absorbers in plastic bags
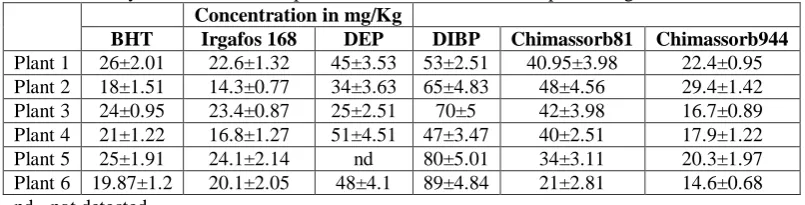
Except DEP, which is absent in the sample from plant 5, all other dosed additives are present in all samples from the different plants. Indeed:
- the concentration of BHT is high in the bag samples from plants 1, 3 and 5 and low in those from plant 2; - The concentration of Irgafos 168 is high in the bag samples from plants 3 and 5 and low in those from plants 2 and 4; - The lowest average concentration of DEP (23 mg/Kg) is that of bags from Plant 3 and the highest is that of bags from Plant 4 (51 mg/Kg);
- The lowest average concentration of DIBP (47 mg/Kg) is that of bags from plant 4, while the highest (89mg/Kg) is that of plant 6;
- The concentrations of Chimassorb 81 and Chimassorb 944 are low in the bags of plant 6 while those of plant 2 has higher contents.
All its values are indicated below in Table 4.
Table 4: Analysis of antioxidants, phthalates and UV absorbers in plastic bags
Concentration in mg/Kg
BHT Irgafos 168 DEP DIBP Chimassorb81 Chimassorb944
Plant 1 26±2.01 22.6±1.32 45±3.53 53±2.51 40.95±3.98 22.4±0.95
Plant 2 18±1.51 14.3±0.77 34±3.63 65±4.83 48±4.56 29.4±1.42
Plant 3 24±0.95 23.4±0.87 25±2.51 70±5 42±3.98 16.7±0.89
Plant 4 21±1.22 16.8±1.27 51±4.51 47±3.47 40±2.51 17.9±1.22
Plant 5 25±1.91 24.1±2.14 nd 80±5.01 34±3.11 20.3±1.97
Plant 6 19.87±1.2 20.1±2.05 48±4.1 89±4.84 21±2.81 14.6±0.68
3.2. Analysis of antioxidants, phthalates and UV absorbers in control attiéké
The additives analysed in the control attiéké gave the results reported in Table 5. BHT, Irgafos 168, Chimassorb 81 and Chimassorb 944 were not detected. However, DEP and DIBP have been identified and quantified. The mean values of the different DEP and DIBP results vary between 1.185 and 2.444 mg/Kg and between 0.18 and 2.1 mg/Kg respectively. The highest concentration of DEP was obtained with the Aboboté attiéké while the Dabou attiéké had the lowest level. As for DIBP, the lowest level was obtained with Jacqueville's attiéké and the highest with Abobodoumé's attiéké.
Table 5: Concentration of the different substances in the control attiéké
The concentration of compounds ± standard deviation (mg/Kg)
Additives DABOU JACQUEVILLE ABOBOTE ANONO ABOBODOUME ANOUMAMBO
BHT nd nd nd nd nd nd
Irgafos 168 nd nd nd nd nd nd
DEP 1.185 ±0.167 1.265 ± 0.146 2.444 ± 0.466 1.5 ± 0.209 1.79 ± 0.147 1.4 ± 0.221
DIBP 0.97 ± 0.217 0.18 ± 0.03 1.678 ± 0.2 0.766±0.92 2.1 ± 0.61 1.92 ± 0.32
Chimassorb81 nd nd nd nd nd nd
Chimassorb944 nd nd nd nd nd nd
3.3. Analysis of antioxidants, phthalates and UV absorbers in attiéké packaged in plastic bags
Overall, the concentrations of the additives decrease from the surface to inside the attiéké ball. However, they increase according to packaging time duration and temperature.
3.3.1. Analysis of bag additives in attiéké at 70°C
At a temperature of 70°C, the highest average BHT concentration is 3.46 mg/Kg on the surface of the attiéké ball after 3 hours of conditioning, while inside the ball (at 1.5 cm), after one hour, the concentration is the lowest (1.21 mg/Kg). Irgafos168, DEP, DIBP, Chimassorb 81 and Chimassorb 944 have average concentrations of 5.22, 2.71, 2.03, 4.4 and 5.07mg/Kg respectively on the surface of the attiéké ball after 3 hours of conditioning. At this level, concentrations are the highest while after 1 hour of conditioning, at 1.5 cm from the surface of the ball, the lowest values are observed. All these values are mentioned in Table 6.
Table 6: Analysis of additives in attiéké packaged in plastic bags at 70°C
Additives in mg/Kg
Duration Position BHT Irgafos168 DEP DIBP Chimassorb81 Chimassorb944
1h
0.5 cm 3.22 ± 0.29 4.71 ± 0.87 2.6 ± 0.52 2 ± 0.69 3.98 ± 0.75 4.68 ± 0.88 1 cm 1.84 ± 0.31 3.2 ± 0.54 2.28 ± 0.42 1.58 ± 0.66 1.87 ± 0.49 2.83 ± 0.33 1.5 cm 1.21 ± 0.09 2.11 ± 0.01 1.87 ± 0.38 1.43 ± 0.64 1.28 ± 0.05 nd
2h
0.5 cm 3.38 ± 0.32 5.12 ± 0.94 2.65 ± 0.52 2.02 ± 0.72 4.28 ± 0.71 4.94 ± 0.76 1 cm 1.98 ± 0.29 3.17 ± 0.71 2.33 ± 0.42 1.65± 0.68 1.99 ± 0.6 2.98 ± 0.47 1.5 cm 1.26 ± 0.06 2.15 ± 0.05 1.9 ± 0.38 1.46 ± 0.64 1.31 ± 0.05 nd
3h
0.5 cm 3.46 ± 0.31 5.22 ± 0.97 2.71 ± 0.52 2.03 ± 0.72 4.4 ± 0.73 5.07 ± 0.77 1 cm 2.04 ± 0.3 3.25 ± 0.76 2.36 ± 0.42 1.65 ± 0.7 2.07 ± 0.66 2.93 ± 0.46 1.5 cm 1.34 ± 0.13 2.26 ± 0.31 1.93 ± 0.38 1.49 ± 0.65 1.34 ± 0.05 nd
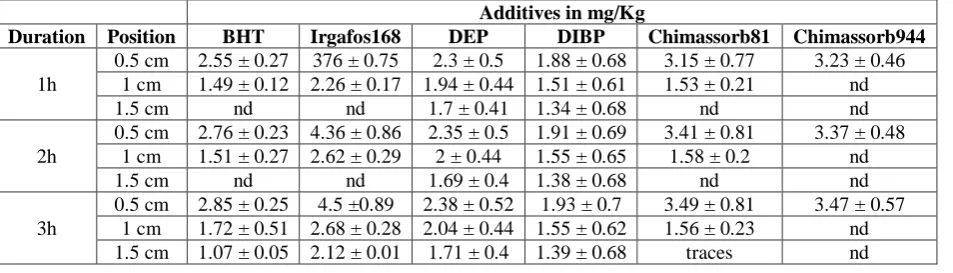
3.3.2. Analysis of bag additives in attiéké at 60°C
At 60°C the BHT concentration increases to 2.85 mg/Kg on the surface of the attiéké ball after 3 hours of conditioning while inside the ball (at 1.5 cm), the increase is only 1.07 mg/Kg. Irgafos168, DEP, DIBP, Chimassorb 81 and Chimassorb 944 reach the respective concentrations 4.5, 2.38, 1.93, 3.4 and 3.47 on the surface of the attiéké ball after 3 hours of conditioning. The lowest values are those obtained after 1h of conditioning at 1.5 cm from the surface of the ball. All these values are recorded in Table 7.
Table 7: Analysis of additives in attiéké packaged in plastic bags at 60°C
Additives in mg/Kg
Duration Position BHT Irgafos168 DEP DIBP Chimassorb81 Chimassorb944
1h
0.5 cm 2.55 ± 0.27 376 ± 0.75 2.3 ± 0.5 1.88 ± 0.68 3.15 ± 0.77 3.23 ± 0.46 1 cm 1.49 ± 0.12 2.26 ± 0.17 1.94 ± 0.44 1.51 ± 0.61 1.53 ± 0.21 nd
1.5 cm nd nd 1.7 ± 0.41 1.34 ± 0.68 nd nd
2h
0.5 cm 2.76 ± 0.23 4.36 ± 0.86 2.35 ± 0.5 1.91 ± 0.69 3.41 ± 0.81 3.37 ± 0.48
1 cm 1.51 ± 0.27 2.62 ± 0.29 2 ± 0.44 1.55 ± 0.65 1.58 ± 0.2 nd
1.5 cm nd nd 1.69 ± 0.4 1.38 ± 0.68 nd nd
3h
0.5 cm 2.85 ± 0.25 4.5 ±0.89 2.38 ± 0.52 1.93 ± 0.7 3.49 ± 0.81 3.47 ± 0.57 1 cm 1.72 ± 0.51 2.68 ± 0.28 2.04 ± 0.44 1.55 ± 0.62 1.56 ± 0.23 nd
3.3.3. Analysis of bag additives in attiéké at 50°C
At 50°C, at a distance of 1.5 cm from the surface of the attiéké ball, until 2 hours, BHT, Irgafos 168, Chimassorb 81 and Chimassorb 944 are not detected in the attiéké. However, after a conditioning time of 3 hours, these additives are quantified. Table 8 shows that the highest concentrations of additives are obtained on the surface of the ball after 3 hours of conditioning while the lowest concentrations are obtained after one hour at 1.5 cm inside the attiéké ball.
Table 8: Analysis of additives in attiéké packaged in plastic bags at 50°C.
Additives in mg/Kg
Duration Position BHT Irgafos168 DEP DIBP Chimassorb81 Chimassorb944
1h
0.5 cm 1.82 ± 0.43 2.78 ± 0.41 208 ± 0.46 1.72 ± 0.64 2.08 ± 0.62 2.57 ± 0.08
1 cm Traces 2.11 ± 0.01 1.7 ± 0.41 1.37 ± 0.65 nd nd
1.5 cm nd nd 1.61 ± 1.29 1.29 ± 0.67 nd nd
2h
0.5 cm 1.87 ± 0.44 2.5 ± 0.57 2.11 ± 0.49 1.78 ± 0.65 2.22 ± 0.65 2.59 ± 0.09
1 cm 1.03 ± 0.05 2.13 ± 0.05 1.73 ± 0.42 1.38 ± 0.65 1.38 ± 0.1 nd
1.5 cm nd nd 1.6 ± 0.45 1.29 ± 0.67 nd nd
3h
0.5 cm 1.91 ± 0.44 3 ± 0.58 2.12 ± 0.51 1.79 ± 0.67 2.31 ± 0.75 2.61 ± 0.11
1 cm 1.08 ± 0.03 2.15 ± 0.06 1.75 ± 0.43 1.4 ± 0.66 1.41 ± 0.12 nd
1.5 cm nd traces 1.62 ± 0.43 1.3 ± 0.67 traces nd
3.3.4. Analysis of bag additives in attiéké at 40°C
Table 9 shows at 40°C, BHT, Irgafos 168 and Chimassorb 81 is only detected at the surface of the attiéké ball regardless of the weather. Chimassorb 944 is present at the surface after 2 hours of conditioning. The highest concentrations for BHT, Irgafos 168, Chimassorb 81 and Chimassorb 944 are 1.43, 2.23, 2.64 and 2.63 mg/Kg respectively after three hours of conditioning. As for the DEP and DIBP, they have average concentrations that increase very slightly (respectively from 1.66 to 1. 68 mg/Kg and from 1.32 to 1.34 mg/Kg) on the surface of the attiéké ball from 1h to 3h.
Table 9: Analysis of additives in attiéké packaged in plastic bags at 40°C
Additives in mg/Kg
Duration Position BHT Irgafos168 DEP DIBP Chimassorb81 Chimassorb944
1h
0.5 cm 1.33 ± 0.22 2,12 ± 0,02 1.66 ± 0.42 1.32 ± 0.71 1.54 ± 0.2 2,55 ± 0,05
1 cm nd nd 1.6 ± 0.44 1.27 ± 0.7 nd nd
1.5 cm nd nd 1.6 ± 0.44 1.27 ± 0.7 nd nd
2h
0.5 cm 1.39 ± 0.22 2.21 ± 0.25 1.67 ± 0.42 1.33 ± 0.69 1.65 ± 0.27 2.63 ± 0.09
1 cm nd nd 1.6 ± 0.44 1.27 ± 0.7 nd nd
1.5 cm nd nd 1.6 ± 0.44 1.27 ± 0.7 nd nd
3h
0.5 cm 1.43 ± 0.24 1.68 ± 0.42 1.34 ± 0.69 1.68 ± 0.42 2.64 ± 0.11 nd
1 cm nd nd 1.6 ± 0.44 1.27 ± 0.7 nd nd
1.5 cm nd nd 1.6 ± 0.44 1.27 ± 0.7 nd nd
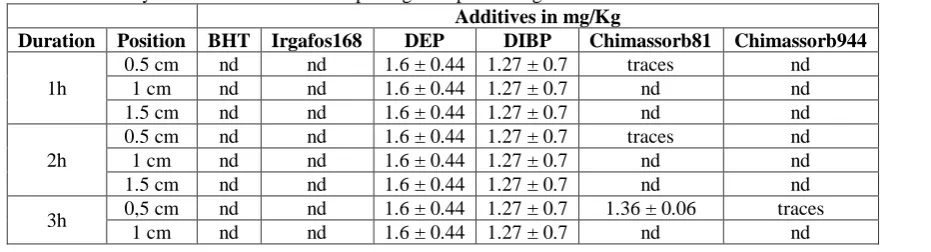
3.3.5. Analysis of bag additives in attiéké at 30°C
Table 10 shows that at 30°C, generally, only the DEP and DIBP are present in the attiéké ball from the surface to the interior. Concentrations remain constant whatever the position of sampling of the attiéké sample and packaging time length. It is 1.6 ± 0.44 mg/Kg for DEP and 1.27 ± 0.7 mg/Kg for DIBP.
Table 10: Analysis of additives in attiéké packaged in plastic bags at 30°C
Additives in mg/Kg
Duration Position BHT Irgafos168 DEP DIBP Chimassorb81 Chimassorb944
1h
0.5 cm nd nd 1.6 ± 0.44 1.27 ± 0.7 traces nd
1 cm nd nd 1.6 ± 0.44 1.27 ± 0.7 nd nd
1.5 cm nd nd 1.6 ± 0.44 1.27 ± 0.7 nd nd
2h
0.5 cm nd nd 1.6 ± 0.44 1.27 ± 0.7 traces nd
1 cm nd nd 1.6 ± 0.44 1.27 ± 0.7 nd nd
1.5 cm nd nd 1.6 ± 0.44 1.27 ± 0.7 nd nd
3h 0,5 cm nd nd 1.6 ± 0.44 1.27 ± 0.7 1.36 ± 0.06 traces
1 cm nd nd 1.6 ± 0.44 1.27 ± 0.7 nd nd
3.4. Correlation test of the different plastic bag additives
(0.7138).
Table 11: Correlation matrix of the different additives in plastic bags
BHT Irgafos 168 DEP DIBP Chimassorb81 Chimassorb944
BHT 1
Irgafos 168 0.8815 1
DEP -0.4038 -0.5135 1
DIBP -0.1214 0.3333 -0.4294 1
Chimassorb81 0.0180 -0.3262 -0.0805 -0.6963 1
Chimassorb944 -0.2466 -0.4963 -0.1291 -0.3246 0.7138 1
4. DISCUSSION
Antioxidants (BHT and Irgafos168), phthalates (DEP and DIBP) and UV stabilizers (Chimassorb 81 and Chimassorb 944) were detected and quantified in the plastic bags because these chemical compounds are additives used in the formulation of the plastic bags. In fact, Irgafos 168 and BHT are thermal antioxidants that are added to plastic polymers to protect them from thermo-oxidation during manufacturing. The correlation coefficient determined between BHT and Irgafos168 (0.8815) confirms the simultaneous use of these two thermal antioxidants. As for plasticisers (DEP and DIBP), their role is to soften plastic polymers (Bhunia et al., 2013). In order to stabilize polymers against UV rays from the sun. Chimassorb 81 is often associated with HALS (Hindered-Amine Light Stabilizers) (Cristofoli and al., 2012). According to Cheloufi et al. (2014), the simultaneous incorporation of Chimassorb 81 and Chimassorb 944 even at low doses (0.1%) increases the crystallinity rate of low-density polyethylene by 34.03%. This feature further improves the physicochemical properties of the polymer. This relationship is confirmed by the correlation coefficient (0.7138) between these two substances. The average concentrations of BHT determined in plastic bags vary between 18 and 26 mg/Kg, those of Irgafos 168 between 14.3 and 24.1 mg/Kg and those of Chimassorb 81 between 21 and 48 mg/Kg. Li et al. (2017) did not detect BHT in polypropylene bags in China; this could be due to the use of another primary antioxidant in the formulation. However, they determined Irgafos 168 at mean concentrations between 166.47 mg/Kg and 845.27 mg/Kg, higher than those determined in this study. For Chimassorb 81, the average values determined are higher than those of Li
et al. (2017) (5.08 mg/Kg) but lower than those of Gillet (2008) in the industrial formulation of high density polyethylene (668 mg/Kg). Chimassorb 944 in plastic bags was quantified at average concentrations ranging from 14.6 to 29.4 mg/Kg. These concentrations are much lower than Gillet (2008) formulation, which averaged 3327 mg/Kg in high-density polyethylene films. All these differences can be explained by the difference in formulation for the manufacture of finished products and also by the nature of the raw materials used. The highest determined DEP concentration is 51 mg/Kg. This concentration is high compared to that found in low-density polyethylene and high-density polyethylene bags in Ghana by Ayamba (2015).
Indeed, this author determined the presence of other phthalates in these plastic bags such as DEHP (diethylhexylphthalate) and DBP (dibutylphthalate) at average concentrations of 5.84 mg/Kg and 9.94 mg/Kg respectively. This could justify the differences between the different values. The average concentrations of DIBP, which range from 14.6 to 29.4 mg/Kg in the stud y bags, are significantly lower than those determined in soft polyvinyl chlorides (PVC) (between 16000 and 354000 mg/Kg) (Nilsson et al., 2016). This difference is normal because the concentrations of phthalates are much higher in PVC than in polyethylene bags (Nilsson and al., 2016).
With the exception of DEP and DIBP which were quantified in the control attiéké (not packaged in plastic bags), all other substances were not detected. Indeed, phthalates, although synthetic, are used in several fields (cosmetics, plastics, paints, inks, medicines, school materials, etc.). As a result, they have become ubiquitous. The contamination was certainly made during some stages of the attiéké manufacturing process such as storage for two to three days in jute bags, spin drying in nylon bags, drying on plastic bags. . . (Yéboué et al., 2017; Kombo et al. , 2019).
The migration rate of BHT was highest in the parts in contact between the bag and the attiéké at 70°C after 3 hours of conditioning (3.46 mg/Kg). This migration situation is similar to that found by Alavi et al. (2015) in the migration of BHT from plastic bags to soybean oil. In this study by Alavi et al. (2015), the BHT level reached 42 mg/L after 15 minutes in a 100 Watt microwave oven. As for Irgafos 168, after 1 hour of conditioning at 70°C, the migration rate was on average 4.71 mg/Kg on the surface of the attiéké ball. This migration situation of irgafos 168 at a certain temperature was also observed to some extent in the study by Alavi et al (2015); the rate of Irgafos 168 migrating after only 2 minutes of contact with olive oil in a 100 Watts microwave oven was 27 mg/L. The values determined by these authors in 2015 are higher than those in this study because the temperature is certainly higher in the microwave oven and the migration is more pronounced in fats (Hadjmohammadi et al, 2012). Attiéké, on the other hand, is a low-fat commodity (0.64%) (Yeboué et al., 2017). At 40°C, low migration rates are observed at the contact surface between the bags and the attiéké ball. GAO et al. (2011) have shown that BHT migrates from plastic bags to aqueous simulants and also to fat at 40°C for 10 days.
concentration of DIBP in the plastic polymer, the stiffness of the bottle compared to the plastic bags and also the acidity of the
attiéké. In addition, low-density polythene is a plastic polymer with the highest diffusion capacity (Bott et al., 2014).
Chimassorb 81 migrated up to 4.28 mg/Kg at 70°C into the attiéké after 2 hours of time in the part in contact with the bag. However, after the same contact time, the migration rate of this additive to olive oil at 175°C was 7.6 mg/Kg in the terephthalate polythene (TEP) contact area (Begley et al., 2005). The higher concentration of Chimassorb 81 found by Begley et al., (2005) can be explained by the higher temperature (175°C).
Chimassorb 944 hardly migrates inside the attiéké ball; this could be due to its structure (steric clutter) (BASF, 2016) and its large size (Regina et al., 2009). According to Dopico-Garcia et al. (2012), low molecular weight HALS diffuse faster than the high molecular weight HALS to which Chimassorb 944 belongs; hence their preferred use by industry. At 30°C, the migration of all the additives analysed is almost nil under the condit ions of the study. On the whole, concentrations increase according to packaging duration and temperature. However, they decrease from the surface to inside the attiéké ball. Similar trends were observed by Musoke et al. (2015), when studying the migration of chemical contaminants from polythene plastic bags into “posho” flower corn meal-based food during cooking. Haitao et al. (2015) also demonstrated that the migration rate of compounds changes in the same direction as temperature and time packaging.
CONCLUSION
The quantitative analysis of antioxidants, plasticizers and UV stabilizers by HPLC allowed to determine the concentrations of additives that migrated from plastic bags to attiéké. From 40°C to 70°C, migration is much more marked at the contact surface between the attiéké ball and the plastic bag. And this migration evolves in the same way as the temperature and conditioning time. At 30°C, migration is almost zero for all substances analyzed. From the results, it is clear that pollutants migrate from plastic bags to attiéké and this migration is much more pronounced when the temperature is high. Until an alternative to the current plastic bags is found, to limit the migration of additives and to protect the population from health risks, attiéké producers should pack this product at temperatures below 40°C and consumers should remove the surface layer.
REFERENCES
Alavi Sajid, Thomas Sabu, Sandeep K. P., Kalarikkal Nandakumar, Varghese Jini and Yaragalla Srinivasarao, 2014. Polymer for packaging applications, CRC Press, 467p.
ASTM Standards D 6953, 2011. Standard test method for determination of phenolic antioxidants in high density polyethylene using liquid chromatography, 7p.
Ayamba Adongo Abdul-Malik, 2015. Assessment of phthalates migration in polyethylene food packages: a case study in Ghana. THESIS, UNIVERSITY OF GHANA, 114p.
BASF, 2016. Safety data sheet: Chimassorb 944 FDL, 8p.
Basma Raad Shakir, Suha Mohamed Ibrahim and Ahmed Ibrahim Jessim, 2015. Detection and determination of Butylated Hydroxyl Toluene (BHT) in imported milk for adults and infants at Baghdad city. International Journal of Advanced research, 3(4): 1178-1185.
Begley T., Castle L., Feigenbaum A., Franz R., Hinrichs K., Lickly T., Mercea P., Milana M., O’Brien a., Rebre S., Rijk R. and Piringer O., 2005. Evaluation of migration models that might be used in support of regulations for food-contact plastics, Food Additives and Contaminants, 22(1):73-90.
Bhunia Kanishka, Sablani Shyam S., Tang Juming and Rasco Barbara, 2013. Migration of chemical compounds from packaging polymers during microwave, conventional heat treatment, and storage. Institute of Food Technologists. 12: 523-545.
Bo Li, Zhi-Wei Wang, Qin-Bao Lin, Chang-Ying Hu, Qi-Zhi Su and Yu-Mei Wu, 2014. Determination of polymer additives-antioxidants, ultraviolet stabilizers, plasticizers and photoinitiators in plastic food package by accelerated solvent extraction coupled with High-Performance Liquid Chromatography. Journal of Chromatographic. 53: 1026-1035.
Bott Johannes, Störmer Angela and Franz Roland, 2014. Migration of nanoparticles from plastic packaging materials containing carbon black into foodstuffs. Food Additives & Contaminants: Part A, 31(10) : 1769-1782.
CEAEQ (Centre D’expertise En Analyse Environnementale Du Quebec), 2015. Protocole pour la validation d’une méthode d’analyse en chimie. DR-12-VMC. Quebec, Ministère du Développement durable, de l’Environnement et de la lutte contre le changement climatique, 29p.
Chengfa Li, Ying Li, Zhinan Chen, Feng Lian, Xuhui Chen, Shaojing Wu, Yongtao Li and Xiaoying Sun, 2014. Simultaneous determination of antioxidants and ultraviolet absorbers by ultra-performance liquid chromatography in food stimulants. Food anal. Methods, 7: 1755-1762.
Cristofoli Kelen, Brandalise N., Rosmary and Zeni Mara, 2012. Phostabilized LDPE films with UV absorber and HALS as protection against the light for rosé sparkling wine. Food processing and technology, 3(7), 7p.
Dopico-Garcia M. Sonia, Noguerol-Cal Rosalia, Castro-Lopez M. Mar, Cela-Perez M. Concepcion, Piñon-Giz Elena, Lopez-Vilariño Jose M., Gonzalez-Rodriguez M. Victoria, 2012. Determination of polyolefin additives by reversed-phase liquid chromatography. Central European Journal of Chemistry, 10 (3) : 585-610.
Gao Y., Gu Y. and Xei Y., 2011. Determination of polymer coumpouds-antioxidants and ultraviolet (UV) absorbers by High-Performance Liquid Chromatography coupled with UV photodiode array detection in food simulants. J. Agric. Food, Chem,
Gao Xin, Yang Bofeng, Tang Zhixu, Luo Xin, Wang Fengmei, Xu Hui and Cai Xue, 2013. Determination of phthalates released from paper packaging materials by solid-phase Extraction–High-Performance Liquid Chromatography. Journal of Chromatographic Science, 52: 383-389.
Gillet Guillaume, 2008. Prévision de la conformité des matériaux d’emballage par integration de méthodes de déformulation et de modélisation du coefficient de partage. Thèse de l’Institut National Polytechnique de Lorraine, 247p.
Greta Stieger, 2018. Mathematical modeling of chemical migration from food packaging into food is mainly applicable to plastic materials; useful tool for regulatory compliance testing, risk assessment, safe packaging design, estimating consumer exposure; new approaches for other food contact materials needed. Food Packaging and Health, 9p.
Hadjmohammadi M. R., Ehsani M., Kamel K. and Biparva P.,2012. Application of experimental design for extraction of BHA and BHT from edible vegetable oil and their determination using HPLC, Qscience Connect, 10p.
Haitao Chi, Ying Liu, Xia Gao, Weili Liu and Yunjun Luo, 2015. Research article antioxidant BHT modelling migration from food packaging of high density polyethylene plastics into the food stimulant. Advance Journal of Food Science and Technology, 9(7): 534-538.
Hannas B. R., Lambright C. S., Furr J., Howdeshell K. L., Wilson V. S. and Gray Le J. R., 2011. Dose-response assessment of fetal testosterone production and gene expression levels in rat testes following in utero exposure to diethylhexyl phthalate, diisobutyl phthalate, diisoheptyl phthalate and diisononyl phthalate. Toxicol Sci., 123(1): 206-216.
Kombo Mananga Olivier Simon, Gnagne Agnes Essoh Jean Eudes Yves, Ahoule Dompe Ghislain Maxime and Yapo Ossey Bernard, 2019. Method of determination of antioxidants, phthalates and ultraviolet absorbers in attiéké “Couscous from fermented cassava” before its storage. Journal of Chemical, Biological and Physical Science, 9(2): 269-280.
Krabi Ekoua Regina, Assamoi Allah Antoine, Ehon Ayawovi Fafadzi, Niamké Lamine Sébastien et Thonart Philippe, 2015. Production d’attiéké (couscous à base de manioc fermenté) dans la ville d’Abidjan. European scientific journal, 11(15): 1857-7431.
Li B., Wang Z. W., Lin Q. B. and Hu C. Y., 2017. Simultaneous determination of antioxidants and ultraviolet stabilizers in polypropylene food packaging and food simulants by high-performance liquid chromatography, acta chromatographica, 29(2):173-192.
Lopez-Carillo Lizbeth, Hernandez-Ramirez Raul U., Calafat Antonia M., Torres-Sanchez Luisa, Galvan-Portillo Marcia, Needham Larry L., Ruiz-Ramos Ruben and Cebrian Mariano E., 2010. Exposure to phthalates and breast cancer risk in Northen Mexico. Environmental Health Perspective, 118: 539-544.
Musoke L., Banadda N., Sempala C. and Kigozi J.,2015. The migration of chemical contaminants from polyéthylène bags into food during cooking. The Open Food Science Journal, 9: 14-18.
Miriany A. Moreira, Leiliane C. André and Zenilda L. Cardeal, 2014. Analysis of phthalate migration to food simulants in plastic containers during microwave operations. Int. J. Environ. Res. Public Health,11: 507-526.
Nilsson Nils H., Schjøth-Eskesen Jeanette, Malmgren-Hansen Bjørn and Jacobsen Eva,2016. Determination of migration rates for certain phthalates, The Danish Environmental Protection Agency, 67p.
Regina Maria Calheiros, Alves Ribeiro E Silva, 2009. Mathematical modelling of migration of substances from plastic packaging materials to food using computer software – AKTS. Evaluation models and forecasting food risks. Instituto SuperiorTechnico, 11p.
Simoneau C., Eede L. V. D. and Valzacchi S., 2011. Identification and quantification of the migration chemicals from plastic babby bottles used as substitutes for polycarbonates. Food Addit. Contam. : PartA, 29(3) : 469-480.
Tranfo G., Caporossi L., Paci E., Aragona C., Romanzi D., De Carolis C., De Rosa M., Capanna S., Papaleo B. and Pera A., 2011. Urinary phthalate monoesters concentration in couples with infertility problems. Toxicol Letters, 213(1): 15-20.
Varuna p. Panicker, Sisilama George and Dhanush Krishna B., 2014. Toxicity study of butylated hydroxyl toluene (BHT) in rats.
World Journal of Pharmacy and Pharmaceutical Science, 3(8): 758-763.
Yang Chun Z., Yaniger Stuart I., Jordan V. Craig, Klein Daniel J. and Bittner George D., 2011. Most Plastic Products Release Estrogenic Chemicals: A Potential Health Problem that Can Be Solved. Environmental health perspective, 119(7): 989-996. Yeboue K. H., Amoikon K. E., Kouame K. G. et Kati-Coulibaly s., 2017. Valeur nutritive et propriétés organoleptiques de