1MSc Student, Department of Health, Safety and Environment, Faculty of Engineering, Islamic Azad University, Central Tehran Branch, Tehran, Iran• 2Assistant Professor, Department of Environmental Engineering, Central Tehran Branch, Islamic Azad University, Tehran, Iran• 3Professor, Department of Occupational Health Engineering, Occupational Safety and Health Research Institute, School of Health, Hamadan University of Medical Sciences, Hamadan, Iran• *Corresponding Author: Hasti Borgheipour, Email: [email protected], Tel: +98-912-1948440
Abstract
Background:Methods:
Results:
Conclusions:
Keywords:
Introduction
The Effect of Behavior–based Safety Interventions
.
The Effect of Behavior–based Safety Interventions
Methods
Results
.
.
The Effect of Behavior–based Safety Interventions
Table 2. Highest frequency percentage of unsafe behaviors in the second step Unsafe Behavior percentage All unsafe behaviors Total observed behaviors
non-use or inappropriate use of
personal protective equipment 32.75% 5.60% carrying overloaded goods 23.39% 4.00%
inappropriate postures 9.36% 1.60%
Table 3.Highest and lowest frequency percentage of general characteristics of the staff
general characteristics Frequency Percentage
Age 30-40 years Less than 20 years 438 6 43.8 0.6 Marital
status
Single 452 45.2
Married 548 54.8
Education Under diploma Bachelor and higher 51239 51.2 3.9 Working
experience
1-5 years 580 58
More than 20 years 6 0.6
Working shift Morning Night 639 361 63.9 36.1
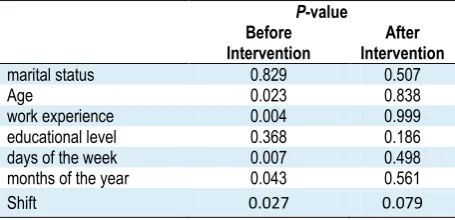
Table 4.Relationship between unsafe behaviors and demographic characteristics P-value Before Intervention After Intervention
marital status 0.829 0.507
Age 0.023 0.838
work experience 0.004 0.999
educational level 0.368 0.186
days of the week 0.007 0.498
months of the year 0.043 0.561
Shift 020.0 02000
P-value > 0.05
>
The Effect of Behavior–based Safety Interventions
Conclusion
Conflict of interest
Acknowledgment
http://www.ilo.org/global/topics/safety-and-health-at-work/lang--en/index.htm. 2017.
5.Eurostat. Available at: URL: http://appsso.eurostat.ec.europa.eu/ nui/show.do? dataset=hsw_n2_01&lang=en. 2017.
6.Jasiulewicz-Kaczmarek M, Szwedzka K, Szczuka M. Behaviour based intervention for occupational safety–case study. Procedia manufacturing. 2015;3:4876-83.
7.Alkhaldi M, Pathirage C, Kulatunga U. The role of human error in accidents within oil and gas industry in Bahrain. [POSTER] at: Proceeding of the 13th International Postgraduate Research Conference (IPGRC): Conference Proceedings; 2017Sep.14-15; University of Salford., UK: Salford: University of Salford; 2017. 8.Guo BH, Yiu TW, González VA. Predicting safety behavior in the
construction industry: Development and test of an integrative model. Safety science. 2016;84:1-11.
9.Heinrich HW. Industrial Accident Prevention: A Scientific Approach. 2nd ed. New York & London : McGraw-Hill Book Company, Inc; 1941.
10. Toppazzini MA, Wiener KKK. Making workplaces safer: The influence of organisational climate and individual differences on safety behaviour. Heliyon. 2017;3(6):e00334.
11. Clancy J. Behaviour-Based Safety: A Case Study Illustrating A Successful Approach. QEST Consulting Group; 2016.
12. Dekker SWA. Reconstructing human contributions to accidents: the new view on error and performance. Safety research. 2002;33(3):371-85.
13. HSE. Health and Safety Executive. Available at: URL: http://www.hse.gov.uk/treework/training-is important.htm. 2017. 14. Choudhry RM, Fang D. Why operatives engage in unsafe work
behavior: Investigating factors on construction sites. Safety science. 2008;46(4):566-84.
and the related factors by using the method of time series. International journal of occupational hygiene. 2016;8(4):200-7. 20. Mohammadi Zeidi I, Pakpor AH, Mohammadi Zeidi B. The
effect of an educational intervention based on the theory of planned behavior to improve safety climate. Iran occupational health. 2013;9(4).[Persian]
21. Kaila HL. Behaviour based safety in organizations. Indian journal of occupational and environmental medicine. 2006;10(3):102.
22. Li SY, Cox AL, Or C, Blandford A. Effects of monetary reward and punishment on information checking behaviour. Applied ergonomics. 2016;53:258-66.
23. Kiani F, Samavtyan H, Poorabdiyan S, Jafari E. How safety trainings decrease perceived job stress: the effects of improvement in employees attitude toward safety issues. Far east journal of psychology and business. 2012;6(4):46-58.
24. Raouf A, Dhillon BS. Safety assessment: A quantitative approach. Boca Raton: Lewis Publishers; 1994.
25. Wang Y, Tian M, Wang D, Zhao Q, Shan S, Lin S. Study on the HSE management at construction site of oil and gas processing area. Procedia engineering. 2012;45:231-4.
26. Stride CB, Turner N, Hershcovis MS, Reich TC, Clegg CW, Murphy P. Negative safety events as correlates of work-safety tension. Safety science. 2013;53:45-50.
Khaleghinejad A, Ziaaldini M. Relationship between employees' safety climate and safety performance with respect to mediating effect of safety knowledge and safety motivation in Sarcheshmeh copper complex. Health and safety at work. 2015;5(4):69-86.[Persian]