SUGARCANE BAGASSE AND MODIFIED RICE HUSK FOR THE
REMOVAL OF MALACHITE GREEN FROM AQUEOUS
WASTES
Hamid Dezhampanah
[a]*Amineh Mousazadeh
[a]and Issa Mousazadeh
[b]Keywords: malachite green; isotherm; kinetics; rice husk; sugarcane bagasse.
Adsorption of malachite green (MG) using sugarcane bagasse (SB) and rice husk (RH) were studied by batch method. Factors influencing dye adsorption such as the initial dye concentration, sorbent dosage, exposure time, temperature effect and pH, were investigated. The Langmuir, Freundich-Temkin and Dubinin–Radushkevich (D-R) isotherms were used to fit the equilibrium data, and the results showed that the Freundlich and Langmuir model provided the best correlation of the experimental data for SB and RH, respectively. Adsorption kinetic data were tasted using first-order, second-order and intra particle diffusion models. It was observed that the pseudo-second-order kinetic equation could explain the biosorption kinetics of dye on both adsorbents and intra particle diffusion showed that dye adsorption was controlled by multi-adsorption stages with bagasse surface area. The results showed that both of them can be an economical sorbent for removal of dye from aqueous systems.
* Corresponding Authors: Hamid Dezhampanah Fax: + 98-131-3233262
E-Mail: [email protected]
[a] Laboratory of physical Chemistry, Department of Chemistry, Faculty of Science, University of Guilan P.O. Box 1914, Rasht 0098, Iran.
[b] Shahid Rajaei Technical and Vocational University, Tarbiat moallem Ave. lahijan, Guilan, Iran. Postal code:
4416777158, Po. Box: 1478
Introduction
Disposal of dyeing industry wastewater pose one of the major problems, because such effluents contain a number of contaminants including acid or base, dissolved solids, toxic compounds, and color. Out of these, color is the first contaminant to be recognized because it is visible to the human eye. Removal of many dyes by conventional waste treatment methods is difficult since these are stable to light and oxidizing agents and are resistant to aerobic digestion
.
Adsorption techniques have proved to be an effective and attractive process for removal of on biodegradable pollutants (including dyes) from wastewater.1,2 The most widely used adsorbent for the removal of dyes is activated carbon, which is expensive and has a high regeneration cost.3,4 Therefore, interest is growing to find alternatives to carbon adsorbents. Recently, attention has been focused on the development of low-cost adsorbents for applications concerning the treatment of wastewater.2,5 Agricultural by-products such as peanut husk,6 apple pomace and wheat straw,7 wheat shell,8 cereal chaff,9 fruit peel,10 bark,7 and leaves11 have been widely studied for dye removal from wastewater. Generally, the sorption capacities of crude agricultural byproduct are low. For improving the sorption capacity of crude agricultural byproduct, chemical modification was used.12-15
Food and pharmaceutical industries worldwide use synthetic dyes as additives in their products. In the food industry, dyes are used to make products more attractive to consumers. However, dyes have no nutritional value and
may have toxic effects, causing from a simple allergy to intolerance to cancer. Dyes that have N=N bonds and sulfonic groups in their structures are considered acid and belong to the azo-dye class.3,4 Dyes are extensively used in food industries to improve the sensorial aspects of its products.1,5 Due to losses in the process, a considerable amount of these food dyes are present in the industrial effluents.2,5
Malachite Green (MG) is a popular dye and widely used for the dyeing of leather, wool and silk, distilleries, jute, paper, as a food coloring agent, food additive, in medical disinfectant and fish industries.6,7 Discharge of MG into the hydrosphere can cause environmental degradation as it gives undesirable color to water and reduces sunlight penetration. The consumption of MG has many adverse effects due to its
carcinogenic, genotoxic, mutagenic and teratogenic
properties of MG are due to presence of the nitrogen.
Since the removal of dyes from wastewater is considered an environmental challenge and government legislation requires textile wastewater to be treated, therefore there is a constant need to have an effective process that can efficiently remove these dyes.9,10
The removal of contaminants from industrial wastewaters is currently of great importance in recent years. Precipitation, ion exchange, solvent extraction, biosorption, filtration, electrochemical treatment and adsorption on oxides are the conventional methods for the removal of contaminants from aqueous solutions.11- 13
adsorption isotherm technique. Experimentaldata have been fitted to various isotherm equations to determine the best isotherm to correlate the experimental data.
Figure 1. Chemical structure of Malachite Green
Experimental
Adsorbent
The milled rice husk and sugarcane bagasse were obtained from farms in the north of Iran, Guilan. Then, it was used as an adsorbent. The SB and RH sieved through the sieves, 50-80 mesh size particles. Then adsorbents in above particle size rinsed with distilled water to remove dust and soluble impurities. For better purification, sugarcane bagasse mixed by 5 wt. % HCl at room temperature and after that it was soaked into distilled water for 48 h then washed with distilled water. Finally the adsorbents were dried in an oven at 70 °C overnight and stored and labeled as sugarcane bagasse (SB) and rice husk (RH).
Dye solution
Malachite Green acetate was product of Sigma-Aldrich and was used as received without further purification (Fig. 1). A stock solution of dye was prepared by dissolving 0.025 g of it in 50 mL of double distilled water. Working solutions of different concentrations (10–50 mg L-1) were prepared by further dilutions. The concentration of the dye MG was determined using a UV-vis spectrophotometer (WTW 6100) at a wavelength corresponding to the maximum absorbance of the dye. Calibration curve was plotted based on the absorbance versus concentration of the dye solution at the maximum wavelength of the dye (617 nm) using Beer’s law. A Metrohm pH meter (model 827) with a combined double junction glass electrode was used for showing pH values. pH adjustments were carried out using dilute NaOH and HCl solutions.
An accurate weighed quantity of dye was dissolved in 250 mL double distilled water to prepared stock solution. Experimental solution of the desired concentration was obtained by successively dilutions. The characteristics and some properties of MG are listed in Table1.
Sorption experiments
The adsorption of MG on SB and RH in liquid–solid system has been studied using a standard batch technique. The adsorption experiments have been carried out in 100 mL beaker by mixing a pre-weighed amount of desired
adsorbent and 50 mL of aqueous dye solution of fixed concentration. The beakers were shaked for the required time period in a mechanical shaker. The agitation rate is same for all experiments. The parameters such as initial dye concentration, pH of the medium, time of contact, and adsorbent dosage are varied during different sets of batch experiments. After adsorption, the samples are filtered out using the Whatman filter paper number-42. The left out concentration in the supernatant solution after adsorption
process has been analysed using UV–VIS
spectrophotometer (WTW 6100) by recording the absorbance changes at a wavelength of maximum absorbance (617 nm for MG).
The amount adsorbed of MG onto SB and MRH at equilibrium was calculated from the mass balance equation as follows:
(1)
where
C0 and Ce are the initial and the equilibrium concentrations (mg L-1) of malachite green solution, respectively;
V is the volume (L), and
W is the weight (g) of the adsorbent.
Results and discussions
Scanning electron microscopic study
Scanning electron microscopy (SEM) is a technique to characterize the surface structure and morphology of the biosorbent material. It is used to determine the particle shape and porous structure of biomass. Micrographs (Fig. 2) show that SB and RH particles have fibrous character. These images (Fig. 2 (A)) exhibit that SB samples have compacted layer that related to cellulosic material and they have lap joint structure. As the image shows the small layer pores may also take part in the adsorption process and also rice husk (Fig. 1 (B)), possesses smooth, flat and cloudy surface due to the presence of lignin, hemi-cellulose and wax. The small pores at rice husk surface probably participate in the adsorption process.
Figure 2. SEM images of adsorbents; A: SB; B: RH
B
A
0 e
e
(C C V)
q
Effect of pH
The effects of pH on the adsorption of MG on the SB and RH were studied in the pH ranging from 3–9 respectively. The results obtained are presented in Fig. 3, which describes maximum adsorption of around 81 and 98 % for SB and RH, respectively, at pH 8. Hence, all the succeeding investigations were performed at pH 8 for both adsorbents.
Figure 3. Effects of pH on MG dye removal at various concentrations (SB: absorbent dosage: 0.50 g; contact time: 40 min; temperature: 25 ºC) (RH: absorbent dosage: 0.50 g; contact time: 40 min; temperature: 25 ºC).
Effect of adsorbent dose
Fig. 4 shows the effect of adsorbent dose (SB and RH) on the removal of MG at C0=30 mg L-1 and 25 °C. It can be seen that the MG removal increases with increase SB and RH up to 0.60 g, thereafter remained fairly constant despite an increase in the amount of the both adsorbents to 0.6 g. At the equilibrium time, the % removal increased from 95.25 to 99.92 % for an increase in rice husk dose from 0.2 to 1.0 g and also for SB solution the % removal increase from 96.71 % to 98.91 % for an increase in SB dose from 0.2 to 1.0 g. So as the Fig. 4 shows the optimum dosage for both adsorbents were selected 0.60 g.
Figure 4. Influence of adsorbents dosage on dye removal (SB: contact time: 30 min; pH: 7.0; temperature: 25 ºC). (RH: contact time: 30 min; pH: 7.0; temperature: 25 ºC)
Effect of contact time on dye removal
Adsorption of MG was measured at given contact times for the different initial MG concentrations from 5 to 20 mg L-1. From Fig. 5, the plot reveals that the percent MG removal is higher at the beginning; this is probably due to a larger surface area of the RH and SB being available at the beginning for the adsorption of MG. As the surface adsorption sites become exhausted, the uptake rate is controlled by the rate at which the adsorbate is transported from the exterior to the interior sites of the adsorbent particles. Most of the maximum percent MG removal was attained after about 30 min of shaking time for both adsorbents at different concentrations. The increasing contact time increased the MG adsorption and it remained constant after equilibrium was reached in 30 min for different initial concentrations.
Figure 5. Effects of contact time of the dye removal at various concentrations. (A: RH; adsorbent dosage: 0.6 g; pH: 7.0; temperature: 25 ºC) (B: SB; adsorbent dosage: 0.4 g; pH: 7.0; temperature: 25 ºC).
Effect of initial dye concentration
It has been observed that for both the adsorbents,
adsorption of the dye increases with increasing
0
Figure 6. Effect of initial dyes concentration on its sorption onto SB (RH: absorbent dosage: 0.40 g; contact time: 45 min; temperature: 25 ºC)
Adsorption isotherms
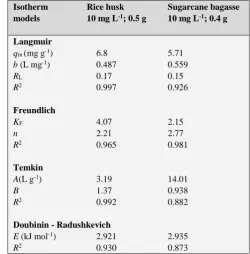
The adsorption isotherm indicates how the adsorbed molecules distribute between the liquid phase and the solid phase when the adsorption process reaches an equilibrium state. the experimental data points were fitted to the Langmuir, Freundlich, Temkin and Doubinin–Radushevich (D–R) isotherm equations14,15 and the constant parameters of the isotherm equations were calculated (Table 2).
The Langmuir isotherm
The Langmuir isotherm model suggests that the biosorption onto the adsorbent surface is homogeneous in nature with negligible interaction between adsorbed molecules. The linear form of the Langmuir model is given by:
(2)
where
qm shows the monolayer adsorption capacity (mg g-1), b is Langmuir constant (L mg-1),
Ce is equilibrium dye concentration in the solution (mg L-1) and
qe exhibit amount of dye adsorbed on biosorbent at equilibrium (mg g-1).
The significant aspect of the Langmuir isotherm model can be defined by the dimensionless constant separation factor RL which is expressed by the following equation:
(3)
where
C0 is the initial concentration of dye (mg L-1) and b is the Langmuir constant (L mg-1),
RL shows the nature of biosorption mechanism.
RL value Nature of biosorption mechanism RL>1 Unfavorable
RL=1 Linear
0< RL<1 Favorable RL<0 Irreversible
In this study, the value of RL was obtained to be in the range of 0-1, telling that the biosorption process is favorable for the both dyes.
Figure 7. Langmuir adsorption isotherm.
Freundlich isotherm
The Freundlich isotherm is derived by assuming a heterogeneous surface with a non-uniform distribution of heat of sorption over the surface. It can be expressed in the linear form as follows:
(4)
where
KF (L mg−1) and n are isotherm constants indicate the capacity and intensity of the adsorption, respectively.
As the value of n is lower than 10 so the biosorption process is favorable. On the other hand the heterogeneity factor of n-1<<1 indicates heterogeneous adsorbents, while values close to or even 1.0 indicate materials with relatively homogenous binding sites. According to the analysis in Table 2, the calculated n-1 was lower than 1, which indicated that SB and RH were heterogeneous adsorbent.
Temkin isotherm
The Temkin isotherm model suggests an equal distribution of binding energies over the number of the exchanging sites on the surface. This model considered the effects of some indirect adsorbate/adsorbate interactions on adsorption isotherms and suggested that because of these interactions
e e
e m m
1
C C
q q bq
L
0 1 1 R
bC
e f e
1
logq logK logC
n
the heat of adsorption of all the molecules in the layer would decrease linearly with coverage It can be expressed in the linear form as follows:
(5)
where
A is the equilibrium binding constant corresponding to the maximum binding energy and B is corresponding to the heat of sorption.
Figure 8. Freundlich adsorption isotherm.
Dubinin-Radushkevich isotherm
Doubinin–Radushkevich model is a more generalized model as compared to the Langmuir isotherm. This model is based on the fact that there is no homogeneous surface or constant adsorption potential. The linear form of (D–R) isotherm model can be seen below:
(6)
where
q0 is the maximum sorption capacity,
B is the activity coefficient related to the mean sorption energy and
ε is the Polanyi potential, given by
(7)
The sorption energy can be determined using the following equation:
(8)
The mean adsorption energy (E) gives information about chemical and physical nature of adsorption. If the energy of activation is < 8 kJ mol-1, the adsorption is physical and if
the energy of activation is 8-16 kJ mol-1, the adsorption is chemical in nature. The calculated values of D-R parameters for the adsorption of MG are also given in Table 1. The values of (E) that are shown in Table 2 indicate that the physico-sorption mechanism played an important role in the biosorption of cationic dye on the sugarcane bagasse and rice husk.
Adsorption kinetic
Kinetic studies are necessary to optimize different operating conditions for the biosorption. Various kinetic models have been suggested for explaining the order of reaction. To examine the controlling mechanism of adsorption processes, such as mass transfer and chemical reaction, the first-order adsorption and the pseudo-second-order adsorption models were used to test the adsorption of dye onto sugarcane bagasse and rice husk. The best-fit model was selected based on the linear regression correlation coefficient (R2). The two kinetic models’ equations are given as follows:
Table 1. Isotherm models constants and correlation coefficients for the adsorption of Malachite green onto sugarcane bagasse and rice husk.
Isotherm models
Rice husk 10 mg L-1; 0.5 g
Sugarcane bagasse 10 mg L-1; 0.4 g
Langmuir
qm (mg g-1) 6.8 5.71 b (L mg-1) 0.487 0.559
RL 0.17 0.15
R2 0.997 0.926
Freundlich
KF 4.07 2.15
n 2.21 2.77
R2 0.965 0.981
Temkin
A(L g-1) 3.19 14.01
B 1.37 0.938
R2 0.992 0.882
Doubinin - Radushkevich
E (kJ mol-1) 2.921 2.935
R2 0.930 0.873
Pseudo-first order model
The pseudo first-order kinetic model was proposed by Lagergren. A linear form of pseudo-first order model:
(9)
where
qe is the amount of dye adsorbed at equilibrium (mg g-1)
ln ln
e e
q B AB C
2 e
lnq lnq B
e
1 ln(1 ) RT
C
1/ 2 1 E
(2B)
qt is the amount of dye adsorbed at time t (mg g-1) k1 is the equilibrium rate constant of pseudo-first order kinetics (min-1).
The values of rate constant k1, qe calculated, qe experimental and R2 of MG and PR are presented in Table 3. The none similarity of calculated values (qe, cal) and the experimental values (qe, exp) and also non linearity of the plots (R2) showing that the biosorption of MG is not likely to follow the pseudo-first-order kinetic model.
Pseudo-second order model
Linear form of pseudo-second order model was illustrated as:
(10)
where
qe is the amount of dye adsorbed at equilibrium (mg g-1)
qt is the amount of dye adsorbed at time t (mg g-1) k1 is the equilibrium rate constant of pseudo-second order kinetics (min-1).
The second order parameters k2, qe calculated, qe experimental and R2 of MG and PR are shown in Table 2. The values of qe calculated and qe experimental for both dyes are quite same. The coefficients of determination for both dyes are also very high which showed that the pseudo-second-order kinetic model well fitted to kinetic data. The results showed that the pseudo-second-order kinetic model is more appropriate and effective than pseudo-first order kinetic model.
Table 2. The kinetic parameters for the adsorption of Malachite green onto sugarcane bagasse and rice husk.
Kinetic models
Rice husk, mg L-1
Sugarcane bagasse, mg L-1
10 20 10 20
Pseudo-first order
K1, min-1 0.215 0.192 0.054 0.039 qe (exp)
mg g-1
0.031 0.046 0.052 0.192
R2 0.981 0.987 0.887 0.964
Pseudo-second order
K2,
g mg-1 min-1
18.6 11.3 3.84 1.52
qe (exp),
mg g-1
0.834 1.66 1.24 1.11
R2 1 1 1 0.999
qe,
cal mg g-1
0.832 1.66 1.24 1.14
Intra particle diffusion
Kid 0.0089 0.016 0.029 0.027 Ci 0.8 1.61 1.13 0.946 R2 0.945 0.999 0.968 0.998
Conclusions
This study demonstrated the effectiveness of sugarcane bagasse and rice husk biomass to remove the dye from aqueous solution. The results reveal the removal of malachite green increase with decreasing initial dye concentration, increasing adsorbent dosages and contact time up to equilibrium. The solution pH played a significant role in influencing the capacity of adsorbent towards two dyes. The experiments show that the optimum pH for removing dye is 7. The high correlation coefficients for adsorption by SB reflect that the experimental data agree well with the Freundlich adsorption isotherm model and on the other hand the correlation coefficients for adsorption by RH shows that data agree with Langmuir isotherm. The kinetics study of dye on both adsorbents was performed based on pseudo-first order, pseudo-second order and intra particle diffusion equations.
The data indicate the adsorption kinetics follow the pseudo-second order rate with intra particle diffusion as one of the rate determing steps. Based on its excellent adsorption performance, it is concluded that sugarcane bagasse and rice husk could be used as a low-cost and efficient adsorbent for removal of anionic and cationic dye from wastewater and has good potential for further application in effluent treatment.
Acknowledgements
We gratefully acknowledge the Research Council of University of Guilan for supporting this work.
References
1Sharma, Y. C., Singh, B. and Uma, The Open Environ. Pollut. Toxicol. J., 2009, 1, 74.
2Dotto, G. L., Moura, J. M., Cadaval, T. R. S., Pinto, L. A. A., Chem. Eng. J., 2013, 214, 8.
3Robinson, T., McMullan, G., Marchant, R., Nigam, P., Bioresour. Technol., 2001, 77, 247.
4Aksu, Z., Process. Biochem., 2005, 40, 997.
5Wang, X. S., Zhou, Y., Jiang, Y., Adsorpt. Sci. Technol. 2009, 27,
537.
6Ansari, R. and Dezhampanah, H., Eur. Chem. Bull., 2013, 2(4),
220.
7Dezhampanah, H., Mohammad-Khah, A., Naghi Aghajani, N., Eur. Chem. Bull., 2013, 2(10), 709-714.
8Han, R. P., Han, P., Cai, Z. H., Zhao, Z. H., Tang, M. S., J. Environ. Sci. 2008, 20, 1035–1041.
9Saliba, R., Gauthier, H., Gauthier, R., Petit-Ramel, M. Adsorpt. Sci. Technol., 2002, 20, 119–129.
10Bulut, Y., Aydin, H., Desalination, 2006, 194, 259–267.
11Han, R. P., Wang, Y. F., Han, P., Shi, J., Yang, J., Lu, Y. S., J. Hazard. Mater., 2006, 137, 550–557.
12Sivaraj, R., Namasivayam, C., Kadirvelu, K., Waste Manag.
2001, 21, 105–110.
13Han, R. P., Wang, Y., Zhao, X., Wang, Y. F., Xie, F. L., Cheng,
J. M., Tang, M. S., Desalination, 2009, 245, 284–297.
14Gong, R. M., Zhong, K. D., Hu, Y., Chen, J., Zhu, G. P., J. Environ. Manag., 2008, 88, 875–880.
2 2
1
t e e
t t
15Gurgel, L. V. A., Freitas, R. P., Gil, L. F., Carbohyd. Polym.,
2008, 74, 922.
16Ong, S. T., Lee, C. K., Zainal, Z., Bioresour. Technol., 2007, 98,
2792.
17Sciban, M., Klasnja, M., Skrbic, B., Desalination, 2008, 229,
170.