PHASE BEHAVIOR AND PHYSICOCHEMICAL PROPERTIES
OF WATER/CETYLTRIMETHYLAMMONIUM
BROMIDE/N-PROPANOL/ALLYLBENZENE MICELLAR SYSTEMS
Monzer Fanun,
[a]* Ahmad Shakarnah,
[a]O
day Mustafa,
[a]Michael Schwarze,
[b], Reinhard
Schomäcker
[b]and Jochanan Blum
[c]Keywords: phase behavior, ultrasonic velocity, density, isentropic compressibility, hydrodynamic diameter; cetyltrimethylammonium bromide, allylbenzene, n-propanol, water
Water/n-propanol/cetyltrimethylammonium bromide/allylbenzene micellar systems were formulated. The ratio (w/w) of n-propanol/ cetyltrimethylammonium bromide equals 2/1. The extent of the micellar region as function of temperature was determined. The micellar systems were characterized by the volumetric parameters, density, excess volume, ultrasonic velocity and isentropic compressibility. The micellar densities increase with the increase in the water volume fraction. Excess volumes increase with the water volume fraction and temperature. Ultrasonic velocities increase with water volume fraction up to 0.8 then decrease. Ultrasonic velocities increase with temperature for water volume fractions below 0.8 and increase for water volume fractions above 0.8. Isentropic compressibilities decrease with the water volume fraction up to 0.8 then increase. Isentropic compressibilities increase with temperature for water volume fractions below 0.8 and decrease for water volume fractions above 0.8. Structural transitions from water-in-oil to bicontineous to oil-in-water occur along the micellar phase. The particle hydrodynamic diameter of the oil-in-water micellar systems decrease with temperature. In the diluted region nanoemulsions systems were observed.
Corresponding Authors Tel: + 972 5 22 40 60 61; Fax: + 972 22 79 69 60
E-Mail: [email protected], ormfanun@ science. alquds.edu
[a] Colloids and Surfaces Research Center, Al-Quds University, East Jerusalem 51000, Palestine
[b] Institut für Chemie, Technische Universität Berlin, Strasse des 17. Juni 124, D-10623 Berlin, Germany
[c] Institute of Chemistry, The Hebrew University of Jerusalem, Jerusalem 91904, Israel
Introduction
Nanoemulsions have homogeneous and very tiny droplet
sizes, usually in the range of 20–500 nm.1,2 Use of
nanoemulsions in industrial applications is very attractive since they do not require a high concentration of surfactants. These systems can be prepared using moderate surfactant concentrations (in the range of 4–8 wt%). The properties of these systems that are kinetically stable, with low viscosity and optical transparency make them very attractive systems
for many industrial applications.3-9Nanoemulsions are used
as drug delivery systems,3,4 in personal care and
cosmetics5,6 and also as reaction media.7-10In this study, we report on the use of the ultrasonic velocity measurement and dynamic light scattering techniques for analysis of a pseudoternary system consisting of allylbenzene as the oil phase, the cationic surfactant, cetyltrimethylammonium
bromide, a cosurfactant (n-propanol), and water. Changes in
the ultrasonic velocity and in the density were measured as a function of water volume fraction and temperature. The particle sizes of the diluted systems (i.e., at water volume fractions above 0.90) were determined.
Experimental
Materials
Allylbenzene (ALB), n-propanol (n-PrOH), and
cetyltrimethylammonium bromide (CTAB), were purchsed from from Sigma-Aldrich Chemical Company. All of the components were used as supplied without further purification. Triply distilled water was used for all experiments.
Methods
Sample preparation for pseudoternary phase diagram at constant temperature
The behavior of a four-component system is described in pseudoternary phase diagrams in which the weight ratio of surfactant/co-surfactant is fixed. The determination of the phase diagram was performed in a thermostated bath
(T0.1 K). Ten weighted samples composed of mixtures of
The completion of this process was accelerated by centrifuging the samples. Every sample that remained transparent and homogeneous after vigorous vortexing was
considered as a one phase region in the phase diagram.11,12
The solubilization capacity was determined for the one phase region of the relevant pseudoternary phase diagrams.
Li et al.13 proposed the total one phase area in the phase
diagram as a solubilization parameter. We call this area AT.
The relative error in determining the AT was estimated to be
2% for all systems studied.
Ultrasonic velocity and density
The ultrasonic velocity and density of the various one phase transperent samples were measured using a density and sound velocity analyzer (DSA 500M- Anton Paar,
Austria) with a sound velocity resolution of 0.5 ms-1 and
density resolution of (5*10-6 g cm-3. A 3 ml degassed sample
is introduced using Hamilton glass syringe into a U-shaped borosilicate glass tube that is being excited electronically to vibrate at its characteristic frequency. The characteristic frequency (high frequency (above 100 kHz) acoustic waves) changes depending on the density of the sample. Through precise determination of the characteristic frequency and a mathematical conversion, the density of the sample can be calculated. The measuring cell is closed by an ultrasonic transmitter on the one side and by a receiver on the other side. The transmitter sends sound waves of a known frequency through the sample. The velocity of sound was calculated by determining of the period of received sound waves and by considering the distance between transmitter and receiver. Due to the high dependency of the density and velocity of sound values on the temperature, the measuring cells have to be thermostated precisely with two integrated Pt 100 platinum thermometers together with Peltier elements provide an precise thermostating of the sample that equals ±0.01ºC. Viscosity-related errors were automatically corrected over the full viscosity range by measuring the damping effect of the viscous sample followed by a mathematical correction of the density value. The instrument automatically detects gas bubbles in the density measuring cell by an advanced analysis of its oscillation pattern and generates a warning message. Each sample was degassed before placing it in the analyzer. Measurements were made at 298, 310, 318 K.
Dynamic light scattering
Zetasizer Nano S (ZEN 1600) by Malvern Instruments Ltd. (Worcestershire, United Kingdom) for the measurements of the size of diluted micellar particles. The equipment includes a 4mW, 633nm He-Ne laser. Size measurement
range between 0.6nm to 6 m, size measurement angle
equals 173º. 1.5 ml micellar sample was introduced in a
disposable polystyrene cuvettes and measured at
temperatures range between 303 and 323 K by steps of 5 K. The particle hydrodynamic diameter was calculated from the
translational diffusion coefficient (D) using the
Stokes-Einstein relationship:
where
dH is the hydrodynamic diameter,
kB is Boltzmann’s constant,
T is the absolute temperature and
η is the solvent viscosity.
The results are averages of 3 experiments.
Results and Discussion
Phase behavior
Figure 1 presents the phase behavior of water/ cetyltrimethylammonium bromide/n-propanol/allylbenzene systems at 298 K. The ratio (w/w) of n-propanol/surfactant equals 2/1. As shown in the Figure 1, the phase behavior of the cationic surfactant cetyltrimethylammonium bromide is similar to that of the anionic sodium dodecyl sulfate and is different from that observed with the nonionic surfactants
sucrose monolaurate presented elsewhere.12,14,15
Figure 1. Pseudoternary phase diagram of the water/n-propanol/ cetyltrimethylammonium bromide/allylbenzene system at 298 K. The mixing ratio (w/w) of n-propanol/surfactant equals 2/1. The isotropic one phase region is designated by 1, and the multiple phase regions are designated by (M). N80 is the dilution line where the weight ratio of (surfactant + propanol)/allylbenzene equals 4/1.
In the case of the cetyltrimethylammonium bromide, the transparent micellar region appears after the addition of about 10 wt. % of water. Similar findings on the behavior of cetyltrimethylammonium bromide in the presence of other
aromatic oils were reported.12,14-17 The area of the one phase
region varies very slightly with temperature.
Volumetric properties
The ultrasonic wave propagates through materials and as it transverses a sample, compressions and decompressions in the ultrasonic wave change the distance between molecules within the material, which, in turn, respond by intermolecular repulsions and attractions and probes the
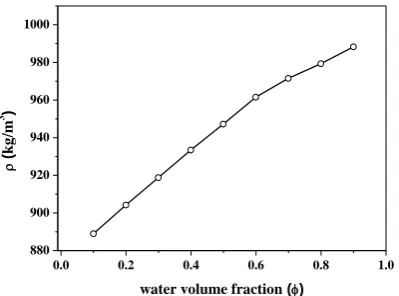
elastic properties of samples.18-20 Figure 2 represent the
variation in the density as function of the water volume fraction for the water/n-propanol/ cetyl trimethylammonium (1)
6 k TB dH D
ALB
Water
n-ProH/CATB=2/1
Figure 2. Variation of the density as function of water volume fraction along N80 for the micellar system presented in Figure 1.
bromide /allylbenzene systems. The relation (2) can evaluate the excess volume of micelle formation, keeping in view the additivity of volumes of micellar, aqueous and oil phase,
where
VE is the excess volume,
Vmicis the measured micellar specific volume,
i is the volume fraction of component i in the
micellar system and
Vi is the specific volume of component i.
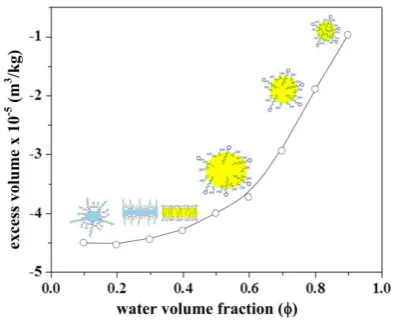
Figure 3. Variation of the excess volume as function of water volume fraction along N80 for the micellar system presented in Figure 1.
Figure 3 presents the variation in the excess volume as function of water volume fraction. In the case of the cationic surfactant cetyltrimethyl ammonium bromide the excess volume increases with the water volume fraction. The excess volume values are negative indicating that the system contracts upon addition of water. Similar behaviors of excess volume with ionic and nonionc surfactants were
presented elsewhere.12,14,15 The values of excess volume
were also determined as function of temperature and it was found that excess volume increases with temperature indicating expansion of the micellar systems with
Figure 4. Variation of the ultrasonic velocity as function of water volume fraction along N80 for the micellar system presented in Figure 1.
temperature. This behavior could be related to breakage of hydrogen bonds or to dissociation of ionic head groups. Figure 4 repersents the variation of the ultasonic velocity as function of the water volume fraction for the water/n-propanol/cetyltrimethyl ammonium bromide/allylbenzene systems. The ultrasonic velocity increases with the water volume fraction upto 0.8 thereafter decreases. The variation in the values of ultarsonic velocity as function of water volume fraction provides information on the state of water. At low water volume fraction the properties of water are very different from those of bulk water indicating the entrapment of water in the micellar core suggesting the presence of water-in-oil microstructure. The increase in the values of ultrasonic velocity upon addition of water indicates structural transitions along the water dilution line. For water volume fraction above 0.8 the ultrasonic velocity approches that of pure water indictaing that water is the continuous phase and oil-in-water microstructure is present. Since ultrasonic velocity is determined by the change of physical properties at the interface between the particle core and the continuous medium, the ultrasonic velocity variation shall also be correlated to the variation of the size of the particle core. In order to better understand these results, we analyzed the ultrasonic velocity in terms of
isentropic compressibility ks, which represents a relative
change of volume per unit of pressure applied at constant
entropy. ks is much more sensitive to structural changes
than the velocity and can provide qualitative information about the physical nature of the aggregates. The isentropic
compressibility ks values have been evaluated with the help
of the Laplace equation:21-23
Figure 5 presents the variation of the isentropic
compressibility ks as function of the water volume fraction.
The isentropic compressibility decreases with the water volume fraction below 0.8 and increases thereafter. The variation in the values of isentropic compressibility as function of increasing water volume fraction indicates structural transitions from water-in-oil to bicontinuous to oil-in-water microstructure. The values of the isentropic compressibility were determined as function of temperature (see Figure 6) and found to increase with temperature for water volume fractions below 0.8 while for water volume
(2) E
V Vmic i iV
i
0.0 0.2 0.4 0.6 0.8 1.0
880 900 920 940 960 980 1000
(
kg/m
3 )
water volume fraction ()
0.0 0.2 0.4 0.6 0.8 1.0
-5 -4 -3 -2 -1
V
E *10
-5
(
m
3 /kg
)
water volume fraction ()
0.0 0.2 0.4 0.6 0.8 1.0
1300 1350 1400 1450 1500 1550 1600
u
(
m/s
)
water volume fraction ()
1
(3) 2
Figure 5. Variation of the isentropic compressibility as function of water volume fraction along N80 for the micellar system presented in Figure 1.
Figure 6. Variation of the isentropic compressibility as function of temperature along N80 for the micellar system presented in Figure 1.
fraction above 0.8 the isentropic compressibility values decrease. Possible microstructure transitions in the studied micellar system are presented schematically in Figure 7.
Figure 7. Schematic presentation (not for scale ) of the structural transions along N80 for the micellar system presented in Figure 1.
Diffusion properties
For diluted micellar systems consisting of closed ag-gregates the diffusion of the aggregated components is given solely by the aggregate diffusion. At water volume fraction of 0.90 and on the assumption that exchange processes are negligible for the surfactant, we can estimate the
hydrodynamic diameter (dH) of the micelles in the
water-rich region at water volume fraction about 0.90 using equation 1. The variation in the values of the hydrodynamic
diameter (dH) at water volume fraction of 0.90 for the
different systems used in this study as function of temperature are shown in Figure 8. As shown in Figure 8 the hydrodynamic diameter decreases with temperature from 299 nm at 303K to 256 nm at 318K. The valuse of the hydrodynamic diameter indictes that the micellar systems formed with cetyltrimethyl ammonium bromide are nanoemulsions.
Figure 8. Variation of the particle hydrodynamic diameter as function of temperature along N80 for the diluted micellar system presented in Figure 1.
Conclusion
Temperature insensitive micellar systems were formulated for performing reactions with hydrophobic reagents that will lead to a significant reduction in the vast amount of organic solvents used currently in organic syntheses, and consequently increase the safety and diminish the cost of chemical processes. Quantitative analysis of the studied properties enabled the characterization of structural transition along the micellar phase. Nanoemulsion system were revealed by the determination of the particle size diameters of the diluted systems. Since the particle size of the micellar system is an important parameter in determining the yield of isomerization reaction of allylbenzene, the results presented in this study recommend performing these reactions at water volume fractions above 0.85 or at surfactant contents slightly above the critical micelle concentration and at high temperatures.
Acknowledgment
We gratefully acknowledge the financial support of this trilateral study by the Deutsche Forschungsgemeinschaft (DFG) through grant SCHO 687/8-2.
0.0 0.2 0.4 0.6 0.8 1.0
4.0 4.5 5.0 5.5 6.0 6.5
ks
*10
-10
(
m/s
)
water volume fraction ()
295 300 305 310 315 320
4.0 4.5 5.0 5.5 6.0 6.5 7.0
ks
*10
-10
(
Pa
-1 )
T (K)
= 0.2
= 0.4
= 0.9
300 305 310 315 320
250 260 270 280 290 300
Dh
(nm)
References
1Forgiarini, A., Esquena, J., Gonzalez, C., Solans, C., Langmuir
2001, 17 , 2076.
2Wang, L., Li, X., Zhang, G., Dong, J., Eastoe, J., J. Colloid Interfac. Sci., 2007, 314, 230.
3Ravi Theaj Prakash, U., Thiagarajan, P., Res. Biotechnol.,2011, 2,
1.
4Sarker, D. K., Curr Drug Deliv., 2005,2, 297.
5Yilmaz, Y., Borchert, H. H., Int. J. Pharm., 2006, 307, 232. 6Simonnet, J. T., Sonneville, O., Legret, S., US Patent US
6689371, 2004.
7Antonietti, M., Landfester, K., Org. Polym. Sci., 2002, 27, 689 8Tiarks, F., Landfester, K., Antonietti, M., Langmuir, 2001, 17,
908.
9Porras, M., Martınez, A., Solans, C., Gonzalez, C., Gutierrez, J.
M., Colloids Surfaces A: Physicochem. Eng. Aspects, 2005, 270–271, 189.
10Meltzer, D., Avnir, D., Fanun, M., Gutkin, V., Popov, I.,
Schomacker, R., Schwarze, M., Blum, J., J. Mol. Catal. A: Chem., 2011, 335, 8.
11Fanun, M., J. Colloid Interface Sci., 2010, 343, 496.
12Fanun, M., Shakarnah, A., Meltzer, D., Schwarze, M.,
Schomaecker, R., Blum, J., Tenside Surfact.. Deterg., 2011, 48, 400.
13Li, G., Kong, X., Guo, R., Wang X., J. Disp. Sci. Technol., 1989, 5, 29.
14Fanun, M., Ayad, Z., Mudalal, S., Dahoah, S., Meltzer, D.,
Schwarze, M., Schomaecker, R., Blum, J., J. Surfact. Deterg.
2012, 15, 505.
15Fanun, M., Shakarnah, A., Mustafa, O., Schwarze, M.,
Schomäcker, R., Blum, J., Eur. Chem. Bull., 2012, 1, 141.
16Rushforth, D.S., Sanchez-Rubio, M., Santo-Vidals, L. M.,
Wormuth, K. R., Kaler, E. W., Cuevas, R., Puig, J. E., J. Phys. Chem., 1986, 90, 6668.
17Bellocq, A. M., Biais, J., Clin, B., Gelot, A., Lalanne, P.,
Lemanceau, B., J. Colloid Interface Sci., 1980, 74, 311.
18Hickey, S., Lawrence, M. J., Hagan, S. A. and Buckin, V., Langmuir, 2006, 22, 5575.
19Mehta, S.K., Bala, K., Fluid Phase Equilibria, 2000, 172, 197. 20Alberola, C., Dederichs, T., Emeis, D., Moller, M., Sokolowski,
T., Witten, K.P., J. Colloid Interface Sci., 2007, 307, 500.
21Ye, L., Weitz, D. A., Sheng, P., Bhattacharya, S., Huang, J. S.,
Higgins, H. J., J. Phys. Rev. Lett. 1989, 63, 263.
22Wood, A. B., A Textbook of Sound, G. Bell, London, 1941. 23Barret-Gultepe M. A., Yeager, E. B., J. Phys. Chem. 1983, 87,
1039.