The Journal of Nutrition
Nutritional Epidemiology
Highly Processed and Ready-to-Eat Packaged
Food and Beverage Purchases Differ by
Race/Ethnicity among US Households
1–3
Jennifer M Poti, Michelle A Mendez, Shu Wen Ng, and Barry M Popkin*
Department of Nutrition, University of North Carolina at Chapel Hill, Chapel Hill, NC
Abstract
Background: Racial/ethnic disparities in dietary quality persist among Americans, but it is unclear whether highly processed foods or convenience foods contribute to these inequalities.
Objective:We examined the independent associations of race/ethnicity with highly processed and ready-to-eat (RTE) food purchases among US households. We determined whether controlling for between-group differences in purchases of these products attenuated associations between race/ethnicity and the nutritional quality of purchases.
Methods:The 2000–2012 Homescan Panel followed US households (n= 157,142) that scanned their consumer packaged goods (CPG) food and beverage purchases. By using repeated-measures regression models adjusted for sociodemo-graphic characteristics, we examined time-varying associations of race/ethnicity with processed and convenience food purchases, expressed as a percentage of calories purchased. We estimated associations between race/ethnicity and saturated fat, sugar, or energy density of total purchases with and without adjustment for processed and convenience food purchases.
Results:Compared with white households, black households had significantly lower purchases of highly processed foods (–4.1% kcal) and RTE convenience foods (–4.9% kcal) and had higher purchases of basic processed foods, particularly cooking oils and sugar (+5.4% kcal), foods requiring cooking/preparation (+4.5% kcal), and highly processed beverages (+7.1% kcal). Hispanics also had lower purchases of highly processed and RTE foods than whites. Blacks had CPG purchases with significantly higher median sugar (+2.2% kcal) and energy density (+72 kcal/1000 g), whereas Hispanics had purchases with lower saturated fat (–0.6% kcal) and energy density (–25 kcal/1000 g) than whites. Racial/ethnic differences remained significant after adjustment for processed and convenience food purchases.
Conclusions:In our study, compared with white households, both black and Hispanic households had lower purchases of highly processed and RTE foods, yet had total CPG purchases with differing nutritional quality. Our findings suggest that highly processed convenience foods are associated with, but cannot fully explain, racial/ethnic disparities in the nutritional quality of CPG purchases. J Nutr2016;146:1722–30.
Keywords:
processed food, food processing, convenience, race, ethnicity, disparitiesIntroduction
Racial and ethnic disparities in obesity and nutrition-related
chronic diseases among Americans have been well documented
(1–3). Differences in dietary intake across racial/ethnic groups
may mediate these health inequalities (4, 5). Previous studies
found that black children and adults had less favorable
nutri-ent intakes, lower adherence to dietary guidelines, and poorer
dietary quality than their white counterparts (6–12). To reduce
these disparities, a better understanding of the types of foods
purchased and consumed by each population group is needed to
inform dietary guidance, interventions, or policy efforts (6–8).
Scholars have proposed that future efforts may thus need a new
focus on novel metrics, such as food processing (13–16).
Foods can be classified along a spectrum ranging from
min-imally processed to highly processed on the basis of the extent to
which the food was altered from its natural state as a result of
industrial food processing (16–18). Highly processed foods are
defined as multi-ingredient, industrially formulated mixtures
1
Supported by the Robert Wood Johnson Foundation (grants 67506, 68793, 70017, and 71837) and the NIH (R01DK098072, DK56350, and CPC P2C HD050924).
2
Author disclosures: JM Poti, MA Mendez, SW Ng, and BM Popkin, no conflicts of interest.
3
Supplemental Materials 1 and 2, Supplemental Tables 1–3, and Supplemental Figures 1–15 are available from the ‘‘Online Supporting Material’’ link in the online posting of the article and from the same link in the online table of contents at http:// jn.nutrition.org.
*To whom correspondence should be addressed. E-mail: [email protected].
(17). Some, but not all, processed foods are manufactured to be
ready-to-eat (RTE)
4and may independently promote
overcon-sumption; thus, researchers may distinguish processing from
convenience (19–22). The highly processed and RTE foods
purchased by US households were found to have substantially
higher saturated fat, sugar, and sodium content than less processed
foods or foods requiring cooking, respectively (17). Greater
consumption of highly processed foods has been associated with
higher energy intake, poorer dietary quality, and higher obesity
prevalence (23, 24). In a recent study, highly processed foods and
beverages provided 61.0% of calories in consumer packaged
goods (CPG) purchased by US households, and the majority of
products (68.1%) were purchased in RTE form (17);
further-more, 57.3% of energy intake came from processed foods
among NHANES participants (18).
However, it is unknown whether highly processed and
convenience food purchases differ across racial/ethnic
popula-tions and whether these differences have widened or narrowed
across time. Studies of racial/ethnic variation in diet have been
hindered by differential bias in self-reported intake and lack of
culturally appropriate questionnaires or food-composition
da-tabases (25–29); therefore, food-purchasing data recorded by
barcode scanning may provide valuable insight (30). Disparities
in dietary quality have worsened in the past decade, which
suggests that changes in highly processed or RTE foods may
have occurred (10–12).
In addition, although previous studies suggest that racial/
ethnic disparities exist in the overall nutritional quality of
dietary intake and CPG purchases (8, 31), a lack of
understand-ing of how highly processed and convenience foods contribute
to these differences is a major gap in the literature. Scholars
hypothesize that excess consumption of highly processed or
convenience foods may promote poor dietary quality because of
their less healthful nutritional profile as well as their potential
ability to trigger addictive-like eating behaviors (24, 32–34).Yet,
other scholars concluded that processed foods are not major
determinants of the nutrient content of dietary intake (18). Thus,
examining whether racial/ethnic differences in processed and
convenience food purchases are associated with disparities in the
nutrient content of CPG purchases is essential to help guide
future intervention or policy work that might target highly
processed RTE foods. To address these gaps in the research
literature, we aimed
1
) to examine multivariable-adjusted
asso-ciations of race/ethnicity with highly processed and RTE food and
beverage CPG purchases among a large nationwide sample of US
households and
2
) to determine whether controlling for
subpop-ulation differences in processed and convenience food purchases
could attenuate the associations between race/ethnicity and the
nutritional quality of total CPG purchases.
Methods
Study population
This analysis used data from the 2000–2012 Nielsen Homescan Panel, a nationwide study of CPG food and beverage purchases by US households (35–38). Household members are given barcode scanners and are instructed to scan the barcodes on all foods and beverages purchased from grocery, drug, mass-merchandise, supercenter, and convenience stores and supermarkets. Homescan uses an open-cohort study design, in which households are required to scan purchases continuously for$10 mo and then may exit the study at any time. As households exit the study,
new households are enrolled to rebalance the sociodemographic char-acteristics of the sample. Households scan their purchases continuously throughout the year; to best capture usual shopping habits, all purchases during a calendar year were summed to create year-level purchase totals. The majority of those surveyed between 2000 and 2012 remained in the study for multiple years of observation (70%) and had multiple year-level observations. The mean time in the study was 4.2 y (range: 1–13 y). Households were sampled from 76 geographic markets. Race/ethnicity and educational level of the male and female heads of household, household income, and each household memberÕs age and sex were assessed by questionnaire. Multiracial households were categorized on the basis of the race/ethnicity of the head of household. To capture usual shopping, this analysis excluded purchases during annual quarters deemed unreliable by study investigators (CPG purchases <$135 for multimember households and <$45 for single-member households in any 4-wk period) and year-level observations for households reporting >1 unreliable quarter during a given year (2.2%) (39). The final analytic sample included 656,184 household year-level observations (157,142 unique households) from 2000 through 2012. As secondary analysis, this study was exempt from institutional review board approval.
Food and beverage purchase data
Households scanned the barcode of each purchased item. Each barcode was linked to a corresponding Nutrition Facts Panel with the productÕs nutrient content, weight (g), ingredients, and description (39). Product attributes and ingredient lists were used to categorize products at the barcode level into food groups reflecting nutrient content and consump-tion patterns (17).
Processing and convenience classification
Previous work developed a classification system for categorizing foods and beverages by degree of processing and level of convenience; a detailed description of this system is available elsewhere (17) and is described in brief below and in Supplemental Material 1. Each of 1,230,536 barcoded products was classified into a single category for processing and separately into a single category for convenience. Classification was conducted programmatically by using the Perl-based pattern matching syntax ‘‘regular expressions’’ to perform keyword searches of ingredient lists, product attributes, and package information (17).
Processing.Each barcoded item was assigned to 1 of 4 categories of food processing on the basis of the extent to which the food was altered from its natural state by industrial food processing and the purpose of these processing steps (Supplemental Table 1) (17). ‘‘Unprocessed or minimally processed’’ products are single-ingredient foods that have undergone no or slight modifications, such as milk, fresh or frozen fruit and vegetables, or unseasoned meats. ‘‘Basic processed’’ products have undergone physical or chemical processing but remain as single foods (17). This category includes basic processed ingredients, such as oil or granulated sugar, and foods processed for basic preservation, such as vegetables canned with no added salt or refined-grain flour. ‘‘Moderately processed’’ products are single foods with the addition of flavor additives, such as salted nuts or fruit canned in syrup; these products remain recognizable as their original plant or animal source (17). ‘‘Highly processed’’ products are multi-ingredient, industrially formu-lated mixtures that have been processed to an extent that they are no longer recognizable as their original plant or animal source (17). Examples are refined breads, grain-based desserts, sugar-sweetened beverages (SSBs), pre-prepared mixed dishes, margarine, or ketchup.
Convenience.To separately classify foods and beverages by convenience, each product was assigned to 1 of 3 categories on the basis of the amount of food preparation required by the consumer before the product can be eaten (Supplemental Table 2) (17). Products requiring ‘‘cooking and/or preparation’’ (hereafter ‘‘requiring cooking’’) require input of the con-sumerÕs time, culinary skill, energy, or attention to cook or prepare before consumption (17). Examples include raw meat, fresh potatoes, cooking oil, flour, or dry pasta. Products ‘‘ready-to-heat or requiring minimal preparation’’ (hereafter ‘‘ready-to-heat’’) require only a small amount of the consumerÕs time or effort and no culinary skill or attention, such as
4
frozen dinners or canned soup (17). RTE products can be consumed immediately with no preparation (17) and include bread, salty snacks, cookies, fruit, and some raw vegetables (e.g., precut salad or baby carrots).
Statistical analyses
All of the statistical analyses were performed using Stata 14 (Stata Corp). To examine the association of highly processed or RTE food and beverage purchases with race/ethnicity, we used multivariable-adjusted, repeated-measures, random-effects regression models; these models were used to account for correlation between repeated measures within households across time. To estimate time-varying associations with race/ ethnicity independent of income or education, models regressed the percentage of calories purchased from a given category of processed food on year (dummy variables) and race/ethnicity [non-Hispanic white (white), non-Hispanic black (black), Hispanic, and all other races/ ethnicities] while adjusting for education (less than high school, high school, and college degree or higher), household income [<$25,000 (low income), $25,000–$49,999, $50,000–$74,999, and $$75,000 (high-income)], and other covariates (described below). Because of hetero-geneity among those classified as other races/ethnicities, results for these households are not shown. Separate models were used for each category of processing and convenience, separately for foods (as a percentage of food calories purchased) and beverages (as a percentage of beverage calories purchased). Outcomes were expressed as percent-ages to control for differences in absolute calories purchased across racial/ethnic groups.
To determine whether associations between purchases and race/ethnicity varied across time, Wald tests for the joint significance of interaction product terms were used. Significant interactions (P< 0.001) were detected between time (y) and race/ethnicity for all outcomes, so interaction terms were retained in the final models. Coefficients from the full model were used to determine the adjusted outcome value (%kcal from processed or conve-nience foods) for each racial/ethnic group in each year. Results focus on 2000 and 2012 only because differences were minimal across time. Associations between purchases and race/ethnicity were assessed as conditional marginal effects in 2000 and 2012. Time trends from 2000 through 2012 were assessed as the marginal effect of year (2012 compared with 2000) for each racial/ethnic group. Time trends and purchases were compared across subpopulations by using postestimation Wald tests.
To determine whether associations between purchases and race/ ethnicity differed by household income, 2-way and 3-way interactions of race, income, and time were tested for each outcome. Tests were not significant, except for models with the outcomes basic processed foods and foods requiring cooking; although these were significant, differences were small. Because associations of purchases and race/ethnicity showed
similar patterns for all income groups, results stratified by income are presented asSupplemental Figures 1–12. Additional analyses to identify key processed or convenience foods that varied across racial/ethnic groups are described in detail inSupplemental Material 2.
To examine how these differences in processed and convenience food purchases across racial/ethnic subpopulations may be related to the nutritional quality of purchases, associations between the nutrient content of total purchases and race/ethnicity were estimated with and without adjustment for processed and convenience food purchases. This analysis used multivariable-adjusted quantile regression with saturated fat (% kcal), sugar (% kcal), or energy density (kcal/1000 g; food only) of total CPG purchases as continuous outcomes, race/ethnicity as the main independent variable, and clustering on the household to account for correlation of repeated measures. Quantile regression was used to appropriately model the skewed distribution of nutrient content outcomes and to remove undue influence of outliers (40).b-Coefficients provided the difference in nutrient content of CPG purchases at the 50th (median) and 90th percentiles for each racial/ethnic group compared with the referent group (white); this approach was used to reveal heterogeneity in racial/ethnic differentials among households with the poorest nutritional quality of purchases that are potentially associated with greater health risk. Models were additionally adjusted for purchases from each category jointly defined by processing and convenience. Estimates with and without adjustment were compared, with a 10% change-in-estimate used as an a priori criterion that indicated that processed and convenience food purchases partially explained racial/ ethnic variation in the nutrient content of purchases.
All models were adjusted for year; household income; education; household composition (single adult with no children, single adult with children, multiple adults with no children, and multiple adults with children); interactions of income, education, and household composi-tion with year; the number of male and female household members within age groups (children aged 2–5 y, 6–11 y, and 12–18 y and adults aged $19 y); geographic market; and market-level unemployment rate. For all analyses, significant differences were tested by using a 2-sidedPvalue of 0.001 to account for multiple comparisons and the large sample size.
Results
Characteristics of the study population by race/ethnicity are
presented in
Supplemental Table 3
. Black and Hispanic
house-holds in our study have higher incomes than in the general US
population; our sample is not nationally representative, so we
cannot estimate racial/ethnic differences that reflect the
distri-bution of income across racial/ethnic groups in the United States.
Instead, racial/ethnic differentials are presented after adjustment
for income and sociodemographic factors to show these
differ-ences holding constant socioeconomic status. Race/ethnicity was
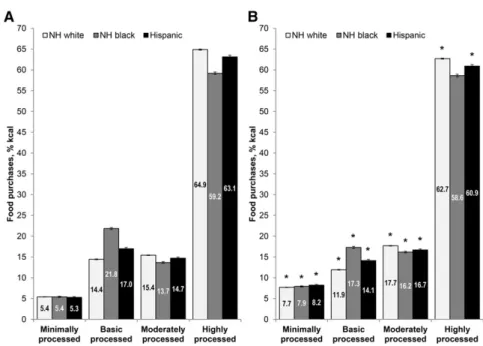
significantly associated with the proportion of calories
pur-chased from basic processed and highly processed CPG foods
(
Figure 1
). Both black and Hispanic households had higher
purchases of basic processed foods and lower purchases
of highly processed foods, as a percentage of total calories
purchased, than white households in all years between 2000 and
2012. In 2012, the calorie contribution of highly processed
foods to purchases was 4.1% kcal lower (
P
< 0.001) among
black than among white households, despite small but
signifi-cant declines in the calorie contribution of these products
between 2000 and 2012 among white but not black households.
The black-white difference was significantly larger among
low-income households (b
=
2
4.9% kcal) than among high-income
households (
b
=
2
3.7% kcal) (Supplemental Figures 1–4). In
contrast, the proportion of calories purchased from basic
processed foods was 5.4% kcal higher (
P
< 0.001) among black
households than among white households. Again, the
black-white difference was significantly greater among low-income
households (
b
= 6.1% kcal) than among high-income
house-holds (b
= 4.8% kcal) (Supplemental Figures 1–4).
In terms of calories purchased per person, highly processed
food purchases were 95 kcal/d lower among blacks and 82 kcal/d
lower among Hispanics than among whites in 2012 (
Table 1
).
Lower purchases of grain-based desserts, candy, salty snacks,
and dairy-based desserts among black and Hispanic households
contributed to these differences. Differences in basic processed
food purchases included greater purchases of cooking oil and
rice among blacks and Hispanics and higher purchases of
granu-lated sugar among blacks than among whites.
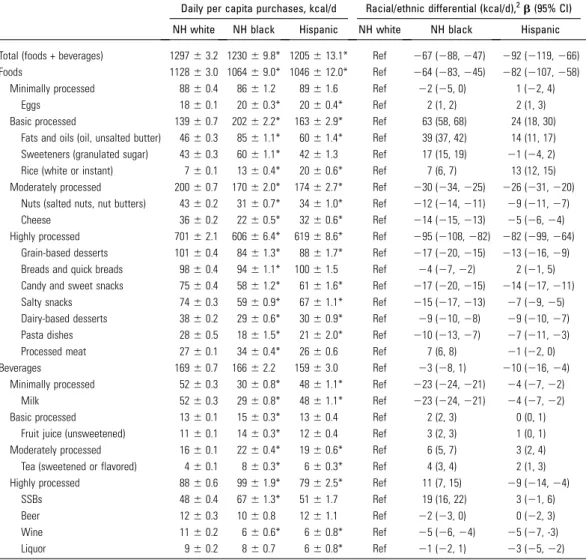
TABLE 1 Daily per capita CPG purchases of top food groups contributing to racial/ethnic differentials in processed food purchases among US households by race/ethnicity: Homescan Panel 20121
Daily per capita purchases, kcal/d Racial/ethnic differential (kcal/d),2b(95% CI)
NH white NH black Hispanic NH white NH black Hispanic
Total (foods + beverages) 129763.2 123069.8* 1205613.1* Ref 267 (288,247) 292 (2119,266)
Foods 112863.0 106469.0* 1046612.0* Ref 264 (283,245) 282 (2107,258)
Minimally processed 8860.4 8661.2 8961.6 Ref 22 (25, 0) 1 (22, 4)
Eggs 1860.1 2060.3* 2060.4* Ref 2 (1, 2) 2 (1, 3)
Basic processed 13960.7 20262.2* 16362.9* Ref 63 (58, 68) 24 (18, 30)
Fats and oils (oil, unsalted butter) 4660.3 8561.1* 6061.4* Ref 39 (37, 42) 14 (11, 17) Sweeteners (granulated sugar) 4360.3 6061.1* 4261.3 Ref 17 (15, 19) 21 (24, 2)
Rice (white or instant) 760.1 1360.4* 2060.6* Ref 7 (6, 7) 13 (12, 15)
Moderately processed 20060.7 17062.0* 17462.7* Ref 230 (234,225) 226 (231,220) Nuts (salted nuts, nut butters) 4360.2 3160.7* 3461.0* Ref 212 (214,211) 29 (211,27)
Cheese 3660.2 2260.5* 3260.6* Ref 214 (215,213) 25 (26,24)
Highly processed 70162.1 60666.4* 61968.6* Ref 295 (2108,282) 282 (299,264)
Grain-based desserts 10160.4 8461.3* 8861.7* Ref 217 (220,215) 213 (216,29)
Breads and quick breads 9860.4 9461.1* 10061.5 Ref 24 (27,22) 2 (21, 5)
Candy and sweet snacks 7560.4 5861.2* 6161.6* Ref 217 (220,215) 214 (217,211)
Salty snacks 7460.3 5960.9* 6761.1* Ref 215 (217,213) 27 (29,25)
Dairy-based desserts 3860.2 2960.6* 3060.9* Ref 29 (210,28) 29 (210,27)
Pasta dishes 2860.5 1861.5* 2162.0* Ref 210 (213,27) 27 (211,23)
Processed meat 2760.1 3460.4* 2660.6 Ref 7 (6, 8) 21 (22, 0)
Beverages 16960.7 16662.2 15963.0 Ref 23 (28, 1) 210 (216,24)
Minimally processed 5260.3 3060.8* 4861.1* Ref 223 (224,221) 24 (27,22)
Milk 5260.3 2960.8* 4861.1* Ref 223 (224,221) 24 (27,22)
Basic processed 1360.1 1560.3* 1360.4 Ref 2 (2, 3) 0 (0, 1)
Fruit juice (unsweetened) 1160.1 1460.3* 1260.4 Ref 3 (2, 3) 1 (0, 1)
Moderately processed 1660.1 2260.4* 1960.6* Ref 6 (5, 7) 3 (2, 4)
Tea (sweetened or flavored) 460.1 860.3* 660.3* Ref 4 (3, 4) 2 (1, 3)
Highly processed 8860.6 9961.9* 7962.5* Ref 11 (7, 15) 29 (214,24)
SSBs 4860.4 6761.3* 5161.7 Ref 19 (16, 22) 3 (21, 6)
Beer 1260.3 1060.8 1261.1 Ref 22 (23, 0) 0 (22, 3)
Wine 1160.2 660.6* 660.8* Ref 25 (26,24) 25 (27, -3)
Liquor 960.2 860.7 660.8* Ref 21 (22, 1) 23 (25,22)
1Values are adjusted mean6SE daily per capita household purchases of selected food groups within categories of processing unless
otherwise indicated;n= 59,286 households (n= 47,833 NH white,n= 5485 NH black, andn= 3069 Hispanic households; results for ‘‘other races/ethnicities’’ not shown). *Different from NH white,P,0.001 (Wald test). For food groups with,15% nonconsumers, values were determined from linear regression models, regressing purchases (kcal/d) on race/ethnicity; for food groups with.15% nonconsumers, values were determined from a 2-part model including1) a probit model of the probability of purchasing and2) linear regression of the amount purchased. All models were adjusted for education, income, household composition, number of household members in each age and sex category, and geographic market. CPG, consumer packaged goods; NH, non-Hispanic; Ref, reference group; SSB, sugar-sweetened beverage.
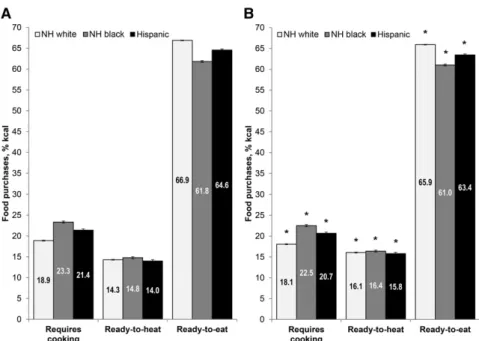
By level of convenience, both black and Hispanic households
had higher CPG purchases of foods requiring cooking and lower
purchases of RTE foods, as a percentage of calories purchased,
than white households (
Figure 2
). In 2012, the contribution to
food purchases from products requiring cooking was 4.5% kcal
higher (
P
< 0.001) and the contribution from RTE food purchases
was 4.9% kcal lower (
P
< 0.001) among black than among white
households.
Purchases of foods requiring cooking were 46 kcal/d and
23 kcal/d higher and purchases of RTE foods were 97 kcal/d and
81 kcal/d lower among blacks and Hispanics, respectively, than
among whites in 2012 (
Table 2
). For both blacks and Hispanics,
lower purchases of candy, nuts, salty snacks, and grain-based
desserts contributed to differences in RTE food purchases. For
foods requiring cooking, blacks and Hispanics had greater
purchases of cooking oil and shortening, uncooked processed
meat (among blacks), and rice (among Hispanics) than whites.
For beverages, black households had a significantly higher
mean contribution of highly processed drinks to beverage
calories (7.1% kcal in 2012;
P
< 0.001) than whites, although
a significant decrease occurred between 2000 and 2012 for black
but not for white households (
Figure 3
). Furthermore, the caloric
share of minimally processed beverages was 11.3% kcal lower
(
P
< 0.001) among black than among white households. Higher
SSB and lower plain milk purchases among blacks were the
primary contributors to caloric differences in beverage
pur-chases across racial/ethnic subpopulations (Table 1). In
supple-mental analyses that used purchases measured in grams rather
than calories, associations between race/ethnicity and processed
food, convenience food, and processed beverage purchases
exhibited similar patterns and directionality (
Supplemental
Figures 13–15
).
The adjusted median saturated fat content of total CPG food
and beverage purchases was significantly lower among black
(b
=
2
1.0%; 95% CI:
2
1.0%,
2
0.9%) and Hispanic
house-holds (
b
=
2
0.6%; 95% CI:
2
0.6%,
2
0.5%) than among white
households (
Figure 4
); racial/ethnic differences were greater at
the 90th percentile (b
=
2
1.4% for blacks and
b
=
2
0.8% for
Hispanics). Hispanics also had a significantly lower median
energy density of food purchases than whites (b
=
2
25 kcal/1000 g;
95% CI:
2
33,
2
17 kcal/1000 g). Conversely, compared with
whites, blacks had CPG purchases with significantly higher sugar
content at the median (b
= 2.2%; 95% CI: 2.0%, 2.3%) and 90th
percentile (b
= 3.0%; 95% CI: 2.8%, 3.3%) and higher energy
density at the median (
b
= 72 kcal/1000 g; 95% CI: 64,
79 kcal/1000 g) and 90th percentile (b
= 83 kcal/1000 g; 95%
CI: 72, 94 kcal/1000 g). After additional adjustment for processed
and convenience food purchases, these associations between
race/ethnicity and the nutrient content of CPG purchases were
attenuated (>10% change-in-estimate) for saturated fat and
sugar but not for energy density; however, all associations
remained significant.
Discussion
By using data from a large panel of US households and
product-specific nutrient information for >1.2 million items, this study
provides evidence that black and Hispanic households had
significantly lower CPG purchases of highly processed and RTE
foods and higher purchases of basic processed foods (e.g.,
cooking oil and sugar) and foods requiring cooking than white
households in multivariable models adjusted for income and
education. Racial/ethnic differentials in processed and
conve-nience food purchases were observed when measured as a
percent-age of calories purchased or as absolute calories purchased per
person per day. Differences were stable over time. Despite these
similarities in purchases among minority households, when
compared with white households, Hispanic households had
CPG purchases with lower saturated fat and energy density,
whereas black households had purchases with higher sugar and
energy density. Adjustment for differences in the degree of
processing and convenience of purchases attenuated
associa-tions between race/ethnicity and the nutritional quality of CPG
food and beverage purchases, but these inequalities remained
significant.
In our sample, black and Hispanic households had the
lowest purchases of highly processed and RTE foods, including
grain-based desserts, candy, and salty snacks, consistently
from 2000 to 2012. Only one previous US study has investigated
racial/ethnic differences in highly processed food intakes (41).
Similar to our results, Eicher-Miller et al. (41) found that blacks
and Hispanics had lower intakes of highly processed foods than
whites in cross-sectional analysis of NHANES 2003–2008 data.
To the best of our knowledge, no previous US studies have
examined racial/ethnic differences in purchases or intake of
convenience foods.
Black households had a striking contrast in purchasing
pat-terns of foods compared with beverages: these households had the
highest purchases of highly processed beverages but the lowest
purchases of highly processed foods as percentages of calories
purchased. Our findings are consistent with the higher
consump-tion of SSBs previously reported among blacks than among whites
(42, 43). We also found lower relative purchases of minimally
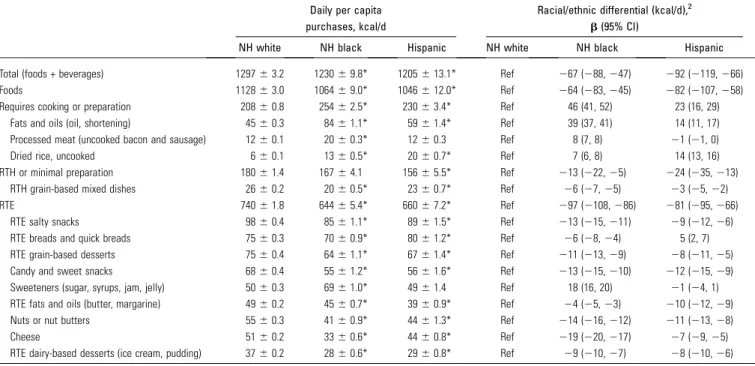
TABLE 2 Daily per capita CPG purchases of top food groups contributing to racial/ethnic differentials in convenience food purchases among US households by race/ethnicity: Homescan Panel 20121Daily per capita purchases, kcal/d
Racial/ethnic differential (kcal/d),2 b(95% CI)
NH white NH black Hispanic NH white NH black Hispanic
Total (foods + beverages) 129763.2 123069.8* 1205613.1* Ref 267 (288,247) 292 (2119,266)
Foods 112863.0 106469.0* 1046612.0* Ref 264 (283,245) 282 (2107,258)
Requires cooking or preparation 20860.8 25462.5* 23063.4* Ref 46 (41, 52) 23 (16, 29)
Fats and oils (oil, shortening) 4560.3 8461.1* 5961.4* Ref 39 (37, 41) 14 (11, 17)
Processed meat (uncooked bacon and sausage) 1260.1 2060.3* 1260.3 Ref 8 (7, 8) 21 (21, 0)
Dried rice, uncooked 660.1 1360.5* 2060.7* Ref 7 (6, 8) 14 (13, 16)
RTH or minimal preparation 18061.4 16764.1 15665.5* Ref 213 (222,25) 224 (235,213)
RTH grain-based mixed dishes 2660.2 2060.5* 2360.7* Ref 26 (27,25) 23 (25,22)
RTE 74061.8 64465.4* 66067.2* Ref 297 (2108,286) 281 (295,266)
RTE salty snacks 9860.4 8561.1* 8961.5* Ref 213 (215,211) 29 (212,26)
RTE breads and quick breads 7560.3 7060.9* 8061.2* Ref 26 (28,24) 5 (2, 7)
RTE grain-based desserts 7560.4 6461.1* 6761.4* Ref 211 (213,29) 28 (211,25)
Candy and sweet snacks 6860.4 5561.2* 5661.6* Ref 213 (215,210) 212 (215,29)
Sweeteners (sugar, syrups, jam, jelly) 5060.3 6961.0* 4961.4 Ref 18 (16, 20) 21 (24, 1)
RTE fats and oils (butter, margarine) 4960.2 4560.7* 3960.9* Ref 24 (25,23) 210 (212,29)
Nuts or nut butters 5560.3 4160.9* 4461.3* Ref 214 (216,212) 211 (213,28)
Cheese 5160.2 3360.6* 4460.8* Ref 219 (220,217) 27 (29,25)
RTE dairy-based desserts (ice cream, pudding) 3760.2 2860.6* 2960.8* Ref 29 (210,27) 28 (210,26)
1Values are adjusted mean6SE daily per capita household purchases of selected food groups within categories of convenience unless otherwise indicated;n= 59,286
households (n= 47,833 NH white,n= 5485 NH black, andn= 3069 Hispanic households; results for ‘‘other races/ethnicities’’ not shown). Beverages are not shown because.90% kcal are RTE. *Different from NH white,P,0.001 (Wald test). For food groups with,15% nonconsumers, values were determined from linear regression models, regressing purchases (kcal/d) on race/ethnicity; for food groups with.15% nonconsumers, values were determined from a 2-part model including1) a probit model of the probability of purchasing and2) linear regression of the amount purchased. All models were adjusted for education, income, household composition, number of household members in each age and sex category, and geographic market. CPG, consumer packaged goods; NH, non-Hispanic; Ref, reference group; RTE, ready-to-eat; RTH, ready-to-heat.
2Values are the difference in per capita household purchases between specified racial/ethnic group and NH white households.
processed beverages, primarily plain milk, among black than
among white households. In agreement, nationally
represen-tative studies reported lower calcium intake and prevalence of
meeting milk recommendations among blacks than among
whites (6, 7, 11).
After adjustment for differences in the processing and
con-venience level of purchases, associations with race/ethnicity
were attenuated only for saturated fat and sugar but not for
energy density; associations with race/ethnicity for saturated fat,
sugar, and energy density of purchases all remained significant.
This finding suggests that differences in purchasing of highly
processed and RTE foods and beverages are associated with,
but do not fully explain, racial/ethnic variation in the
nutri-tional quality of purchases. Although highly processed and RTE
foods have higher saturated fat, sugar, and sodium content, on
average, compared with less-processed foods or foods requiring
cooking, substantial variation exists in the nutrient content of
foods within all categories of processing and convenience (17).
For example, RTE foods include both precut bagged salad and
cookies. Thus, traditional and cultural variations in preferences
for certain foods, food combinations, and preparation methods
may have also contributed to the racial/ethnic differentials
in CPG purchases in our study, in beneficial or adverse ways
(5, 44). For example, for both black and Hispanic households, a
higher proportion of CPG food purchases required cooking or
preparation than for white households. However, Hispanic
households in our study had total CPG purchases with the most
favorable nutrient content, whereas black households had
purchases with the highest sugar and energy density among
racial/ethnic groups. Differences in the quality of home-prepared
meals or cooking methods across populations have been
suggested as explanations of why foods cooked at home may
not necessarily be more healthful than convenience foods (45–
48). Future efforts to improve disparities in the nutritional
quality of CPG purchases may need to consider factors other
than processing or convenience.
A key limitation of this study is that households do not report
whether all purchases were consumed, and the amount of food
waste may vary across races/ethnicities (49). Foods without
barcodes could not be scanned and linked to calories purchased,
so these non-CPG items were excluded from analyses. However,
in 2007–2011, a small subsample of households (
;
7500/y)
self-reported their expenditures on CPG and non-CPG purchases in
broad food categories. Non-CPG purchases contributed
;
22%
of dollars spent on store purchases (results not shown); however,
differences across racial/ethnic groups were small ($2–$4/mo)
and included differences in purchases of both minimally
processed items (random-weight fresh poultry) and highly
processed items (bakery products and store-prepared RTE or
ready-to-heat foods). Expenditures on non-CPG fruit and
vegetables were not significantly different among black
house-holds and were not meaningfully higher among Hispanic
households (1%) than among white households. Because of
likely variations across racial/ethnic groups in the types and the
kilocalories per dollar of items purchased within these broad
non-CPG food categories, future studies are needed to determine
how non-CPGs add to the racial/ethnic differences we observed
for CPG purchases. In addition, households did not report foods
purchased away-from-home, which differs by race/ethnicity and
may also contribute to disparities (50). Therefore, our findings
apply only to purchases of packaged goods and may not be
generalizable to total diet. However, as noted above, our
results are consistent with the previous study of intake (41).
The black-white difference in highly processed food was
;
100 kcal/d in that study of dietary intake and in our study of
purchases (41). Although misreporting is possible, the accuracy of
the Homescan data is comparable to other commonly used
economic data sets (36).
Findings from our sample may not be generalizable to the US
population because of potential selection bias or nonresponse
related to participant burden (37). Because our sample of
relatively high-income households is not nationally
representa-tive and the distribution of income across racial/ethnic groups does
not match that of the US population, all models were adjusted
for income; results were interpreted with caution as associations
between purchases and race/ethnicity independent of income,
which potentially might reflect differences in food preferences,
time constraints, or cultural traditions. Despite
underrepresen-tation in the total sample of
;
34,000–60,000 households/y,
low-income households were included in our sample in sufficient
numbers ($275 Hispanic and
$530 black household/y) to
ensure valid statistical estimates. Furthermore, we examined
interactions of race/ethnicity and income in supplemental
analyses and found similar associations between race/ethnicity
and purchases in all income groups. We were unable to
subdi-vide racial/ethnic groups by cultural heritage; combining
heter-ogeneous populations into a single category may obscure dietary
differences (4). We had insufficient information to identify
Asian, American Indian, Alaska Native, Native Hawaiian, or
Pacific Islander households and could not examine purchases for
these understudied populations. We examined if processing and
convenience were statistical explanatory correlates of
associa-tions between race/ethnicity and the nutritional profile of
purchases, but causality cannot be inferred from this
observa-tional study.
A major strength of our study is the use of objective scanning
of product barcodes, which may be advantageous for
moni-toring racial/ethnic differences in the diet because of
differen-tial underreporting among subpopulations (25–27, 30). The
use of item-specific nutrition information may improve
accur-acy by capturing ethnic variation in preferred products (28–30).
Strengths and weaknesses of this and other classification
sys-tems for food processing and convenience have been discussed
previously; our categorization is based on the top-rated NOVA
system (16, 17).
In conclusion, our findings suggest that highly processed
and RTE food and beverage purchases as well as purchases of
basic processed foods requiring home cooking vary greatly
across racial/ethnic groups in the United States. Our results
suggest that processing and convenience cannot fully explain
racial/ethnic differences in the nutritional quality of CPG
food and beverage purchases. Our findings have major
implications for the foods and behaviors that future
inter-ventions or policy might target to improve racial/ethnic
disparities. Further investigation is warranted to examine
how purchasing patterns of basic processed foods used in
cooking among vulnerable populations may contribute to
disparities in diet and health.
Acknowledgments
We thank Anna Maria Siega-Riz and David Guilkey for their
contributions to review and improve this work. We also thank
Donna Miles and Kuo-Ping Li for exceptional assistance with
the data management and programming and Emily Yoon, Kevin
Mathias, Jessica Davis, Bridget Hollingsworth, Gregory Bricker,
and Julie Wandell for assistance in this effort. JMP, MAM,
and BMP designed the research; JMP analyzed the data; and
JMP, MAM, SWN, and BMP wrote the manuscript and had
responsibility for the final content. All authors read and approved
the final manuscript.
References
1. Flegal KM, Carroll MD, Kit BK, Ogden CL. Prevalence of obesity and trends in the distribution of body mass index among US adults, 1999– 2010. JAMA 2012;307:491–7.
2. Ogden CL, Carroll MD, Fryar CD, Flegal KM. Prevalence of obesity among adults and youth: United States, 2011–2014. NCHS Data Brief 2015;219:1–8.
3. Centers for Disease Control Prevention. CDC health disparities and inequalities report—United States, 2013. MMWR Morb Mortal Wkly Rep 2013;62:1–4.
4. Satia JA. Diet-related disparities: understanding the problem and accelerating solutions. J Am Diet Assoc 2009;109:610–5.
5. Kant AK, Graubard BI. Ethnicity is an independent correlate of biomarkers of micronutrient intake and status in American adults. J Nutr 2007;137:2456–63.
6. Kirkpatrick SI, Dodd KW, Reedy J, Krebs-Smith SM. Income and race/ ethnicity are associated with adherence to food-based dietary guidance among US adults and children. J Acad Nutr Diet 2012;112:624–35. 7. Hiza HA, Casavale KO, Guenther PM, Davis CA. Diet quality of
Americans differs by age, sex, race/ethnicity, income, and education level. J Acad Nutr Diet 2013;113:297–306.
8. OÕNeil CE, Nicklas TA, Keast DR, Fulgoni VL. Ethnic disparities among food sources of energy and nutrients of public health concern and nutrients to limit in adults in the United States: NHANES 2003– 2006. Food Nutr Res 2014;58:15784.
9. Drewnowski A, Rehm CD. Consumption of added sugars among US children and adults by food purchase location and food source. Am J Clin Nutr 2014;100:901–7.
10. Kant AK, Graubard BI. 20-Year trends in dietary and meal behaviors were similar in U.S. children and adolescents of different race/ethnicity. J Nutr 2011;141:1880–8.
11. Kant AK, Graubard BI, Kumanyika SK. Trends in black-white differ-entials in dietary intakes of U.S. adults, 1971–2002. Am J Prev Med 2007;32:264–72.
12. Wang DD, Leung CW, Li Y, Ding EL, Chiuve SE, Hu FB, Willett WC. Trends in dietary quality among adults in the United States, 1999 through 2010. JAMA Intern Med 2014;174:1587–95.
13. Fardet A, Rock E, Bassama J, Bohuon P, Prabhasankar P, Monteiro C, Moubarac JC, Achir N. Current food classifications in epidemiological studies do not enable solid nutritional recommendations for preventing diet-related chronic diseases: the impact of food processing. Adv Nutr 2015;6:629–38.
14. Mozaffarian D, Hao T, Rimm EB, Willett WC, Hu FB. Changes in diet and lifestyle and long-term weight gain in women and men. N Engl J Med 2011;364:2392–404.
15. Monteiro CA, Levy RB, Claro RM, Castro IR, Cannon G. A new classification of foods based on the extent and purpose of their processing. Cad Saude Publica 2010;26:2039–49.
16. Moubarac JC, Parra DC, Cannon G, Monteiro C. Food classification systems based on food processing: significance and implications for policies and actions—a systematic literature review and assessment. Curr Obes Rep 2014;3:256–72.
17. Poti JM, Mendez MA, Ng SW, Popkin BM. Is the degree of food processing and convenience linked with the nutritional quality of foods purchased by US households? Am J Clin Nutr 2015;101:1251–62. 18. Eicher-Miller HA, Fulgoni VL III, Keast DR. Contributions of processed
foods to dietary intake in the US from 2003–2008: a report of the Food and Nutrition Science Solutions Joint Task Force of the Academy of Nutrition and Dietetics, American Society for Nutrition, Institute of Food Technologists, and International Food Information Council. J Nutr 2012;142(Suppl):2065S–72S.
19. de Graaf C, Kok FJ. Slow food, fast food and the control of food intake. Nat Rev Endocrinol 2010;6:290–3.
20. Viskaal-van Dongen M, Kok FJ, de Graaf C. Eating rate of commonly consumed foods promotes food and energy intake. Appetite 2011;56:25–31.
21. Robinson E, Aveyard P, Daley A, Jolly K, Lewis A, Lycett D, Higgs S. Eating attentively: a systematic review and meta-analysis of the effect of food intake memory and awareness on eating. Am J Clin Nutr 2013;97:728–42.
23. Costa Louzada ML, Martins AP, Canella DS, Baraldi LG, Levy RB, Claro RM, Moubarac JC, Cannon G, Monteiro CA. [Ultra-processed foods and the nutritional dietary profile in Brazil.] Rev Saude Publica 2015;49:38.
24. Louzada ML, Baraldi LG, Steele EM, Martins AP, Canella DS, Moubarac JC, Levy RB, Cannon G, Afshin A, Imamura F, et al. Consumption of ultra-processed foods and obesity in Brazilian adoles-cents and adults. Prev Med 2015;81:9–15.
25. Murakami K, Livingstone MB. Prevalence and characteristics of misreporting of energy intake in US adults: NHANES 2003–2012. Br J Nutr 2015;114:1294–303.
26. Neuhouser ML, Tinker L, Shaw PA, Schoeller D, Bingham SA, Horn LV, Beresford SA, Caan B, Thomson C, Satterfield S, et al. Use of recovery biomarkers to calibrate nutrient consumption self-reports in the WomenÕs Health Initiative. Am J Epidemiol 2008;167:1247– 59.
27. Mossavar-Rahmani Y, Tinker LF, Huang Y, Neuhouser ML, McCann SE, Seguin RA, Vitolins MZ, Curb JD, Prentice RL. Factors relating to eating style, social desirability, body image and eating meals at home increase the precision of calibration equations correcting self-report measures of diet using recovery biomarkers: findings from the WomenÕs Health Initiative. Nutr J 2013;12:63.
28. Pennington JA, Stumbo PJ, Murphy SP, McNutt SW, Eldridge AL, McCabe-Sellers BJ, Chenard CA. Food composition data: the founda-tion of dietetic practice and research. J Am Diet Assoc 2007;107:2105– 13.
29. Signorello LB, Munro HM, Buchowski MS, Schlundt DG, Cohen SS, Hargreaves MK, Blot WJ. Estimating nutrient intake from a food frequency questionnaire: incorporating the elements of race and geographic region. Am J Epidemiol 2009;170:104–11.
30. Pechey R, Jebb SA, Kelly MP, Almiron-Roig E, Conde S, Nakamura R, Shemilt I, Suhrcke M, Marteau TM. Socioeconomic differences in purchases of more vs. less healthy foods and beverages: analysis of over 25,000 British households in 2010. Soc Sci Med 2013;92: 22–6.
31. Stern D, Poti JM, Ng SW, Robinson WR, Gordon-Larsen P, Popkin BM. Where people shop is not associated with the nutrient quality of packaged foods for any racial-ethnic group in the United States. Am J Clin Nutr 2016;103:1125–34.
32. Ludwig DS. Technology, diet, and the burden of chronic disease. JAMA 2011;305:1352–3.
33. Schulte EM, Avena NM, Gearhardt AN. Which foods may be addictive? The roles of processing, fat content, and glycemic load. PLoS One 2015;10:e0117959.
34. Alkerwi A, Crichton GE, Hebert JR. Consumption of ready-made meals and increased risk of obesity: findings from the Observation of Cardiovascular Risk Factors in Luxembourg (ORISCAV-LUX) Study. Br J Nutr 2015;113:270–7.
35. The Nielsen Company. Nielsen Homescan Consumer Panel. AuthorsÕ estimates/calculations based in part on US consumer-reported purchase data from Nielsen through its Homescan Panel Service for all foods and beverages for the 675 week period ending December 30, 2012. Copyrightã2013, the Nielsen Company.
36. Einav L, Leibtag E, Nevo A. On the accuracy of Nielsen Homescan data. Washington (DC): USDA, Economic Research Service; 2008. 37. Lusk JL, Brooks K. Who participates in household scanning panels? Am
J Agric Econ 2011;93:226–40.
38. Muth M, Siegel P, Zhen C. ERS Data Quality Study Design. Research Triangle Park (NC): RTI International; 2007.
39. Slining MM, Ng SW, Popkin BM. Food companiesÕcalorie-reduction pledges to improve U.S. diet. Am J Prev Med 2013;44:174–84. 40. Hao L, Naiman DQ. Quantile regression. Thousand Oaks (CA): Sage
Publications; 2007.
41. Eicher-Miller HA, Fulgoni VL III, Keast DR. Energy and nutrient intakes from processed foods differ by sex, income status, and race/ ethnicity of US adults. J Acad Nutr Diet 2015;115:907–18.
42. Han E, Powell LM. Consumption patterns of sugar-sweetened bever-ages in the United States. J Acad Nutr Diet 2013;113:43–53. 43. Park S, Blanck HM, Sherry B, Brener N, OÕToole T. Factors associated
with sugar-sweetened beverage intake among United States high school students. J Nutr 2012;142:306–12.
44. Caprio S, Daniels SR, Drewnowski A, Kaufman FR, Palinkas LA, Rosenbloom AL, Schwimmer JB. Influence of race, ethnicity, and culture on childhood obesity: implications for prevention and treat-ment. Obesity (Silver Spring) 2008;16:2566–77.
45. Rollins BY, Belue RZ, Francis LA. The beneficial effect of family meals on obesity differs by race, sex, and household education: the National Survey of ChildrenÕs Health, 2003–2004. J Am Diet Assoc 2010;110:1335–9. 46. Sen B. Frequency of family dinner and adolescent body weight status:
evidence from the national longitudinal survey of youth, 1997. Obesity (Silver Spring) 2006;14:2266–76.
47. James DC. Factors influencing food choices, dietary intake, and nutrition-related attitudes among African Americans: application of a culturally sensitive model. Ethn Health 2004;9:349–67.
48. Kramer RF, Coutinho AJ, Vaeth E, Christiansen K, Suratkar S, Gittelsohn J. Healthier home food preparation methods and youth and caregiver psychosocial factors are associated with lower BMI in African American youth. J Nutr 2012;142:948–54.
49. Buzby JC, Wells HF, Hyman JD. The estimated amount, value, and calories of postharvest food losses at the retail and consumer levels in the United States. Washington (DC): USDA, Economic Research Service; 2014. (Economic Information Bulletin 121.)