Open Forum Infectious Diseases
Open Forum Infectious Diseases®
Can Use of Viral Load Improve Norovirus Clinical
Diagnosis and Disease Attribution?
Kayoko Shioda,1,a Leslie Barclay,1 Sylvia Becker-Dreps,2 Filemon Bucardo-Rivera,3 Philip J. Cooper,4 Daniel C. Payne,1 Jan Vinjé,1 and Benjamin A. Lopman,1,5
1Division of Viral Diseases, National Center for Immunization and Respiratory Diseases, Centers for Disease Control and Prevention, Atlanta, Georgia; 2School of Medicine, University of North
Carolina at Chapel Hill; 3Department of Microbiology, National Autonomous University of León, Nicaragua; 4Facultad de Ciencias Médicas, de la Salud y de la Vida, Universidad Internacional del
Ecuador Quito; Institute of Infection and Immunity, St George’s University of London, United Kingdom; and 5Department of Epidemiology, Rollins School of Public Health, Emory University, Atlanta,
Georgia
Background. Real-time reverse-transcriptase polymerase chain reaction (RT-PCR) is the state-of-the-art diagnostic for nor-ovirus. Cycle threshold (Ct), an indicator of viral load, may be associated with symptomatic disease as well as demographic and outbreak characteristics.
Methods. Data on (1) outbreak and sporadic cases and (2) asymptomatic controls in the United States and Latin America were analyzed. With multivariate regression models, we assessed relationships between various factors and Ct values, and we calculated odds ratios (ORs) for the presence of symptoms and attributable fractions of norovirus. Receiver-operating characteristic analysis was performed to define an optimal Ct cutoff to identify disease-causing infections.
Results. Cycle threshold values were lower (ie, higher viral loads) among symptomatic cases (model-adjusted mean ± standard error: 25.3 ± 1.2) compared with asymptomatic controls (28.5 ± 1.4). Cycle threshold values were significantly different across age groups, norovirus genogroups, timing of specimen collection, outbreak settings, and transmission modes. Genogroup II (GII) Ct values were associated with presence of symptoms (OR = 1.1), allowing us to estimate that 16% of diarrheal disease was attributable to norovirus. The optimized Ct cutoff led to poor sensitivity and specificity for genogroup I and GII.
Conclusions. Cycle threshold values were associated with host, pathogen, and outbreak factors. Cycle threshold values may not effectively distinguish disease-causing infection for individual patients, but they are useful for epidemiological studies aiming to attribute disease.
Keywords. attributable fractions; cycle threshold; norovirus; real-time PCR; receiver-operating characteristic analysis.
Norovirus affects people from all age groups and is associated with approximately one fifth of acute gastroenteritis (AGE) cases worldwide [1]. The World Health Organization esti-mated that norovirus caused 684 million diarrheal illnesses and 212 000 deaths in 2010 [2]. Reverse-transcriptase polymerase chain reaction (RT-PCR) assays are the most commonly used diagnostic methods for surveillance, outbreak investigations, and research, and this has allowed for more robust estimates of the norovirus disease burden [3]. RT-PCR assays can detect norovirus at low levels in stool specimens (ie, high “analytical” sensitivity and specificity), and, because the virus can be shed for a prolonged period of time, the virus can be detected in
samples from asymptomatic individuals. Using RT-PCR, noro-virus can be detected in 7% of individuals without AGE symp-toms compared with 18% with sympsymp-toms [1]. Hence, detection of virus does not necessarily indicate that norovirus was a cause of disease, and the “clinical” sensitivity and specificity of RT-PCR assays (ie, identification of disease-causing etiology) are debatable.
The cycle threshold (Ct) value of real-time RT-PCR assays, which is the number of PCR cycles required for the fluores-cent signal to cross the threshold, has been used to determine disease etiology for some pathogens [4–6]. The Ct value is inversely proportional to the amount of viral nucleic acid in specimens (ie, lower Ct values indicate higher amount of virus), so it can be used as a proxy of viral load. For rotavirus A, symp-tomatic cases have significantly higher viral loads than asymp-tomatic controls, and the optimal Ct value cutoff can be selected to distinguish disease-causing infection [5, 6]. For norovirus, in contrast, studies showed the same/similar concentrations or detection rates between symptomatic cases and asymptomatic controls [7–9]. Even if there was a significant difference in nor-ovirus viral load between cases and controls, the distribution of viral load substantially overlapped [10–12]. Because of these issues, it is not clear whether higher concentrations of norovirus
M A J O R A R T I C L E
Published by Oxford University Press on behalf of Infectious Diseases Society of America 2017. This work is written by (a) US Government employee(s) and is in the public domain in the US. DOI: 10.1093/ofid/ofx131
Received 11 May 2017; editorial decision 14 June 2017; accepted 31 July 2017.
aPresent Affiliation: Department of Epidemiology of Microbial Diseases, Yale School of Public
Health, New Haven, [email protected]
Correspondence: K. Shioda, DVM, MPH, Division of Viral Diseases, National Center for Immunization and Respiratory Diseases, Centers for Disease Control and Prevention, 1600 Clifton Road NE, MS A-34, Atlanta, GA 30329 ([email protected]).
Presented in part: 32nd Annual Clinical Virology Symposium, Daytona Beach, FL; 2016 NoroCORE Stakeholder Meeting, Crystal City, VA.
represent symptomatic infection nor whether the norovirus Ct value should be considered for clinical diagnostic purposes.
In addition to individual clinical diagnoses, some studies have attempted to use Ct values to estimate attributable fraction (AF) of norovirus-related illness [13, 14]. However, it has been poorly understood how Ct values vary across host and patho-gen characteristics and outbreak and logistical factors, which could affect these attribution analyses.
To fill these gaps, we assessed how norovirus Ct values of human clinical specimens are associated with the presence of symptoms as well as demographic and outbreak characteris-tics. We also attempted to quantify an optimal cutoff for the Ct value to differentiate symptomatic from asymptomatic norovirus infections.
METHODS
Study Sources
We extracted laboratory and epidemiological data from 3 study sources (Supplementary Table 1). The first study source included data from norovirus outbreaks collected through CaliciNet, a national norovirus outbreak surveillance network of public health laboratories in the Unites States coordinated by the Centers for Disease Control and Prevention [15]. Outbreak specimens are tested by real-time RT-PCR for norovirus by CaliciNet certified laboratories. Positive specimens are gen-otyped by sequencing [16]. CaliciNet laboratories do not test specimens from asymptomatic controls.
The second study source constitutes data from 2 popula-tion-based studies conducted in Latin America. Becker-Dreps et al [17] tested stool specimens from sporadic diarrhea patients <5 years of age in randomly selected households in Nicaragua. They also collected stool specimens from healthy controls who were matched by sex, age group, and neighborhood with the diar-rhea cases. In Ecuador, Lopman et al [18] conducted a birth cohort study to estimate the incidence of norovirus gastroenteritis. They enrolled healthy children <2 weeks of age, and they routinely col-lected stool specimens from all children from birth to 3 years.
The third study source includes data from routine surveil-lance of AGE and healthy controls enrolled through the New Vaccine Surveillance Network (NVSN) from 2008 to 2012. Active, prospective surveillance methods have been previously published [19] and include enrollment of children <11 years of age having diarrhea and/or vomiting and seen in a hospi-tal, emergency department, or outpatient clinic in 1 of 7 large medical institutions throughout the United States. Healthy con-trols had no diarrhea or vomiting in the 2 weeks preceding their enrollment at well child visits at these medical institutions. Norovirus Real-Time Reverse-Transcriptase Polymearse Chain Reaction and Genotyping
All studies used the same norovirus real-time RT-PCR protocol as described previously [15, 17–19]. Positive samples were then genotyped by Sanger sequencing using conventional RT-PCR
products, and sequences were genotyped by comparing them with norovirus reference sequences [15].
Rotavirus Testing Methods
Stool samples were tested for rotavirus by RT-PCR or by a com-mercial enzyme immunoassay (Rotaclone; Meridian Bioscience or Oxoid, Cambridge, United Kingdom) in the Latin America studies and NVSN [17, 19].
Assessing Associations With Cycle Threshold Values
We built Poisson regression models to assess relationships between norovirus Ct values and demographic, clinical, and outbreak characteristics. We fit multivariate models to con-trol for potential confounders, because it has been known that demographic, clinical, and outbreak characteristics are closely related to each other. For example, many of the elderly, espe-cially women, live in long-term-care facilities where norovirus outbreaks frequently occur [20], and specimens may be col-lected earlier in these settings.
A total of 4 models were built for different objectives as described in Table 1. In the first model (Model 1), we included sex, age, presence of AGE symptoms, month of symptom onset, and norovirus genotype as independent variables. Because the date of symptom onset was unavailable for the symptomatic cases in the Ecuador dataset, month of specimen collection was used as a proxy of month of illness onset. For asymptomatic con-trols, month of specimen collection was used to indicate timing. Model 1 was fit with each of the 3 studies separately. In addition, it was fit with a combined dataset of these 3 studies including a “study” as a random effect and other factors as fixed effects. The second model (Model 2) was created by adding the timing of specimen collection (ie, days between symptom onset and spec-imen collection) to Model 1 to evaluate its relationship with nor-ovirus Ct values. Because asymptomatic controls did not have symptom onset, Model 2 was fit only with symptomatic cases in each study source as well as in the combined dataset, and the presence of AGE symptoms was removed from the model. The third model (Model 3) was created by adding outbreak charac-teristics (ie, transmission mode and outbreak setting) to Model 2 to assess how they are associated with norovirus Ct values. We fit Model 3 with outbreak data collected through CaliciNet. Lastly, the fourth model (Model 4) was built by adding rotavirus testing results to Model 1 to evaluate whether coinfection with rotavirus was associated with norovirus Ct values. Model 4 was fit with the Latin America studies and NVSN as well as a com-bined dataset of these 2. CaliciNet was not included in Model 4 because rotavirus testing results were not available. With these 4 models, we calculated adjusted means of norovirus Ct values in each subgroup using the pseudo-likelihood technique. We also performed all-possible pairwise comparisons of adjusted means using Tukey’s method, which correct for multiple testing [21].
When fitting these models, we could not include some records because of their missing information on variables. Most importantly,
50% of the records in the CaliciNet data were not used in the mod-els, mainly because of missing date of symptom onset (see Results). To see whether the missing data had any significant effects, we ran Model 1 with datasets created by multiple imputation and found that none of the estimates appreciably changed after imputation. Therefore, we used the models with only complete data. All analyses were performed with SAS 9.3 (SAS Institute, Cary, NC).
Association With Norovirus Disease and Attributable Fraction
We estimated odds ratios (ORs) from multivariate logistic regression models, where the outcome was case-control status and the predictor was an inverse measure of norovirus Ct value (Cq), which was calculated as follows: Cq=41-Ct value. For this analysis, Ct values for negative specimens (ie, specimens whose fluorescent signals did not cross the threshold by the last PCR cycle) were set to be 41 and their Cq values were set to be 0. To control for potential confounders, we included the detection of norovirus (positive vs negative), patients’ age, sex, and month of symptom onset in the model. Due to the sparse data, we removed variables by backward elimination (α = 0.05) and fit the model separately with each study. To attribute the proportion of AGE cases to norovirus in each study, we also calculated population AFs by summing attributions of norovi-rus-related illness across each of the Cq values.
AF AF Cq
OR
i i i
i
å
,where =Pr( |cases) *(1- 1 )where Pr(Cq casesi| ) is the proportion of ith Cq value among symptomatic cases. Confidence intervals (CIs) were estimated
by bootstrap with 1000 iterations. The models were run sep-arately for genogroup I (GI) and genogroup II (GII). The CaliciNet data were not included in these analyses, because all its data are from symptomatic subjects.
Receiver-Operating Characteristic Analysis
We performed receiver-operating characteristic (ROC) analy-sis with the aim of defining an optimal Ct cutoff to distinguish symptomatic norovirus infections and asymptomatic infections. We defined a reference positive group and reference negative group based on the presence of AGE symptoms and timing of specimen collection. Reference positive included specimens collected from symptomatic cases within 3 days of symptom onset. Reference negative included specimens collected from asymptomatic controls regardless of the timing of specimen collection. All specimens, including reference negatives, were positive for norovirus by real-time RT-PCR and confirmed by sequencing. We conducted ROC analyses separately for noro-virus GI and GII. The Youden index (sensitivity+specificity-1) was used to identify an optimal cutoff for the Ct value [22–24].
RESULTS
Our dataset included 12 875 clinical specimens from CaliciNet, 659 from the Latin America studies, and 3997 from NVSN. Of these, norovirus Ct values were reported for 12 039 (94%) in CaliciNet, 227 (34%) in the Latin America studies, and 644 (16%) in NVSN. The remaining was norovirus negative by real-time RT-PCR. Median age was 77 years in CaliciNet, 2 years in Table 1. Objectives and Variables, Study Sources, and Subjects Included in Four Multivariate Poisson Regression Models
Model Characteristics Model 1 Model 2 Model 3 Model 4
Objectives To assess how host and virus factors may affect norovirus Ct values
To assess how the timing of specimen collection may affect norovirus Ct values among symptomatic cases
To assess how outbreak charac-teristics may affect norovirus Ct values
To assess how rotavirus coin-fection may affect norovirus Ct values
Variables
Sex ✓ ✓ ✓ ✓
Age ✓ ✓ ✓ ✓
Presence of AGE symptoms ✓ ✓
Month of symptom onset ✓ ✓ ✓ ✓
Norovirus genotype (or genogroup)
✓ ✓ ✓ ✓
Days between symptom onset and specimen collection
✓ ✓
Transmission modes ✓
Outbreak setting ✓
Rotavirus testing result ✓
Study sources
CaliciNet ✓ ✓ ✓
Latin America studies ✓ ✓ ✓
NVSN ✓ ✓ ✓
Subjects Both symptomatic cases and asymptomatic controls
Symptomatic cases only Symptomatic cases only Both symptomatic cases and asymptomatic controls
Abbreviations: AGE, acute gastroenteritis; Ct, cycle threshold; NVSN, New Vaccine Surveillance Network.
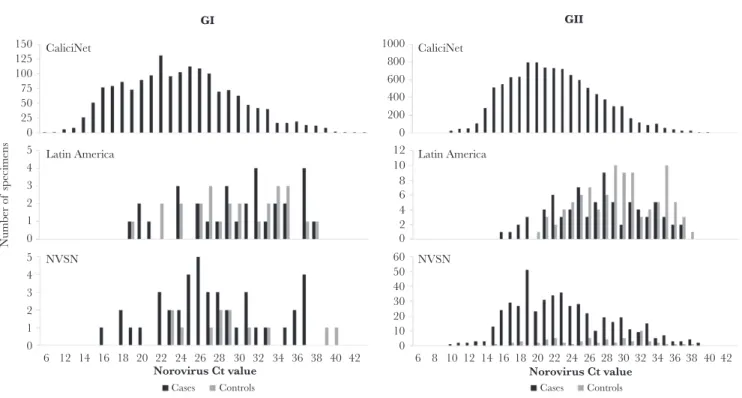
the Latin America studies, and 1 year in NVSN. Norovirus GI Ct values were lowest (median, 24; range, 6–43) in CaliciNet, followed by NVSN (median, 27; range, 16–40) and the Latin America studies (median, 29; range, 19–38) (Figure 1). For GII, CaliciNet (median, 22; range, 6–43) and NVSN (median, 22; range, 10–39) had lower Ct values compared with the Latin America studies (median, 28; range, 16–38). Lower Ct values were observed among symptomatic cases (GI: median 24, range 6–43; GII: median 22, range 6–43) compared with asympto-matic controls (GI: median 28, range 19–40; GII: median 28, range 15–38), but the distributions of Ct values substantially overlapped between the 2 groups (Figure 1).
Of 12 910 norovirus-positive specimens, Model 1 included 5989 (50%) from CaliciNet, 194 (85%) from the Latin America studies, and 585 (91%) from NVSN. The remaining records were not used in Model 1, because both norovirus GI and GII were detected by RT-PCR from the same specimens (n = 40), because of the missing information on the factors included in Model 1 (n = 6086), or both (n = 16).
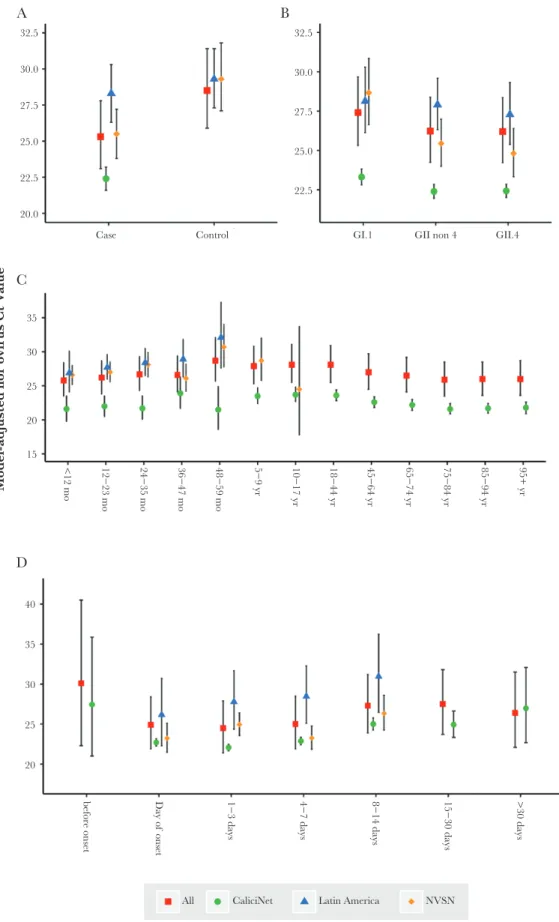
After controlling for other covariates, a number of factors were found to have significant associations with norovirus Ct val-ues. In Model 1 (Table 2), norovirus Ct values were significantly lower among symptomatic cases (model-adjusted mean ± stand-ard error: 25.3 ± 1.2) than asymptomatic controls (28.5 ± 1.4, P < .0001) (Figure 2A). Lower Ct values were found in specimens from young children and the elderly compared with the middle age group (P < .0001) (Figure 2C). We also found a significant
association between the month of illness onset and Ct value in the combined dataset (P = .03), but the difference was relatively small and not significant in the individual study sources (Supplementary Figure 1C and Supplementary Table 2). Variation in Ct values was observed across norovirus genotypes (P < .0001) (Supplementary Figure 1D); overall, specimens positive for norovirus GII had lower Ct values (26.2 ± 1.1) than specimens positive for GI (27.4 ± 1.1, P < .0001) (Figure 2B). We did not find any evidence of an asso-ciation of patients’ sex with Ct values (Supplementary Figure 1A). In Model 2 with symptomatic cases, the Ct values were sig-nificantly higher when specimens were collected >7 days after illness onset (range, 26.4−27.5), compared with those collected within 7 days (range, 24.5−25.0; P < .0001) (Table 3 and Figure 2D). In Model 3, specimens from outbreaks involving trans-mission by food or unknown/other modes had significantly lower Ct values (22.6 ± 0.7 and 22.8 ± 0.7, respectively) than those having person-to-person transmission (23.3 ± 0.6, Tukey-adjusted P < .05). Among all the different outbreak settings, specimens from cruise ship outbreaks had the lowest Ct values (20.8 ± 0.9). Healthcare facilities had lower Ct values (23.0 ± 0.9) than child care facilities (25.0 ± 1.0) and schools (24.5 ± 0.9, Tukey-adjusted P < .05). According to Model 4, coinfection with rotavirus was not significantly associated with the norovi-rus Ct value (Supplementary Figure 1B).
Norovirus GII Cq value was associated with presence of disease symptoms (OR = 1.13 (95% CI, 1.05–1.21) in Latin America and OR = 1.13 (95% CI, 1.08–1.18) in NVSN, Table 4
150 CaliciNet
Latin America
NVSN
CaliciNet
Latin America
NVSN 125
100 75 50 25
Number of
specimen
s 0
1000 800 600 400 200 0
0
0 10 20 30 40 50 60 2 4 6 8 10 12
0 1 2 3 4 5
0
6 12 14 16 18 20 22 24 26
Cases Controls
28 30
Norovirus Ct value
GI GII
32 34 36 38 40 42 6 8 10 12 14 16 18 20 22 24
Cases Controls
26 28
Norovirus Ct value30 32 343638 40 42
1 2 3 4 5
Figure 1. Distribution of norovirus Ct value by Study and by the presence of AGE symptoms. *Specimens infected with both GI and GII and specimens in which norovirus infection was not confirmed by sequencing are not included in these graphs. Abbreviations: AGE, acute gastroenteritis; NVSN, New Vaccine Surveillance Network; Ct value, cycle threshold value.
and Supplementary Figure 2), but GI Cq was not (OR = 1.01 (95% CI, 0.91–1.13) in Latin America and OR = 1.07 (95% CI, 0.95–1.21) in NVSN). Based on this relationship, 16.0% and 16.2% of diarrheal disease in the Latin America studies and NVSN, respectively, could be attributed norovirus GII.
According to the ROC analysis, the optimal Ct value cutoff with the highest Youden index was 26 for GI and 25 for GII (Figure 3 and Supplementary Table 3), but both sensitivity (GI, 73%; GII, 76%) and specificity (GI, 65%; GII, 68%) were poor.
DISCUSSION
We found that host (AGE symptoms and age), pathogen (nor-ovirus genotype), outbreak (transmission mode and setting), and logistical (timing of specimen collection) factors were significantly associated with norovirus real-time RT-PCR Ct values. The estimated mean Ct value was lower among symp-tomatic cases than controls, after controlling for other factors in the Poisson regression models. However, the distributions overlapped between the symptomatic and asymptomatic indi-viduals, and, therefore, there was no clear Ct value cutoff that differentiates symptomatic and asymptomatic infections with high clinical sensitivity and specificity.
We found higher Cq to be associated with disease symp-toms. Using the model coefficients, we were able to estimate the fraction of diarrhea that can be attributed to norovirus. As expected, these fractions (16.0% in the Latin America studies and 16.2% in NVSN) were lower than the prevalence of noro-virus (20.8% in the Latin America studies and 19.2% in NVS). Studies without healthy controls may be able to apply our esti-mated ORs to their Ct value data and calculate AFs of norovirus for their study.
Not only the presence of symptoms but also other factors were found to have significant associations with norovirus Ct values. Young children and the elderly had higher viral load than those from the middle age group potentially as a result of lack of prior exposures to norovirus among young children or immune senescence of the elderly. Most of the people in the middle age group, in contrast, might have some degree of acquired immunity against norovirus from previous exposure. The relationship between the timing of specimen collection and Ct value highlights the importance of early specimen collection for diagnostic purposes. The Ct values were significantly lower in specimens that were collected within 7 days after the symp-toms onset. This confirms the recommendations to collect stool samples as early as possible after onset of symptoms preferably within 1 week [25]. We found that GII-positive specimens had slightly lower Ct values compared with GI-positive samples, but overall Ct values varied across different genotypes even among viruses belonging to the same genogroups. This may be due to real differences between genotypes but more likely is caused by the difference in sensitivity of the PCR assays for the different genotypes, suggesting that the Ct values need to be interpreted Table 2. Mean Ct Values Estimated by the Multivariate Mixed-Effect
Poisson Regression Model (Model 1)
Characteristics
Number of
Specimens Mean Estimate (95% CI) P Value
Sex .06
Male 2548 26.7 (24.4–29.3)
Female 4220 27.0 (24.6–29.6)
Age group <.0001
<1 yr 260 25.8 (23.5–28.4)
1 to <2 yr 340 26.2 (23.8–28.7)
2 to <3 yr 174 26.7 (24.3–29.3)
3 to <4 yr 89 26.6 (24.1–29.4)
4 to <5 yr 36 28.7 (25.7–32.1)
5 to <10 yr 148 27.9 (25.3–30.8)
10 to <18 yr 149 28.1 (25.5–31.1)
18 to <45 yr 837 28.1 (25.5–30.9)
45 to <65 yr 907 27.0 (24.5–29.7)
65 to <75 yr 573 26.5 (24.1–29.2)
75 to <85 yr 1114 25.9 (23.5–28.5)
85 to <95 yr 1814 26.0 (23.6–28.5)
≥95 yr 327 26.0 (23.6–28.7)
Cases vs controls <.0001
Controls 173 28.5 (25.9–31.4)
Cases 6595 25.3 (23.1–27.8)
Month of onset .03
January 1274 26.7 (24.3–29.3)
February 1192 26.6 (24.2–29.1)
March 1076 26.9 (24.5–29.5)
April 597 26.6 (24.2–29.2)
May 414 27.5 (25.0–30.2)
June 235 26.6 (24.2–29.3)
July 196 27.3 (24.8–30.1)
August 120 26.6 (24.2–29.4)
September 159 26.7 (24.3–29.5)
October 218 27.8 (25.3–30.7)
November 457 26.3 (24.0–28.9)
December 830 26.7 (24.3–29.3)
Norovirus genotype <.0001
GI.1 11 30.9 (26.8–35.6)
GI.2 81 26.3 (23.9–29.0)
GI.3 371 25.6 (23.4–28.0)
GI.4 67 28.8 (26.1–31.9)
GI.5 45 30.5 (27.4–33.8)
GI.6 247 30.0 (27.4–32.8)
GI.7 39 23.3 (20.9–26.1)
GI.8 8 28.9 (24.6–33.9)
GI.9 4 33.6 (27.4–41.3)
GI untypeable 1 24.1 (15.4–37.8)
GII.1 331 28.4 (26.0–31.1)
GII.2 133 26.1 (23.7–28.6)
GII.3 84 26.2 (23.7–28.9)
GII.4_DenHaag 352 26.3 (24.0–28.8)
GII.4_NewOrleans 1825 26.6 (24.3–29.0)
GII.4_Osaka 14 27.6 (24.0–31.7)
GII.4_Sydney 2256 25.8 (23.6–28.2)
GII.4_Yerseke 2 23.0 (16.9–31.4)
GII.4_Untypeable 10 27.9 (23.9–32.6)
GII.5 27 28.6 (25.5–32.2)
GII.6 382 24.9 (22.8–27.3)
GII.7 167 24.3 (22.1–26.6)
GII.8 3 24.6 (18.9–32.1)
GII.12 108 28.7 (26.1–31.6)
GII.13 75 24.0 (21.8–26.6)
GII.14 34 23.9 (21.4–26.7)
GII.15 1 18.3 (11.1–30.2)
GII.16 2 25.5 (18.6–34.8)
GII.17 26 24.9 (22.1–28.1)
GII.21 2 35.4 (27.1–46.2)
GII.23 6 30.0 (25.4–35.5)
Unable to confirm 54 33.4 (30.3–36.9)
Abbreviations: CI, confidence interval; Ct, cycle threshold; GI, genogroup I; GII, genogroup II.
32.5
30.0
27.5
25.0
22.5
20.0
15 20
Model-adjusted nor o
vir
us Ct V
alue
25 30 35
A B
C
D
40
<12 mo 12−23 mo 24−35 mo 36−47 mo 48−59 mo 5−9 yr 10−17 yr 18−44 yr 45−64 yr 65−74 yr 75−84 yr 85−94 yr 95+ yr
15−30 days
8−14 days
4−7 days
1−3 days
Day of
onset
All CaliciNet Latin America NVSN
before onset >30 days
35
30
25
20
32.5
30.0
27.5
25.0
22.5
Case Control GI.1 GII non 4 GII.4
Figure 2. Distribution of norovirus Ct values estimated by the multivariate Poisson regression models. Dots represent point estimates of the model-adjusted norovirus Ct values, and bars represent their 95% CIs. A: Presence of AGE symptoms (Model 1); B: Norovirus genogroups (Model 1); C: Patient age (Model 1); D: Timing of specimen collection (Model 2). Abbreviations: Ct value, cycle threshold value; CI, confidence interval; NVSN, New Vaccine Surveillance Network; GI, genogroup I; GII, genogroup II; mo, months; yr, year..
carefully. Another explanation could be that the Ct differences can be attributed to differences in genetic susceptibility against the different genotypes [26, 27].
Significant relationships were also found between the out-break characteristics and Ct values. Samples from cruise ship norovirus outbreaks had the lowest Ct value among all out-break settings even after controlling for age and the timing of specimen collection. We cannot see a biological basis for lower Ct values in this setting, so we suspect that other unmeasured issues with specimen collection and storage quality may be residually cofounding this association. In addition, foodborne outbreaks were found to have lower Ct values compared with person-to-person outbreaks. A potential hypothesis of this finding is that individuals are exposed to higher dose of viruses in foodborne outbreaks compared with person-to-person out-breaks. However, even if exposure doses are higher, a human Table 3. Mean Ct Values Estimated by the Multivariate Mixed-Effect
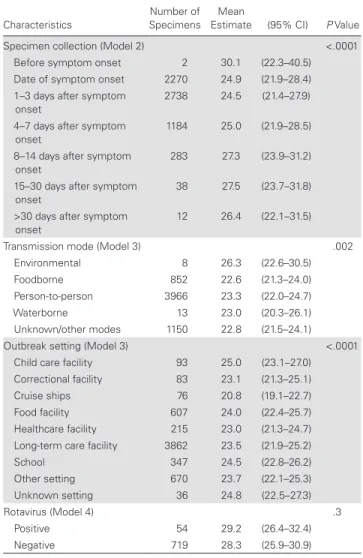
Poisson Regression Model by Timing of Specimen Collection, Outbreak Characteristics, and Rotavirus Coinfection (Model 2–4)
Characteristics SpecimensNumber of Estimate (95% CI)Mean P Value Specimen collection (Model 2) <.0001 Before symptom onset 2 30.1 (22.3–40.5) Date of symptom onset 2270 24.9 (21.9–28.4) 1–3 days after symptom
onset
2738 24.5 (21.4–27.9)
4–7 days after symptom onset
1184 25.0 (21.9–28.5)
8–14 days after symptom onset
283 27.3 (23.9–31.2)
15–30 days after symptom
onset 38 27.5 (23.7–31.8) >30 days after symptom
onset 12 26.4 (22.1–31.5) Transmission mode (Model 3) .002 Environmental 8 26.3 (22.6–30.5) Foodborne 852 22.6 (21.3–24.0) Person-to-person 3966 23.3 (22.0–24.7) Waterborne 13 23.0 (20.3–26.1) Unknown/other modes 1150 22.8 (21.5–24.1) Outbreak setting (Model 3) <.0001 Child care facility 93 25.0 (23.1–27.0) Correctional facility 83 23.1 (21.3–25.1) Cruise ships 76 20.8 (19.1–22.7) Food facility 607 24.0 (22.4–25.7) Healthcare facility 215 23.0 (21.3–24.7) Long-term care facility 3862 23.5 (21.9–25.2) School 347 24.5 (22.8–26.2) Other setting 670 23.7 (22.1–25.3) Unknown setting 36 24.8 (22.5–27.3)
Rotavirus (Model 4) .3
Positive 54 29.2 (26.4–32.4) Negative 719 28.3 (25.9–30.9)
Abbreviations: CI, confidence interval; Ct, cycle threshold.
Table 4. Association Between the Pathogen Quantity and Presence of Symptoms and Attributable Fractionsa
Norovirus Genogroup and Study
Odds Ratios per 1-Unit Increase in
Cq Value (95% CI; P Value) Attributable Fractions Norovirus GI
Latin
America 1.01 (0.91–1.13; P = .8) 1.1% NVSN 1.07 (0.95–1.21; P = .3) 0.9% Norovirus GII
Latin
America 1.13 (1.05–1.21; P = .001) 16.0% NVSN 1.13 (1.08–1.18; P < .0001) 16.2%
Abbreviations: CI, confidence interval; Cq, inverse measure of norovirus Ct value which was calculated as Cq=41-Ct value; Ct, cycle threshold; GI, genogroup I; GII, genogroup II; NVSN, New Vaccine Surveillance Network.
aAll models except GI in the Latin America studies controlled for the detection of
norovi-rus (positive vs negative), patients’ age, sex, and month of symptom onset. The model for GI in the Latin America studies included the detection of norovirus and month of symp-tom onset after backward elimination.
1.0 GI
0.9 0.8 0.7 0.6 0.5
Sensitivity 0.4 0.3 0.2 0.1 0.0
0.0 0.2 0.4 0.6
Optimal Ct cut-off: 26 Youden Index: 0.39 Sensitivity: 0.73 Specificity: 0.65 AUC: 0.75
0.8 1.0
1.0 GII
0.9 0.8 0.7 0.6 0.5 0.4 0.3 0.2 0.1 0.0
0.0 0.2 0.4 0.6
Optimal Ct cut-off: 25 Youden Index: 0.44 Sensitivity: 0.76 Specificity: 0.68 AUC: 0.78
0.8 1.0
1 - Specificity
Figure 3. Receiver-operating characteristic plots for norovirus genogroup I and genogroup II. Abbreviations: GI, genogroup I; GII, genogroup II.
challenge study is not supportive of an association between inoculum dose and viral shedding [28]. Therefore, these find-ings might be attributable to other unadjusted factors, such as investigation methods (eg, more intense investigations might be implemented for foodborne outbreaks). Further studies are needed to confirm these hypotheses.
An important limitation of our study is that comparing data generated in different laboratories (eg, 32 different CaliciNet lab-oratories are currently certified) may have affected the Ct data. To address this issue, all staff completed standardized training to become certified to perform the norovirus assays, and labo-ratories are biennially validated by having them complete a pro-ficiency panel. In addition, mixed-effect models have accounted for correlation among specimens tested in each study. However, these approaches do not perfectly solve the issue. Another limi-tation is that we could not assess a relationship between Ct val-ues and clinical severity due to the lack of detailed clinical data. A strength of our study is the large sample size, which allowed us to include a number of variables into the models in an attempt to identify the independent effects of host, pathogen, outbreak, and logistical factors. As a result, we found that each of these factors was independently associated with norovirus Ct values after adjustment. The large sample size also helped us identify subtle differences in the Ct value across subgroups, which could have been missed if we had smaller populations.
CONCLUSIONS
In conclusion, we found that the Ct values were associated with presence of symptoms as well as various host, pathogen, out-break, and logistical factors. The difference in Ct values was subtle and did not lend itself to discriminatory cutoff values for clinical diagnosis of individual specimens; however, those char-acteristics associated with Ct values could be taken into account for evaluating disease burden or incidence of norovirus.
Supplementary Data
Supplementary materials are available at Open Forum Infectious Diseases
online. Consisting of data provided by the authors to benefit the reader, the posted materials are not copyedited and are the sole responsibility of the authors, so questions or comments should be addressed to the corre-sponding author.
Acknowledgments
We thank the CaliciNet-certified laboratories and the New Vaccine Surveillance Network contributors for support.
Disclaimer. The findings and conclusions presented in this paper are
of the authors and do not necessarily represent the Centers for Disease Control and Prevention.
Financial support. This work was supported by an appointment to
the Research Participation Program at the Centers for Disease Control and Prevention (CDC) administered by the Oak Ridge Institute for Science and Education through an interagency agreement between the US Department of Energy and CDC to (to K. S.). Data and sample collection in Ecuador were funded by Wellcome Trust (Grant 088862/Z/09/Z; to P. C.). The fol-lowing funding sources were put together for the study in Nicaragua: the Merck Investigator-Initiated Studies Program for laboratory analysis; the
Thrasher Research Fund for field work; Grant 5K01TW008401-04 from the Fogarty International Center at the National Institutes of Health (to S. B.-D.); and NETROPICA (Grant 05-N-2010; to F. B.-R.).
Potential conflicts of interest. S. B.-D. has received research funding
from Investigator-Initiated Research Programs of Merck and Pfizer and has served as a consultant for Pfizer.
All authors have submitted the ICMJE Form for Disclosure of Potential Conflicts of Interest. Conflicts that the editors consider relevant to the con-tent of the manuscript have been disclosed.
References
1. Ahmed SM, Hall AJ, Robinson AE, et al. Global prevalence of norovirus in cases of gastroenteritis: a systematic review and meta-analysis. Lancet Infect Dis 2014; 14:725–30.
2. World Health Organization. WHO estimates of the global burden of foodborne diseases: foodborne disease burden epidemiology reference group 2007–2015. Available at: http://apps.who.int/iris/bitstream/10665/199350/1/9789241565165_ eng.pdf?ua=1. Accessed 2 October 2016.
3. Hall AJ, Lopman BA, Payne DC, et al. Norovirus disease in the United States. Emerg Infect Dis 2013; 19:1198–205.
4. Lindsay B, Ochieng JB, Ikumapayi UN, et al. Quantitative PCR for detection of Shigella improves ascertainment of Shigella burden in children with moder-ate-to-severe diarrhea in low-income countries. J Clin Microbiol 2013; 51:1740–6. 5. Phillips G, Lopman B, Tam CC, et al. Diagnosing rotavirus A associated IID: using
ELISA to identify a cut-off for real time RT-PCR. J Clin Virol 2009; 44:242–5. 6. Bennett A, Bar-Zeev N, Jere KC, et al. Determination of a viral load threshold to
distinguish symptomatic versus asymptomatic rotavirus infection in a high-dis-ease-burden African population. J Clin Microbiol 2015; 53:1951–4.
7. Zhang S, Chen TH, Wang J, et al. Symptomatic and asymptomatic infections of rotavirus, norovirus, and adenovirus among hospitalized children in Xi’an, China. J Med Virol 2011; 83:1476–84.
8. Barreira DM, Ferreira MS, Fumian TM, et al. Viral load and genotypes of noro-viruses in symptomatic and asymptomatic children in Southeastern Brazil. J Clin Virol 2010; 47:60–4.
9. Bucardo F, Nordgren J, Carlsson B, et al. Asymptomatic norovirus infections in Nicaraguan children and its association with viral properties and histo-blood group antigens. Pediatr Infect Dis J 2010; 29:934–9.
10. Phillips G, Lopman B, Tam CC, et al. Diagnosing norovirus-associated infectious intestinal disease using viral load. BMC Infect Dis 2009; 9:63.
11. Dung TT, Phat VV, Nga TV, et al. The validation and utility of a quantitative one-step multiplex RT real-time PCR targeting rotavirus A and norovirus. J Virol Method. 2013; 187:138–43.
12. Kabayiza JC, Andersson ME, Nilsson S, et al. Real-time PCR identification of agents causing diarrhea in Rwandan children less than 5 years of age. Pediatr Infect Dis J 2014; 33:1037–42.
13. Phillips G, Tam CC, Conti S, et al. Community incidence of norovirus-associated infectious intestinal disease in England: improved estimates using viral load for norovirus diagnosis. Am J Epidemiol 2010; 171:1014–22.
14. Platts-Mills JA, Babji S, Bodhidatta L, et al. Pathogen-specific burdens of commu-nity diarrhoea in developing countries: a multisite birth cohort study (MAL-ED). Lancet Glob Health 2015; 3:e564–75.
15. Vega E, Barclay L, Gregoricus N, et al. Novel surveillance network for norovirus gastroenteritis outbreaks, United States. Emerg Infect Dis 2011; 17:1389–95. 16. Vega E, Barclay L, Gregoricus N, et al. Genotypic and epidemiologic trends of
norovirus outbreaks in the United States, 2009 to 2013. J Clin Microbiol 2014; 52:147–55.
17. Becker-Dreps S, Bucardo F, Vilchez S, et al. Etiology of childhood diarrhea after rotavirus vaccine introduction: a prospective, population-based study in Nicaragua. Pediatr Infect Dis J 2014; 33:1156–63.
18. Lopman BA, Trivedi T, Vicuña Y, et al. Norovirus infection and disease in an ecuadorian birth cohort: association of certain norovirus genotypes with host FUT2 secretor status. J Infect Dis 2015; 211:1813–21.
19. Payne DC, Vinjé J, Szilagyi PG, et al. Norovirus and medically attended gastroen-teritis in U.S. children. N Engl J Med 2013; 368:1121–30.
20. Wikswo ME, Hall AJ. Outbreaks of acute gastroenteritis transmitted by per-son-to-person contact—United States, 2009–2010. MMWR Morb Mortal Wkly Rep 2012; 61:1–12.
21. Tukey JW. Comparing individual means in the analysis of variance. Biometrics 1949; 5:99–114.
22. Bewick V, Cheek L, Ball J. Statistics review 13: receiver operating characteristic curves. Crit Care 2004; 8:508–12.
23. Fluss R, Faraggi D, Reiser B. Estimation of the Youden Index and its associated cutoff point. Biom J 2005; 47:458–72.
24. Youden WJ. Index for rating diagnostic tests. Cancer 1950; 3:32–5.
25. Updated norovirus outbreak management and disease prevention guidelines. MMWR Recomm Rep 2011; 60:1–18.
26. Bucardo F, Kindberg E, Paniagua M, et al. Genetic susceptibility to symptomatic norovirus infection in Nicaragua. J Med Virol 2009; 81:728–35.
27. Kambhampati A, Payne DC, Costantini V, Lopman BA. Host genetic susceptibil-ity to enteric viruses: a systematic review and metaanalysis. Clin Infect Dis 2016; 62:11–8.