The handle http://hdl.handle.net/1887/42759
h
olds various files of this Leiden University
dissertation.
Author
: IJsseldijk, E.A. van
Title
: Model-based wear measurements in total knee arthroplasty : development and
validation of novel radiographic techniques
Model-based wear
measurements
in total knee arthroplasty
Development and validation of novel radiographic techniquesEmiel van IJsseldijk
ements in total knee arthr
measurements in total
knee arthroplasty
Development and validation of novel radiographic techniques
Emiel van IJsseldijk
E.A. van IJsseldijk
PhD thesis, Leiden University Medical Center, Leiden, The Netherlands © E.A. van IJsseldijk, Utrecht
Financial support for this thesis was given by Anna fonds
ISBN 978-90-9029866-5
Design: Grafisch Vormgever Jaap van der Heijden Printed by: GVO drukkers & vormgevers B.V.
measurements in total
knee arthroplasty
Development and validation of novel radiographic techniques
Proefschrift
ter verkrijging van
de graad van Doctor aan de Universiteit Leiden, op gezag van Rector Magnificus prof. mr. C.J.M.M. Stolker,
volgens besluit van het College voor Promoties te verdedigen op donderdag 1 september 2016
klokke 16:15
door
Emiel Arno van IJsseldijk
Copromotores
Dr.ir. B.L. Kaptein Dr. B.C. Stoel
Leden promotiecommissie
Prof.dr R.G.H.H. Nelissen
Prof.dr.ir. M.A. Viergever, Universitair Medisch Centrum Utrecht Prof.dr. M.G. Kloppenburg
1 Introduction 8 2 The robustness and accuracy of measuring the minimum joint space
width of total knee arthroplasty based on model-based RSA 22 3 A model-based approach to measure the minimum joint space width
of total knee arthroplasty in standard radiographs 36 4 Measuring the minimum joint space width in total knee arthroplasty by RSA 52 5 Validation of a model-based measurement of the minimum insert
thickness of total knee arthroplasty 66
6 Validation of the in vivo volumetric wear measurement for total knee
prostheses in model-based RSA 86
7 Three dimensional measurement of joint space narrowing in the
knee from stereo radiographs using statistical shape models 102
8 Discussion 122
9 Summary 136
10 Samenvatting 140
List of bibliography 142
Publications 152
Curriculum Vitae 154
Dankwoord 156
Introduction
1-1 Osteoarthritis of the knee
Osteoarthritis (OA) is a multi-factorial joint disease characterized by progressive degeneration of cartilage tissue thickening of the joint’s subchondral bone resulting in a painful and stiff joint with decreased limited mobility [1, 2]. Osteoarthritis is a disease on its own, but can also occur secondary to an inflammatory disease like rheumatoid arthritis, post-traumatic or after congenital or acquired limb deformities.
In 2011, approximately 594,000 Dutch inhabitants suffered from knee OA, which is approximately 4% of the total population [3]. Knee osteoarthritis affects especially elderly patients. In the Netherlands, the registered prevalence of this disease for patients over the age of 65 years was 6.4% and 11.2% for men and women respectively [3]. This is a major health care burden, resulting in 1.11 billion euros for the direct and indirect healthcare costs of osteoarthritis in the Netherlands alone in 2011. This is 1.2% of the total annual Dutch healthcare costs [4].
1-2 Total Knee Arthoplasty
Total Knee Arthroplasty (TKA) is an effective treatment for endstage symptomatic osteoarthritis [10, 11]. TKA is a surgical procedure in which the knee joint is replaced by a prosthesis consisting of a femoral component, a tibial component, a polyethylene insert facilitating the articulation between de femoral and tibial component and - in some cases - a patella component (Figure 1-1).
femoral component femur
tibia
insert component
tibial component
Figure 1-1. Illustration of a knee prosthesis and its components.
components have a close fit. Fixation of the components can be obtained either by applying bone-cement or by bone ingrowth.
Many different types and designs of knee prostheses are available, like posterior stabilized types, cruciate retaining types or rotating platform types. These types were developed to improve the kinematics or the stability of the prosthesis. Depending on the prosthesis type, the cruciate ligaments are resected or retained, the patella is resurfaced or not or additional collateral ligament balancing is required. As for rotating platform tibia components, this design allows for higher tibiofemoral conformity without undue kinematic constraint. Even though TKA is generally successful, implant failure remains a significant problem. National registries report a failure rate of 5% to 10% at 10 years after the initial surgical procedure, indicating revision surgery was required [9, 12, 13]. Revision surgeries are extensive procedures with higher intra- and post-operative risks. Moreover, revision TKAs have a higher risk of revision (i.e. re-revision) and lower patient satisfaction compared to primary TKAs [14]. Altogether, the impact of implant failure on patients and healthcare costs is substantial [12].
In line with the increase in the number of patients suffering from osteoarthritis of the knee, the incidence of TKAs is also expected to increase. Therefore, the impact of implant failure will increase as well. As implant failure is more frequent for younger, more active patients and the prevalence of TKAs for younger patients increases [14, 15], the impact of implant failure is aggravated further. In order to reduce patient consequences and the financial burden of TKA procedures, reduction of the number of implant failures is an important topic in both clinical and technical research.
1-3 Polyethylene wear
Wear particles ranging in size between 0.1 microns to 0.5 millimeter are released in the wear process. Especially the smaller particles can cause a local inflammatory reaction, which is associated with bone resorption around the TKA resulting in osteolysis and eventually aseptic loosening of the prosthesis [19, 20]. Aseptic loosening is an important failure mechanism as it is related to one out of every four revisions [21, 22].
Besides, TKA failure can occur for severe wear cases when metal to metal contact between the prosthesis elements occurs, resulting in an irreversibly damaged and non-functional prosthesis.
1-4 Relevance of measuring wear
It has been shown that the rate at which the remaining insert thickness decreases can predict TKA failure [23, 24]. For this reason, an accurate and precise method is required to assess the progression of polyethylene wear in vivo, which can be used to predict (future) instability and loosening and thereby support clinical decision making as to initiate a timely intervention or to decide which patients should be monitored more intensively. Timing is very important to minimize the burden of surgery for both the patient and the surgeon [12]. On the one hand, the surgical procedure should not be performed too soon as to prevent unneeded risks for patients. On the other hand, postponing the revision surgery may lead to an inferior outcome in case of high wear rates, due to the progressing osteolysis (reducing the bone stock available) and the increased inflammation related to wear debris.
1-5 Wear measurement techniques
In current clinical practice, weight-bearing planar radiographs are the clinical standard for the assessment of wear in vivo [27, 28]. In these images, the remaining polyethylene insert thickness is estimated using the minimum joint space width (mJSW) measurement, in which the apparent distance between the metal tibial tray and the femoral condyles is assessed [27, 29-31]. An example of an image with these reference objects is shown inFigure 1-2.
Figure 1-2. AP radiograph of a TKA with arrows indicating the lowest point of the femoral condyle (A) and the tibial tray (B), which are the reference points to assess the remaining insert thickness.
The conventional mJSW method is subject to parallax errors that occur when the metal tibial baseplate surface is not optimally aligned with the X-ray beam during
B
A
A
B
sequential radiographic assessments. Moreover, some design features such as a metal rim require manual adjustments of the conventional mJSW measurement method, rendering the method sensitive for human errors. Measurement errors of up to 2 mm are not exceptional and multiple follow-up visits are required to obtain a reliable estimation of the wear rate [28, 29, 31]. These errors seriously limit the application of this measurement method for the purpose of reliably monitoring patients or evaluating implant designs.
1-6 Model-based wear measurement
Radiographic measurement accuracy and precision can be improved by applying model-based techniques. Such techniques incorporate prior information of three-dimensional (3D) object geometry and are applied to enhance clinical decision making or surgical accuracy by using computer-guided navigation. Model-based techniques are also applied in Roentgen Stereophotogrammetric Analysis, a method used to predict implant loosening after TKA or Total Hip Arthroplasty [32-34]. Accuracy and precision of 3D pose reconstruction have proven to be very high for these model-based techniques, therefore rendering them pre-eminently suitable for in vivo wear measurements [32].
The application of model-based techniques to the mJSW measurement has several advantages. Measurements applied in 3D are less susceptible to parallax errors than direct measurements in projection images of standard radiographs. Moreover, these techniques can improve signal-to-noise ratio because more image information is used when matching complete components compared to selecting a single image point or image edge. Last, using 3D models provides additional measurement possibilities, such as the location of the mJSW.
which uses a-priori knowledge from a training set to fit unseen shapesbased on their plausibility. This model type has proven successful in matching shapes of the natural knee based on the limited information available in projection images [36-38].
The use of model-based techniques also introduces new challenges. Apart from the need for accurate 3D (prosthesis) models, it requires a 3D reconstruction in which the spatial relationship between the projection image and the 3D model is established. To accomplish this, reliable information on the image acquisition process should be available, such as the original focus (camera) position with respect to the image, the image pixel size and the image magnification. In case this information is missing or unreliable, the precision of positioning the 3D models can drop quickly.
Although model-based techniques have been applied for mJSW measurements, the accuracy and precision of these techniques have not been validated or validation has been restricted to individual prostheses or other imaging modalities such as fluoroscopy and calibrated stereo imaging[30, 39-43].
1-7 Aim of this thesis
The aim of this work is to improve the accuracy and precision with which mJSW measurements can be conducted in medical imaging. Hereto, this thesis focusses on the development, validation and clinical application of model-based mJSW measurements for the natural knee and TKAs. For TKAs the measurement is applied for both stereo-images and standard radiographs.
1-8 Structure
this volumetric wear measurement is analyzed by using both a phantom experiment and simulation studies.
Chapter 4 and 5 focus on the validation of the mJSW measurement in standard AP radiographs (i.e. mono images). In Chapter 4 a phantom study is used to perform this validation, which is equivalent to Chapter 1 for stereo-images. Ultimately, in vivo data are the most reliable basis to validate a measurement for clinical practice. In Chapter 5 a retrieval study is done to validate the measurement, in which the insert thickness measured in pre-revision images is compared to the actual insert thickness measured of the retrieved tibial inserts after revision.
Chapter 6 and 7 turn towards alternative model-based measurement techniques. In Chapter 6 the application of a volumetric wear measurement for knee prosthesis is considered and in Chapter 7 model-based techniques are applied to measure joint space narrowing in the natural knee. The accuracy and precision of the mJSW measurement of the knee using a Statistical Shape Model is compared to a conventional automated mJSW measurement.
Finally, Chapter 8 provides a general discussion and reflection on the improvement of the accuracy and precision with which mJSW measurements can be conducted in medical imaging. Also, directions for future work are described.
R
efeRences[1] Litwic, A., et al., Epidemiology and burden of osteoarthritis. British medical bulletin, 2013: p. lds038.
[2] Hellio Le Graverand, M.-P., et al., Radiographic grading and measurement of joint space width in osteoarthritis. Rheumatic diseases clinics of North America, 2009. 35: p. 485-502.
[3] Poos, M.J.J.C. and A.M. Gommer. Hoe vaak komt arthrose voor en hoeveel mensen sterven er aan? 2014 23 juni 2014; Available from: http://www. nationaalkompas.nl/gezondheid-en-ziekte/ziekten-en-aandoeningen/ bewegingsstelsel-en-bindweefsel/artrose.
[4] RIVM, Kosten van Ziektenstudie, 2013, RIVM.
grows rapidly among baby-boomers - a population-based study. Arthritis & Rheumatism, 2012. 64: p. 423-428.
[6] Kurtz, S.M., et al., Future young patient demand for primary and revision joint replacement: national projections from 2010 to 2030. Clinical Orthopaedics and Related Research, 2009. 467: p. 2606-12.
[7] Murphy, L., et al., Lifetime risk of symptomatic knee osteoarthritis. Arthritis Care & Research, 2008. 59(9): p. 1207-1213.
[8] Wyatt, S.B., K.P. Winters, and P.M. Dubbert, Overweight and obesity: prevalence, consequences, and causes of a growing public health problem.
The American Journal of the Medical Sciences, 2006. 331(4): p. 166-74. [9] Swedish Knee Registry, Anual report 2011. 28-08-2012 [cited 2012
August]; Available from: http://www.knee.nko.se/english/online/thePages/ publication.php.
[10] Quinet, R.J. and E.G. Winters, Total joint replacement of the hip and knee.
The Medical clinics of North America, 1992. 76(5): p. 1235-51.
[11] Carr, A.J., et al., Knee replacement. The Lancet, 2012. 379: p. 1331-1340. [12] Australian Orthopeadic Assocation National Joint Replacement Registry
Anual report 2011.
[13] New Zealand National Joint Registry Annual Report 2009.
[14] Robertsson, O., et al., Patient satisfaction after knee arthroplasty: a report on 27,372 knees operated on between 1981 and 1995 in Sweden. Acta Orthopaedica Scandinavica, 2000. 71: p. 262-7.
[15] Kurtz, S.M., et al., Prevalence of primary and revision hip and knee arthroplasty in the United States from 1990 through 2002. The Journal of Bone & Joint Surgery, 2005. 87(7): p. 1487-1497.
[16] Naudie, D.D.R., et al., Wear and osteolysis around total knee arthroplasty.
The Journal of the American Academy of Orthopaedic Surgeons, 2007. 15: p. 53-64.
[17] Schmalzried, T.P. and J.J. Callaghan, Current Concepts Review-Wear in Total Hip and Knee Replacements. The Journal of Bone & Joint Surgery, 1999.
81(1): p. 115-136.
[18] Lewis, G., Polyethylene wear in total hip and knee arthroplasties. Journal of Biomedical Materials Research, 1997. 38: p. 55-75.
replacement. Biomaterials, 2005. 26(11): p. 1271-86.
[20] Sundfeldt, M., et al., Aseptic loosening, not only a question of wear: a review of different theories. Acta Orthopaedica, 2006. 77: p. 177-97.
[21] Mulhall, K.J., et al., Current etiologies and modes of failure in total knee arthroplasty revision. Clinical Orthopaedics and Related Research, 2006.
446: p. 45-50.
[22] Sharkey, P.F., et al., Why are total knee arthroplasties failing today? Clinical Orthopaedics and Related Research, 2002. 404: p. 7-13.
[23] Engh, C.A., et al., Radiographically measured total knee wear is constant and predicts failure. The Journal of Arthroplasty, 2013.
[24] Pijls, B.G., H.M. Van der Linden-Van der Zwaag, and R.G. Nelissen,
Polyethylene thickness is a risk factor for wear necessitating insert exchange.
International Orthopaedics, 2012. 36(6): p. 1175-80.
[25] Dennis, D.A. and R.D. Komistek, Mobile-bearing total knee arthroplasty: design factors in minimizing wear. Clinical Orthopaedics and Related Research, 2006. 452: p. 70-7.
[26] Lavernia, C.J., et al., Activity level and wear in total knee arthroplasty: a study of autopsy retrieved specimens. The Journal of Arthroplasty, 2001.
16: p. 446-53.
[27] Miller, T.T., Imaging of knee arthroplasty. European Journal of Radiology, 2005. 54: p. 164-77.
[28] Collier, M.B., B.A. Jewett, and C.A. Engh, Clinical assessment of tibial polyethylene thickness comparison of radiographic measurements with as-implanted and as-retrieved thicknesses. The Journal of Arthroplasty, 2003.
18: p. 860-866.
[29] Collier, M.B., et al., Radiographic assessment of the thickness lost from polyethylene tibial inserts that had been sterilized differently. The Journal of Bone & Joint Surgery. American Volume, 2008. 90: p. 1543-52.
[30] Sanzén, L., et al., Radiographic wear assessment in a total knee prosthesis.
The Journal of Arthroplasty, 1996. 11: p. 738-42.
[32] Kaptein, B.L., et al., A new model-based RSA method validated using CAD models and models from reversed engineering. Journal of Biomechanics, 2003. 36: p. 873-882.
[33] Kaptein, B.L., et al., Clinical validation of model-based RSA for a total knee prosthesis. Clinical Orthopaedics and Related Research, 2007. 464: p. 205-9.
[34] Ryd, L., et al., Roentgen stereophotogrammetric analysis as a predictor of mechanical loosening of knee prostheses. The Journal of Bone & Joint Surgery. British Volume, 1995. 77: p. 377-83.
[35] Vignon, E., et al., Measurement of radiographic joint space width in the tibiofemoral compartment of the osteoarthritic knee: comparison of standing anteroposterior and Lyon schuss views. Arthritis & Rheumatism, 2003. 48: p. 378-84.
[36] Baka, N., et al., 2D-3D shape reconstruction of the distal femur from stereo X-Ray imaging using statistical shape models. Medical Image Analysis, 2011.
15(6): p. 840-850.
[37] Baka, N., et al., Correspondence free 3D statistical shape model fitting to sparse x-ray projections. SPIE, 2010: p. 76230D-76230D-9.
[38] Baldwin, M.a., et al., Development of subject-specific and statistical shape models of the knee using an efficient segmentation and mesh-morphing approach. Computer methods and programs in Biomedicine, 2010. 97: p. 232-40.
[39] Burckhardt, K., et al., Measuring orthopedic implant wear on standard radiographs with a precision in the 10 micrometer range. Medical Image Analysis, 2006. 10: p. 520-529.
[40] Duryea, J., et al., Fully automated software to monitor wear in prosthetic knees using fluoroscopic images. European Radiology, 2001. 11: p. 2184-7. [41] Fukuoka, Y., A. Hoshino, and A. Ishida, A simple radiographic measurement
method for polyethylene wear in total knee arthroplasty. IEEE Transactions of Rehabilitation Engineering, 1999. 7: p. 228-233.
[42] Kellett, C.F., et al., In vivo measurement of total knee replacement wear. The Knee, 2004. 11: p. 183-187.
[43] Short, A., et al., A novel method for in vivo knee prosthesis wear measurement.
2
The robustness and accuracy
of measuring the minimum
joint space width of TKA
The robustness and accuracy
of measuring the minimum
joint space width of total knee
arthroplasty based on
model-based RSA
E.A. van IJsseldijka, E.R. Valstara,b, B.C. Stoelc, R.G.H.H. Nelissena,
J.H.C. Reiberc, B.L. Kapteina
a Biomechanics and Imaging Group, Department of Orthopaedics, Leiden University Medical Center,
PO Box 9600, 2300 RC Leiden, The Netherlands
b Department of Biomechanical Engineering, Faculty of Mechanical, Maritime, and Materials Engineering,
Delft University of Technology, Delft, The Netherlands
c Division of Image Processing, Department of Radiology, Leiden University Medical Center, Leiden,
The Netherlands
Abstract
Introduction
Accurate in vivo measurements methods of wear in total knee arthroplasty are required for a timely detection of excessive wear and to assess new implant designs. Component separation measurements based on model-based Roentgen stereophotogrammetric analysis (RSA), in which 3-dimensional reconstruction methods are used, have shown promising results, yet the robustness of these measurements is unknown. In this study, the accuracy and robustness of this measurement for clinical usage was assessed.
Method
The validation experiments were conducted in an RSA setup with a phantom setup of a knee in a vertical orientation. 72 RSA images were created using different variables for knee orientations, two prosthesis types (fixed-bearing Duracon knee and fixed-bearing Triathlon knee) and accuracies of the reconstruction models. The measurement error was determined for absolute and relative measurements and the effect of knee positioning and true separation distance was determined.
Results
The measurement method overestimated the separation distance with 0.1 mm on average. The precision of the method was 0.10 mm (2*SD) for the Duracon prosthesis and 0.20 mm for the Triathlon prosthesis. A slight difference in error was found between the measurements with 0° and 10° anterior tilt. (difference = 0.08 mm, p = 0.04).
Conclusion
2-1 Introduction
Total knee arthroplasty (TKA) is highly successful in relieving pain and restoring joint function, yet implant failure remains a problem. One of the main causes of failure is excessive polyethylene wear. Wear particles can induce osteolysis that may provoke complications such as aseptic loosening. It has been reported that wear and osteolysis are the primary indications for revision in more than 44% of all revisions performed more than two years after surgery [22]. Excessive wear is related to the design of a prosthesis [25]. Therefore, new prosthesis designs are assessed with knee simulator studies before market introduction. Unfortunately these studies are limited in incorporating important factors such as patient activity and the incidence of misalignment [16, 26]. As an alternative, model-based Roentgen stereophotogrammetric analysis (MBRSA) may be used to assess wear in a clinical setting. This imaging and analysis method achieves sub-millimeter precision in assessing migration of prostheses [44-47], which is used to predict prosthetic loosening [34]. Wear measurements can be obtained with MBRSA and high accuracies were already obtained [42, 43, 48]. However, validation of these wear measurements has been restricted to individual prostheses or measurement protocols. The method’s robustness to variations in patient positioning has not been characterized.
The goal of this study is to determine the robustness of TKA wear measurements in MBRSA. The study uses an RSA setup and a knee phantom in which the separation distance between the tibial and femoral components is known exactly. The measurement method is applied for different variables such as prostheses type, actual separation distance, digital model accuracy and patient positioning. The robustness of the method is determined by assessing the measurement error as a function of these variables.
2-2 Materials and Methods
2-2-1 Phantom setup and acquisition of RSA images
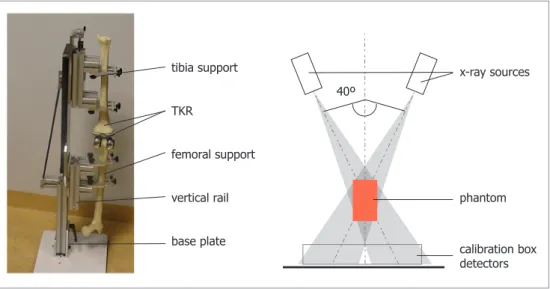
A phantom setup was used with the total knee prostheses fixed into sawbones, to create more realistic images. RSA images of the phantom setup in standing position were acquired with a vertical RSA setup [32]. The setup consisted of a vertical rail on a base plate with two supports on which a tibial and a femoral sawbone could be fixed (Figure 2-3 Left). RSA images were obtained with two synchronized X-ray sources each aimed at a digital X-ray detector (Canon CXDI-series, 169dpi, 12BPP). The detectors were placed adjacently in a carbon calibration box (Medis Specials b.v., Leiden, Netherlands). The X-ray sources were positioned 1.5m from the detectors with a 40° angle between their respective beams. The phantom device was positioned as close to the detectors as possible (Figure 2-3 Right).
Figure 2-3. of the phantom-set-up. Right: Schematic top view of the RSA set-up
To validate the wear measurements, we analyzed the effect of different variables on the measurement error. In total 72 measurements were obtained using the variables in Table 2-1.
Prosthesis type
Two types of Stryker (Kalamazoo, USA) total knee prosthesis were used: the fixed-bearing Duracon knee (tibia size XL2, femur size XL) and the fixed-fixed-bearing Triathlon knee tibia (size 7, femur size 7).
tibia support
TKR
femoral support
vertical rail
base plate
x-ray sources 40º
phantom
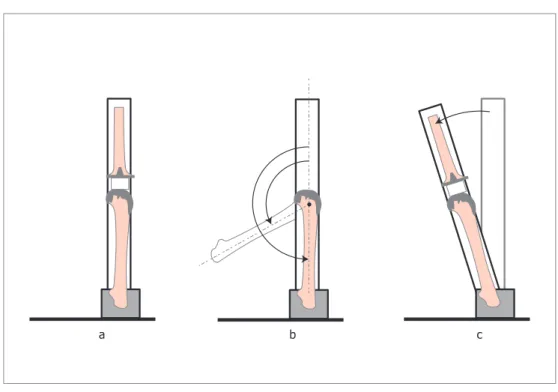
Figure 2-4. Phantom device settings: (a) in resting position, (b) with a flexion angle and (c) with a positive anterior tilt
Flexion angle, anterior tilt and rotation
To test for different flexion angles and the effect of patient positioning, the setup contained mechanisms to adapt the flexion angle of the knee, the anterior tilt and rotation of the leg with respect to the imaging system (Figure 2-3).
Component separation distance
The component separation distance was set using cylindrical, radiolucent plates (Plexiglass/PMMA), which had an accurate thickness (tolerance 0.05 mm). During the measurement a plate was placed in contact between the tibia plateau an d the medial femoral condyle of the total knee. By repeating the measurements with plates of 5 and 10 mm, we validated different component separation sizes.
2-2-2 Separation distance measurement
The separation distance measurement is based on 3D models of the tibial and femoral components. The first step of the measurement was creating a 3D reconstruction of the prosthesis component positions. An RSA analysis was done with MBRSA software
c b
(Version 3.3, Medis Specials, Leiden, The Netherlands). The image contours of the components were selected semi-automatically. The user selected a region of interest in which the software program detected candidate edges (canny edge detection), which could be altered manually. Subsequently, the model poses were calculated by minimizing the difference between the image edges and the projected model silhouette. This is a standard procedure in MBRSA and the accuracy of the position and orientation estimation equaled 0.11 mm and 0.23°, respectively [33]. Next, the medial separation distance was calculated, which was defined as the shortest distance between the medial condyle of the femur and the tibial plane.
The RSA analyses were conducted with both computer aided design (CAD) models and models obtained by reverse engineering (RE), giving 144 measurement outcomes in total. The CAD models were provided by the prosthesis manufacturer. The RE models were created with a 3D laser scanner (Hyscan, Hymarc Tech, Ottawa, Canada) using the original components from this experiment. This scan had a tolerance of 0.020 mm.
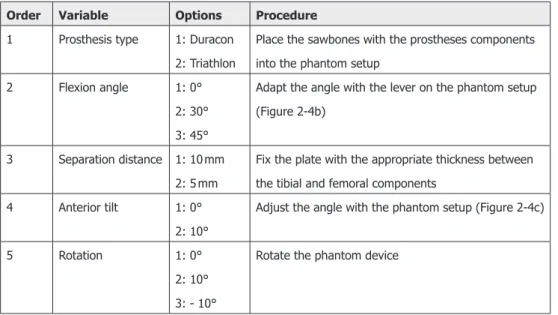
Table 2-1. List of variables used in the robustness validation experiment
Order Variable Options Procedure
1 Prosthesis type 1: Duracon 2: Triathlon
Place the sawbones with the prostheses components into the phantom setup
2 Flexion angle 1: 0° 2: 30° 3: 45°
Adapt the angle with the lever on the phantom setup (Figure 2-4b)
3 Separation distance 1: 10 mm 2: 5 mm
Fix the plate with the appropriate thickness between the tibial and femoral components
4 Anterior tilt 1: 0° 2: 10°
Adjust the angle with the phantom setup (Figure 2-4c)
5 Rotation 1: 0° 2: 10° 3: - 10°
Rotate the phantom device
2-2-3 Statistical analysis
the measurement error, which is the difference between the measurement outcome and the separation distance set during the measurement. The means and standard deviations of the error were calculated for each subgroup of prosthesis type, model type and flexion angle. This was carried out to determine and compare systematic errors among these groups. Subsequently, tests were applied to determine whether mean errors were influenced by anterior tilt, actual separation distance and internal rotation (t-test/ANOVA). These tests were conducted with the data from RE models only, to avoid confounding due to model inaccuracies.
2-3 Results
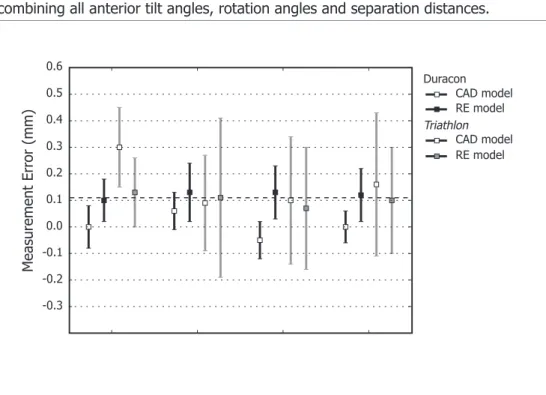
Table 2-2 and Figure 2-5 show the average measurement error per group of prosthesis/model type and flexion angle. These groups consisted of 12 measurements combining all anterior tilt angles, rotation angles and separation distances.
Duracon
Triathlon CAD model RE model
CAD model RE model
M
easur
ement
Err
or
(mm)
0.6
0.5
0.4
0.3
0.2
0.1
0.0
-0.1
-0.2
-0.3
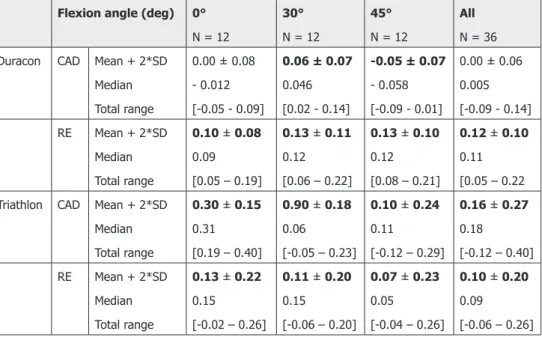
Table 2-2. Mean measurement errors in the robustness experiment, comparison between model types, prosthesis type and knee flexion angle. Each subgroup consistsof12 measurements. Subgroups with a significant error (p < 0.05, t-test) are printed in bold.
Flexion angle (deg) 0°
N = 12
30°
N = 12
45°
N = 12
All
N = 36 Duracon CAD Mean + 2*SD
Median Total range
0.00 ± 0.08 - 0.012 [-0.05 - 0.09]
0.06 ± 0.07
0.046 [0.02 - 0.14]
-0.05 ± 0.07
- 0.058 [-0.09 - 0.01]
0.00 ± 0.06 0.005 [-0.09 - 0.14] RE Mean + 2*SD
Median Total range
0.10 ± 0.08
0.09 [0.05 – 0.19]
0.13 ± 0.11
0.12 [0.06 – 0.22]
0.13 ± 0.10
0.12 [0.08 – 0.21]
0.12 ± 0.10
0.11 [0.05 – 0.22 Triathlon CAD Mean + 2*SD
Median Total range
0.30 ± 0.15
0.31 [0.19 – 0.40]
0.90 ± 0.18
0.06
[-0.05 – 0.23]
0.10 ± 0.24
0.11
[-0.12 – 0.29]
0.16 ± 0.27
0.18
[-0.12 – 0.40] RE Mean + 2*SD
Median Total range
0.13 ± 0.22
0.15
[-0.02 – 0.26]
0.11 ± 0.20
0.15
[-0.06 – 0.20]
0.07 ± 0.23
0.05
[-0.04 – 0.26]
0.10 ± 0.20
0.09
[-0.06 – 0.26]
The results indicated that a systematic overestimation error of 0.1 mm was present in general (one sample t-test, p < 0.05) and in 11 out of 12 subgroups. As can be seen in Figure 2-5, the error of measurement with CAD models varied significantly over the flexion angles for both prosthesis types (ANOVA, p < 0.001). Measurements with RE models did not show this variation.
As shown in Table 2-2, the measurements were more precise with the Duracon prosthesis than with the Triathlon prosthesis (0.2 and 0.1 mm, respectively for the RE models). Levene’s test was applied on 6 equivalent subgroups (flexion*model type) and the outcome was significant (p < 0.05) for all but the Duracon 0° flexion case.
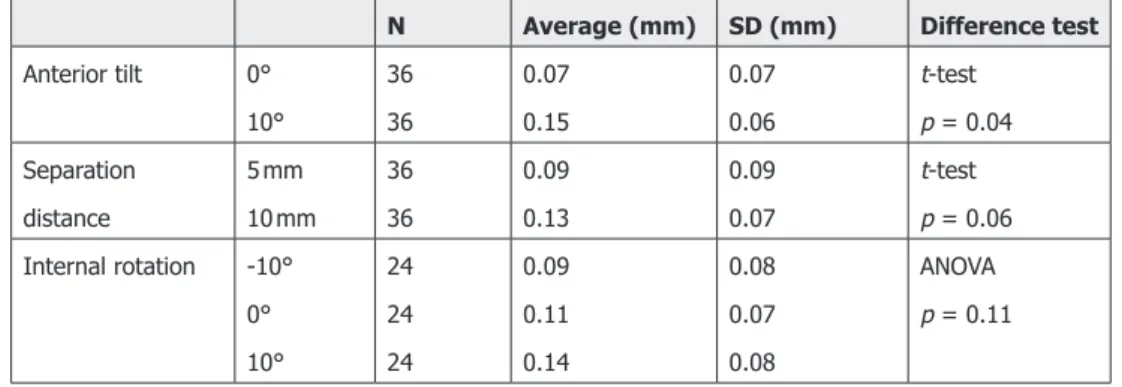
Table 2-3. Average measurement errors and standard deviations (SD) for different values for anterior tilt, knee rotation and real component separation. The last column shows the difference test used and result for significance.
N Average (mm) SD (mm) Difference test
Anterior tilt 0° 10° 36 36 0.07 0.15 0.07 0.06 t-test p = 0.04 Separation distance 5 mm 10 mm 36 36 0.09 0.13 0.09 0.07 t-test p = 0.06 Internal rotation -10°
0° 10° 24 24 24 0.09 0.11 0.14 0.08 0.07 0.08 ANOVA p = 0.11
2-4 Discussion
We studied the accuracy and precision of a component separation measurement in MBRSA for TKA. The study was performed with a phantom setup, in which the measurement was repeated for various knee positions, separation distances and prosthesis types.
We found that the measurement had a small overestimation of 0.1 mm. For the CAD models, this seems to depend on the flexion angle, whereas the results for the RE models were more homogeneous. In addition, anterior tilt may influence the measurement, as a statistically significant effect size of 0.07 mm was observed over a tilt range of 10°. However, this effect is small and should pose little concern when patients are positioned carefully.
The precision of the measurement seems related to the prosthesis type. With RE models, the precision of the Triathlon and Duracon prosthesis were 0.2 and 0.1 mm, respectively. Possibly, the Duracon prosthesis has a more salient geometry, giving a higher precision in the pose estimation.
An important question is how these results influence a wear measurement, which is the difference between two subsequent separation distance measurements. Assuming these measurements are independent, the overestimations will cancel out and a precision is expected of √2 * 0.2 ≈ 0.3 mm. This shows the measurement is suitable for clinical research studies, as sub-millimeter difference can be detected with small patient groups.
A limitation of this study is the lack of experiments with in vivo data, in which soft tissue attenuation can deteriorate contours detection. Still, similar results are expected as attenuation is usually limited in knee X-rays. Besides, MBRSA analysis is robust even if only 10% of the contour information is used [50].
Some general limitations still exist for TKA wear measurements based on the separation distance. Wear is localized and liners can have a congruent geometry [25, 51]. Therefore, the outcome of the measurement depends on the contact location of the femur, which decreases the reproducibility of the measurement in vivo. In addition, the measurement cannot distinguish between wear and creep. Creep stabilizes in the first years after surgery [52, 53], after which period the wear measurement becomes reliable.
In conclusion, our data shows that the joint separation measurements based on model-based RSA are accurate enough for wear studies of total knee prostheses. Further research is needed for the usability in clinical practice. The use of RE models is recommended, as the measurement is more robust compared to CAD.
2-5 Acknowledgements
Department at the Leiden University Medical Center for their support in developing the phantom setup. Funding for this study was provided by the Dutch Arthritis Foundation (no. 08-1-303) and Stryker.
R
efeRences[16] Naudie, D.D.R., et al., Wear and osteolysis around total knee arthroplasty.
The Journal of the American Academy of Orthopaedic Surgeons, 2007. 15: p. 53-64.
[22] Sharkey, P.F., et al., Why are total knee arthroplasties failing today? Clinical Orthopaedics and Related Research, 2002. 404: p. 7-13.
[25] Dennis, D.A. and R.D. Komistek, Mobile-bearing total knee arthroplasty: design factors in minimizing wear. Clinical Orthopaedics and Related Research, 2006. 452: p. 70-7.
[26] Lavernia, C.J., et al., Activity level and wear in total knee arthroplasty: a study of autopsy retrieved specimens. The Journal of Arthroplasty, 2001.
16: p. 446-53.
[32] Kaptein, B.L., et al., A new model-based RSA method validated using CAD models and models from reversed engineering. Journal of Biomechanics, 2003. 36: p. 873-882.
[33] Kaptein, B.L., et al., Clinical validation of model-based RSA for a total knee prosthesis. Clinical Orthopaedics and Related Research, 2007. 464: p. 205-9.
[34] Ryd, L., et al., Roentgen stereophotogrammetric analysis as a predictor of mechanical loosening of knee prostheses. The Journal of Bone & Joint Surgery. British Volume, 1995. 77: p. 377-83.
[42] Kellett, C.F., et al., In vivo measurement of total knee replacement wear. The Knee, 2004. 11: p. 183-187.
[43] Short, A., et al., A novel method for in vivo knee prosthesis wear measurement.
Journal of Biomechanics, 2005. 38: p. 315-322.
[44] Garling, E.H., E.R. Valstar, and R.G.H.H. Nelissen, Comparison of micromotion in mobile bearing and posterior stabilized total knee prostheses: a randomized RSA study of 40 knees followed for 2 years. Acta Orthopaedica, 2005. 76: p. 353-61.
knee prostheses, 1995.
[46] Nilsson, K.G. and J. Kärrholm, RSA in the assessment of aseptic loosening.
The Journal of Bone & Joint Surgery. British Volume, 1996. 78: p. 1-3. [47] Soballe, K., et al., Migration of hydroxyapatite coated femoral prostheses.
A Roentgen Stereophotogrammetric study. The Journal of Bone & Joint Surgery. British Volume, 1993. 75: p. 681.
[48] Gill, H.S., et al., In vivo measurement of volumetric wear of a total knee replacement. The Knee, 2006. 13: p. 312-7.
[49] Simpson, D.J., et al., Development of a model-based RSA systeem to measure polyethylene wear in unicompartmental arthroplasty. Clinical Biomechanics, 2010. ?: p.?
[50] Kaptein, B.L., et al., Evaluation of three pose estimation algorithms for model-based Roentgen stereophotogrammetric analysis, in The Journal of Engineering in Medicine, part H2004. p. 231-8.
[51] Bartel, D.L., V.L. Bicknell, and T.M. Wright, The effect of conformity, thickness, and material on stresses in ultra-high molecular weight components for total joint replacement. The Journal of Bone & Joint Surgery. American Volume, 1986. 68: p. 1041-1051.
[52] Deng, M., et al., Study of creep behavior of ultra-high-molecular-weight polyethylene systems. Journal of Biomedical Materials Research, 1998. 40: p. 214-223.
A model-based approach to
measure the minimum joint
space width of total knee
arthroplasty in standard
radiographs
E.A. van IJsseldijka, E.R. Valstara,b, B.C. Stoelc, R.G.H.H. Nelissena,
B.L. Kapteina
a Biomechanics and Imaging Group, Department of Orthopaedics, Leiden University Medical Center, PO
Box 9600, 2300 RC Leiden, The Netherlands
b Department of Biomechanical Engineering, Faculty of Mechanical, Maritime, and Materials Engineering,
Delft University of Technology, Delft, The Netherlands
c Division of Image Processing, Department of Radiology, Leiden University Medical Center, Leiden, The
Netherlands
Abstract
Introduction
Excessive wear is in total knee arthroplasty is detected by measuring the minimum joint space width (mJSW) in anterioposterior radiographs. The accuracy of conventional measurement methods is limited and can be improved using model-based techniques. In this study, the model-model-based wear measurement (MBWM) is introduced. Its accuracy and reproducibility are assessed and compared to the conventional measurement.
Method
40 anterioposterior radiographs were obtained of a knee prosthesis using a phantom set-up. Both measurement methods were applied and the accuracy and precision were compared. The reproducibility was calculated with an inter- and intra-observer experiment. Three observers measured the mJSW in 30 clinical radiographs with both the conventional measurement and the MBWM and repeated this after 6 weeks. The experiments were conducted with a NexGen mobile bearing and fixed bearing prostheses.
Results
In the phantom experiment, the accuracy (mean of the absolute error) was significantly higher (t-test, p < 0.01) for the MBWM as for the conventional measurement (0.15 mm versus 0.43 mm, 0.14 mm versus 0.35 mm for the mobile and fixed bearing respectively). The standard deviation of the measurements is smallest for the MBWM measurement for both prosthesis types (0.16 mm versus 0.47 mm, Levene’s test, p < 0.01). In the reproducibility experiment, both the intra- and inter-observer agreements was higher for the MBWM than for the conventional method.
Conclusions
3-1 Introduction
Excessive polyethylene wear is an important cause of implant failure in total knee arthroplasty (TKA) [16, 22]. As the incidence of total knee arthroplasty is increasing, the impact of wear problems is expected to increase as well [54].
In current clinical practice, polyethylene wear is determined in vivo using the minimum joint space width (mJSW), which is assessed in standard radiographs. This diagnostic tool is used to evaluate new prosthesis designs and for decision support for surgical procedures such as isolated polyethylene exchanges [55-57].
The mJSW is obtained in anterioposterior (AP) or mediolateral radiographs [27, 28]. However, the accuracy is limited and measurement errors higher than 1 mm are not exceptional [28].
The measurement accuracy and precision can be improved by model-based techniques. In our previous work, we described and validated a wear measurement method for model-based roentgen stereophotogrammetric analysis (MBRSA), in which the tibia-femoral distance is obtained based on 3D surface models of the components [58], using 3D vision techniques [59].
This approach can be used for standard radiographs as well. The accuracy of the measurement will be lower than the accuracy found in MBRSA, as accurate calibration is not possible and model matching is done with a single X-ray source only. Nonetheless, we hypothesize that the generally applicable, model-based approach will be more accurate and reproducible compared to conventional methods, as more image information is exploited and less dependency is expected to joint space narrowing caused by anterioposterior tilt of the tibial baseplate.
3-2 Materials and Methods
3-2-1 Measurement Methods
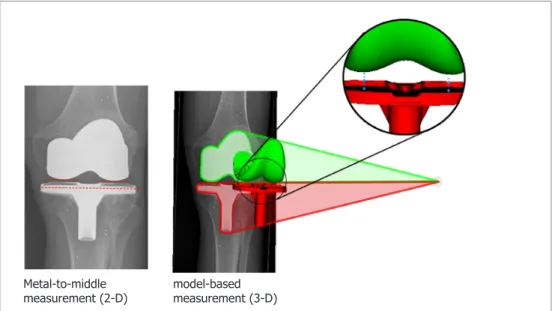
We now describe the metal-to-middle (conventional) and model-based measurements. Both methods determine the mJSW as the shortest distance between the tibial tray and the femoral condyles. The first method uses the visible distance in the image itself, whereas the second uses a semi-automatic measurement based on 3-D models that are matched with the image.
Metal-to-middle measurement
The metal-to-middlemeasurement is the standard method in obtaining the mJSW in the image [27, 28]. A reference line is drawn through the tibial tray at its largest medialateral width. Then, the shortest perpendicular distances are estimated between this reference and the femoral condyles (Figure 3-6 left).
In our experiments, the metal-to-middle method was conducted using a computer software (Digimizer® version 4.0.0.0, MedCalc Software, Mariakerke, Belgium). The
image magnification was corrected using the ratio of the known width of the tibial baseplate to the width in the radiograph.
Model-based wear measurement
In the model-based wear measurement (MBWM) method, 2-D/3-D registration is used to match 3-D surface models of the tibial and femur components with the AP radiograph. Then, the minimal medial and lateral distances are automatically measured based on the models (Figure 3-6 right).
The image contours of the tibial and femoral components were selected semi-automatically with canny edge detector [60]. The position and orientation of the models were calculated by minimizing the difference between the image contours and the projected model silhouettes.
Figure 3-6. Comparison of the measurement methods: (left) the metal-to-middle method, in which the mJSW is obtained in teh radiograph, and (right) the MBWM in which the mJSW is obtained semi-automatically based on 3D models
3-2-2 Experiments
Phantom experiment
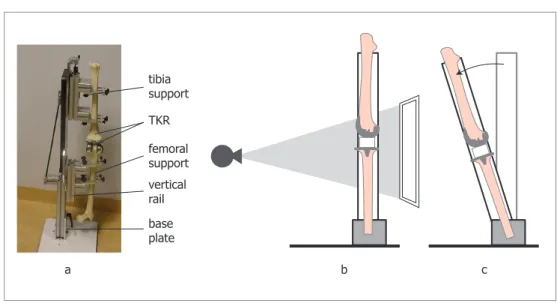
The phantom setup consisted of the tibial and femoral components of the knee prostheses, which were inserted into sawbones (Figure 3-7). The setup was placed in an X-ray imaging system (CXDI-series, 169dpi, 12BPP, Canon, New York, USA), according to the anterior-posterior (AP) protocol in standing position as used in our hospital. The X-ray source was positioned 1.2 meters from the detectors and the phantom was positioned approximately 20 cm from the detector.
The actual mJSW was set using radiolucent plates (Plexiglass/PMMA), which had an accurately defined thickness (tolerance 0.05 mm). Four different sizes (5, 8, 10
Metal-to-middle
Figure 3-7. a) image of the phantom. (b) illustration of the phantom in a neutral position. (c) the phantom with anterior tilt.
and 12 mm) were used and the appropriate plate was placed between the tibial tray and the medial femoral condyle during the acquisition. As contact was possible only for the medial condyle, the lateral mJSW was not measured in the experiment.
For each plate size 10 images were acquired. Among these images, the position (range -10 to 10 cm) and orientation (range -10° to 10°) of the phantom with respect to the image were varied. In addition, the setup was placed in different anterior tilt angles (range 0° to 10°), as illustrated in Figure 3-7.
We repeated the acquisitions for both the fixed bearing and mobile bearing NexGen (Zimmer, Warsaw, IN, USA) total knee prostheses to cover different geometric designs. The size of the fixed and mobile bearings were (5-F) and (4-D), respectively (tibia-femur). Computer aided design (CAD) models were available for all components, except for the tibia component of the fixed prosthesis. For this component a reversed engineered model was created with a 3-D laser scan (Hyscan, Hymarc Tech, Ottawa, Canada), which had a tolerance of 0.020 mm.
In total, 80 images were acquired (10 images x 4 plate sizes x 2 prosthesis types). For all images, the mJSW was calculated with the MBWM and conventional measurement
tibia support
TKR
femoral support vertical rail base plate
method, which was obtained by a clinician. Subsequently, the errors were calculated as the difference with the actual mJSW defined by the plate thickness.
Statistical analysis
We calculated the error mean, absolute error mean, standard deviation of the error and error range per prosthesis type and measurement method. The sizes of the errors are tested for statistical significance with unpaired t-tests. Levene’s tests are used to test for differences in variance between the errors of the measurement methods. Finally, the dependency between the error and actual size was determined using a regression analysis (Pearson’s rho).
Clinical experiment
In this experiment, a comparison was made between the inter- and intra-observer variability of the conventional wear measurement and MBWM. Clinical data was used as no ground truth value is required to obtain this measure.
For both the mobile and the fixed bearing prosthesis, 15 bearing AP radiographs were retrieved from the hospital database, in a random order. Both bilateral and unilateral images were included.
Three observers were included in the experiment: a clinician, a researcher and a senior researcher. They were asked to measure the medial and lateral insert thickness in the radiographs using both the conventional and model-based measurement methods. Observers could practice until they felt comfortable with the methods, preventing learning curve effects. To obtain the intra-observer variability, the observers repeated the measurements after a period of at least 6 weeks. In this series, the average measurement duration of the model-based method was also recorded.
Statistical analysis
3-3 Results
3-3-1 Phantom Experiment (accuracy)
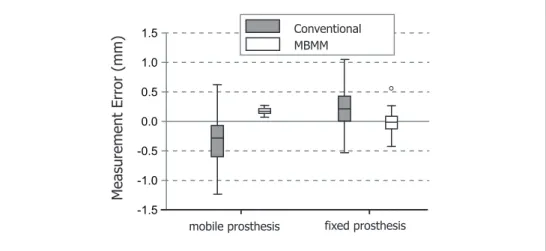
The measurement errors (i.e. the difference between the measured thickness and the actual thickness of the plate) for each measurement method and prosthesis type are shown in box plots (Figure 3-8). The statistical characteristics of the errors are shown in Table 3-4, split for the measurement method and prosthesis type.
-1.5 -1.0 -0.5 0.0 0.5 1.0 1.5
M
easur
ement
Err
or
(mm)
mobile prosthesis fixed prosthesis Conventional MBMM
Figure 3-8. Boxplots showing the measurement errors of the different methods and prostheses types
Table 3-4. Statistics over the measurement errors in the phantom experiment.
Mobile (N=40) fixed (N=40)
conv MBWM conv MBWM
mean (mm) -0.36* 0.15* 0.20* -0.03
standard deviation (mm) 0.40 0.06† 0.40 0.19† absolute error mean (mm) 0.43 0.15** 0.35 0.14**
range (mm) 1.90 0.21 1.61 1.01
conv = conventional measurement; MBWM = model-based wear measurement * statistically significant difference from 0 mm (t-test, p < 0.05)
† statistically significant difference in variance compared to the conventional measurement (Levene’s test, p < 0.01)
For both prosthesis types, the standard deviation of the measurements is significantly smaller for the model-based measurement than for the conventional measurement (Levene’s test, p < 0.01). Also, the model-based measurement had a significantly smaller standard deviation for the mobile prosthesis than for fixed prosthesis (Levene’s test, p < 0.01). This is probably due to the implant geometry. The fixed prosthesis type contains thin structures such as the metal rim. These structures produce less pronounced image edges, increasing the localization error.
The average of the measurement error indicates whether a systematic bias (information bias) is present. The data from Table 3-4 shows that only the model-based measurement is unbiased for the fixed prosthesis. For the mobile prosthesis, the model-based measurement shows the smallest bias of the two methods. For both prosthesis types, the absolute error is lower for the MBWM than for the conventional measurement (p < 0.01).
No statistically significant correlation was found between the measurement error of the model-based measurement and the true distance for both prosthesis types (Pearson’s rho, p < 0.05).
3-3-2 Clinical experiment (reproducibility)
The ICC values found in the inter- and intra-observer study were higher for the model-based method than for the conventional method for any observer and prosthesis type (Table 3-5), indicating a better reproducibility for the first method. On average, the reproducibility was higher for the fixed bearing than for the mobile bearing.
The average measurement durations of the observers in the second measurement series were 1:37, 2:24 and 2:37 (min:sec).
Table 3-5. Results of the inter and intra-observer variability of the measurement methods for the conventional (conv) and model-based method (mb) in terms of the interclass correlation coefficient.
Intra-observer variability Interobserver
variability
Observer 1 Observer 2 Observer 3
ICC values conv MBWM conv MBWM conv MBWM conv MBWM mobile prosthesis .945 .963 .926 .983 .822 .947 .863 .966
fixed prosthesis .963 .986 .973 .982 .970 .992 .919 .982
The Bland-Altman plot gives the agreement between the measurements, by plotting the difference between the measurement methods (MBWM - conventional) against the mean value (Figure 3-9). Only the first measurement series was used and the mean value over the three observers was used, reducing the data to 60 points. This reduction keeps the plot legible and – more importantly - prevents oversampling, because the observer data contains a high dependency.
-1.5 -1.0 -0.5 0.0 0.5 1.0 1.5 2.0 2.5
4.0 5.0 6.0 7.0 8.0 9.0 10.0 11.0
M
ethod di
fference
(mm)
Method average (mm)
Mobile Prosthesis Fixed Prosthesis
Figure 3-9. Blant-Altman plot showing the measurement agreement between the two methods.
3-4 Discussion
We developed a model based wear measurement (MBWM) that is superior in obtaining the mJSW in comparison with the method currently used in clinical practice. The main advantage is the improvement in precision and reproducibility that was obtained. A higher precision was found in the phantom experiment and a higher inter- and intra-observer reproducibility was found with clinical data. As these experiments were conducted with both a fixed and a mobile prosthesis design, we expect that these findings are generally applicable to other prosthesis designs as well.
Furthermore, we found a lower bias for the MBWM than for the conventional measurement in the phantom experiment. However, the high variability of the conventional measurements makes generalization of this result difficult. Furthermore, bias is of lesser importance than precision, because bias can nullify in relative measurements such as wear-rate measurements.
The average measurement duration of the model-based measurement was approximately 2 minutes, which is adequate for clinical use. We expect that this duration can be decreased by further automation of the contour detection, as the implant shadows are clearly distinguishable in AP radiographs.
The phantom experiment had several limitations. It did not include the soft tissue attenuation that is present in real clinical images. Still, the attenuation is usually limited and the pose estimator remains robust when only 5% of the complete contour is used [63]. Another limitation was that the geometric design of the fixed bearing tibia component in the phantom was different from the design in clinical images, due to this availability. This could have influenced the conventional measurement, because of differences in the metal rim surrounding the tibia plateau. This could explain why the mean difference between the measurements differs for this prosthesis, when the phantom experiment and clinical experiment are compared (-0.23 mm vs. 0.12 mm).
effect in the phantom experiment. Although we expect that congruent liners limit the variability of the articulating point, we hope to eliminate any uncertainty with a retrieval study, in which clinical radiographs are compared directly to retrieved liners. A general limitation of radiograph-based distance measurement is that creep and true wear cannot be distinguished. Instead, it is assumed that creep stabilizes within two months, whereas wear is expected to be a constant process over time [52].
Several other studies describe alternatives to the radiographic wear measurement. Some studies use fluoroscopy to improve the reproducibility, as the alignment between the tibial tray and the radiographic beam can be optimized before the measurement [40, 64]. A standard deviation of 0.15 mm was found in this measurement, which is similar to the finding in our work, yet fluoroscopy generally comes with a higher radiation dose for the patient and requires a longer imaging time. In other researches, a similar model-based wear measurement for calibrated single-source radiographs is described [41, 65]. Although the validation data is limited, this indeed seems to give better results (SD = 0.1 mm). However, this method imposes the presence of a calibration object. We think that the applicability to standard radiographs is a considerable advantage of the method we are using.
Based on these results, we conclude that the model-based method is a reliable tool to evaluate the insert thickness in standard radiographs. It can therefore aid in a better timing of insert exchanges, with the aim of decreasing the number of complications. Moreover, the accuracy of the method combined with the advantage that any standard radiograph can be used renders the method interesting for wear studies to compare prosthesis types.
R
efeRences[16] Naudie, D.D.R., et al., Wear and osteolysis around total knee arthroplasty.
The Journal of the American Academy of Orthopaedic Surgeons, 2007. 15: p. 53-64.
[22] Sharkey, P.F., et al., Why are total knee arthroplasties failing today? Clinical Orthopaedics and Related Research, 2002. 404: p. 7-13.
2005. 54: p. 164-77.
[28] Collier, M.B., B.A. Jewett, and C.A. Engh, Clinical assessment of tibial polyethylene thickness comparison of radiographic measurements with as-implanted and as-retrieved thicknesses. The Journal of Arthroplasty, 2003.
18: p. 860-866.
[40] Duryea, J., et al., Fully automated software to monitor wear in prosthetic knees using fluoroscopic images. European Radiology, 2001. 11: p. 2184-7. [41] Fukuoka, Y., A. Hoshino, and A. Ishida, A simple radiographic measurement
method for polyethylene wear in total knee arthroplasty. IEEE Transactions of Rehabilitation Engineering, 1999. 7: p. 228-233.
[52] Deng, M., et al., Study of creep behavior of ultra-high-molecular-weight polyethylene systems. Journal of Biomedical Materials Research, 1998. 40: p. 214-223.
[54] Robertsson, O., et al., Past Incidence and future demands for knee arthroplasty in Sweden. Acta Orthopaedica, 2000. 71: p. 376-380.
[55] Bert, J.M., et al., The incidence of modular tibial polyethylene insert exchange in total knee arthroplasty when polyethylene failure occurs. The Journal of Arthroplasty, 1998. 13: p. 609-14.
[56] Babis, G.C., R.T. Trousdale, and B.F. Morrey, The effectiveness of isolated tibial insert exchange in revision total knee arthroplasty. The Journal of Bone & Joint Surgery. American Volume, 2002. 84-A: p. 64-8.
[57] Engh, G.a., L.M. Koralewicz, and T.R. Pereles, Clinical results of modular polyethylene insert exchange with retention of total knee arthroplasty components. The Journal of Bone & Joint Surgery. American Volume, 2000.
82: p. 516-23.
[58] IJsseldijk, E.A.v., et al., The robustness and accuracy of in vivo linear wear measurements for knee prostheses based on model-based RSA. Journal of Biomechanics, 2011. 44(15): p. 2724-2727.
[59] Wunsch, P. and G. Hirzinger, Registration of CAD-models to images by iterative inverse perspective matching. Proceedings of 13th International Conference on Pattern Recognition1996: IEEE. 78-83 vol.1.
[61] PITMAN, E.J.G., A note on normal correlation. Biometrika, 1939. 31: p. 9-12.
[62] Bland, J.M. and D.G. Altman, STATISTICAL METHODS FOR ASSESSING
AGREEMENT BETWEEN TWO METHODS OF CLINICAL MEASUREMENT. The
Lancet, 1986. 327(8476): p. 307-310.
[63] Kaptein, B.L., et al., Evaluation of three pose estimation algorithms for model-based Roentgen stereophotogrammetric analysis. J. Engineering in Medicine, part H, 2004: p. 231-8.
[64] Hide, I.G., et al., A radiological technique for the assessment of wear in prosthetic knee replacements. Skeletal Radiology, 2000. 29: p. 583-586. [65] Hoshino, A., A. Ishida, and Y. Fukuoka, Accurate in vivo measurement of
Measuring the minimum joint
space width in total knee
arthroplasty by RSA
E.A. van IJsseldijka, E.R. Valstara,b, B.C. Stoelc, R. de Ridderd,
R.G.H.H. Nelissena, B.L. Kapteina
a Biomechanics and Imaging Group, Department of Orthopaedics, Leiden University Medical Center, PO
Box 9600, 2300 RC Leiden, The Netherlands
b Department of Biomechanical Engineering, Faculty of Mechanical, Maritime, and Materials Engineering,
Delft University of Technology, Delft, The Netherlands
c Division of Image Processing, Department of Radiology, Leiden University Medical Center, Leiden, The
Netherlands
d Department of Orthopaedics, Langeland Ziekenhuis, Zoetermeer, The Netherlands
Abstract
Introduction
Measuring the minimum joint space width (mJSW) in total knee arthroplasty (TKA) in Roentgen Stereophotogrammetric Analysis (RSA) studies provides valuable information on polyethylene wear, a leading cause for TKA failure. Most existing RSA studies use non-weight-bearing (NWB) patient positioning. The latter may compromise mJSW measurements due to knee laxity with subsequent non-contact between the TKA components. We investigated the difference in mJSW between weight-bearing (WB) and NWB images and the association with mediolateral (ML) knee stability.
Methods
23 TKAs from an ongoing RSA study were included. At one-year follow-up, WB and NWB RSA examinations were obtained and the ML stability was evaluated. For each examination the mJSW and femoral-tibial contact locations were measured. A linear regression model was used to analyze the association between the mJSW difference (NWB – WB) with the ML stability and contact locations.
Results
The mean mJSW difference was 0.28 mm medially and 0.20 mm laterally. 4 TKAs had medium (5 - 9 deg) and 19 TKAs had high ( < 5 deg) ML stability. A higher mJSW difference was found for TKAs with medium stability (0.36 mm, p = 0.01).
Conclusion
4-1 Introduction
Polyethylene (PE) wear is a leading cause for failure of total knee arthroplasties (TKAs) [16, 20, 22]. The impact of PE wear is expected to increase further as the incidence of TKAs increases because of our aging and increasingly obese population [5, 11, 54]. In addition, TKAs are applied more often in younger patients that have a more active lifestyle than older patients [6, 11].
Currently, the PE wear of new implant designs or implant materials is evaluated with in vitro knee simulator studies before market introduction [66-68]. These studies do not incorporate the effect of patient specific and surgery specific factors to PE wear [69]. This can lead to unforeseen complications. Alternatively, PE wear can be assessed in vivo by measuring the minimum joint space width in radiographs. However, studies using these measurements are uncommon, which may be related to the low precision of conventional in vivo wear measurements. Errors up to several millimeters have been reported and obtaining sufficient power is laborious [28]. For example, to distinguish a difference of 0.2 mm in a clinical study approximately 250 patients would be required (2-sided power calculation, SD = 1 mm, alpha = 0.95).
Model-Based Roentgen Stereophotogrammetric Analysis (MBRSA) is an imaging and analysis technique which is known for its high accuracy in measuring migration of implants, which is used as a predictor for survival of knee prostheses [44, 46, 70]. Several studies showed that techniques such as MBRSA can also be used to measure PE wear based on mJSW assessments [43, 71]. We developed and validated such an mJSW measurement for MBRSA in a previous study [72]. Now, this measurement technique can be applied to previous RSA studies on TKA migration, potentially providing information on wear progression.
thickness. This requirement has never been fully validated for knee prostheses, while for hip prostheses no difference in wear measurements between weight bearing and non-weight bearing images was found [75]. In case the measurement can detect PE wear progression in supine RSA images, ample data would become available from a multitude of clinical evaluation studies of TKA where successive supine X-rays were made for other purposes.
The primary aim of this study is therefore to determine whether the mJSW measurement differs between weight-bearing and non-weight-bearing positions. A secondary aim is to determine whether this mJSW difference can be related to knee laxity. This is analyzed by comparing TKAs with different mediolateral stability. We hypothesize that a lower mediolateral stability (thus a higher knee laxity) results in larger difference in the mJSW measured in WB and NWB positions.
4-2 Methods
4-2-1 Data
RSA image pairs and knee stability data were analyzed for 23 patients in an ongoing prospective RSA study conducted in ‘het Langeland Ziekenhuis’ (Zoetermeer, the Netherlands). All patients received a Stryker Triathlon Posterior Stabilized (PS) fixed bearing knee prosthesis. The cohort consisted of 7 males (30%) and 16 females (70%) and aged between 50 and 83 years (median 63 years). All patients gave informed consent to participate in this study.
At the one-year follow-up evaluation, RSA examinations were done in both a standing, weight-bearing (WB) and supine, non-weight-bearing (NWB) patient position. The mediolateral (ML) stability of the TKA was evaluated in degrees. TKAs were classified as having high stability ( < 5 deg) or medium stability (5-9 deg). For the RSA examination in supine position a calibration box (Carbon box, RSA Core, dep orthopaedics, LUMC , the Netherlands) was mounted beneath the examination table [32]. For the examination in standing position, this calibration box was positioned vertically. The stereo images were
All RSA analyses were carried out at the Leiden University Medical Center (dept Orthopeadics). 2D/3D registration was applied to the stereo images to reconstruct the position and orientation of the femoral and tibial components. This registration was done with model-based RSA software (RSAcore, dep orthopaedics, LUMC , the Netherlands) based on a standardized RSA analysis. This analysis consists of the consecutive steps of image calibration, edge detection and 2D-3D registration based on triangulated surface models using edge matching [17, 76]. For the femoral component computer aided design (CAD) models were used which were obtained from the manufacturer. The tibial models were reverse engineered (RE).
4-2-2 mJSW measurement
For all 46 RSA examinations ((WB + NWB) x 23 TKAs) the mJSW and the contact location of the medial and lateral condyles were measured. The mJSW is defined as the minimum distance between the metal tibial tray and the femoral condyle. The contact location is expressed in tibial tray coordinates xAP and xML (Figure 4-10).
Anterior (-)
Medial (-)
Posterior (+)
Lateral (+) XAP
XML