HISTORICAL ATMOSPHERIC LEAD AND OTHER TRACE
ELEMENTS DEPOSITION RECORDS IN AN OMBROTROPHIC PEAT
POCOSIN: A NEW RECORD FROM NORTH CAROLINA
Jingyuan Sun
A thesis submitted to the faculty of the University of North Carolina at Chapel Hill in partial fulfillment of the requirements for the degree of Master’s in the Department of Geological Sciences.
Chapel Hill 2012
Approved by:
Dr. Larry K. Benninger
Dr. Donna M. Surge
Dr. Drew S. Coleman
ii ABSTRACT
JINGYUAN SUN: Historical Atmospheric Lead And Other Trace Elements Deposition Records In An Ombrotrophic Peat Pocosin: A New Record From North
Carolina
(Under the direction of Larry Benninger)
Human activities introduce pollutant elements into the atmosphere, from which they enter sedimentary environments via precipitation and dry deposition. In this study, pocosin peat in eastern North Carolina was used to track the sources of atmospherically deposited trace elements. Peat chronology was based on 210Pb and fallout 137Cs.
Concentrations, accumulation rates and enrichment factors for twenty-five elements, along with Sr and Pb isotopic compositions, were obtained. The results show that local leaded gasoline usage dominated the lead source. However, other anthropogenic sources such as coal combustion, mining, and agricultural development may have also introduced Pb and other trace elements through windblown dust. Sr isotopes require sources more radiogenic than seawater Sr; twentieth century Pb isotopes are consistent with
predominant input from gasoline lead and coal combustion. The pocosin record of lead is similar to published records from the eastern United States and Western Europe, but contrasts with those from Asia.
iii
TABLE OF CONTENTS
LIST OF TABLES...………v
LIST OF FIGURES...……….….….vi
Chapter I. INTRODUCTION....………...……….……….1
II. SITE DESCRIPTION...………..………..……6
III. METHODS…...……….…...…7
Field sampling. …………...………..………...…7
Sample preparation……..………..………....7
137 Cs and 210Pb dating…..………...……...8
Major and trace element concentrations……...……..………...10
Pb and Sr isotopes………..…………..…...………..11
IV. RESULTS..……….…………...………..13
Bulk properties ………..………..………13
Radiochemistry and peat chronology…………..………13
Major elements abundance….………...……..……….………...15
Trace elements abundance…….….………..………...15
Accumulation rate and enrichment factor of trace elements……..………….16
Pb and Sr isotopes…....……..………..17
iv
Pocosin ombrotrophic and minerotrophic characters……...……..……..….18
Sediment chronology…………...………..…………...………...18
Major elements, Zr and REE ……..……….………..…….…20
Trace element deposition in CNF pocosin………..……….21
Trace elements group one.………..……….22
Trace elements group two………..………..…….24
Sources to the CNF pocosin based on Sr and Pb isotope………..……..26
VI. CONCLUSION………...………...………..29
APPENDICES….………….…….……….……….……..51
v
LIST OF TABLES
1. North Carolina local anthropogenic history…………..…...………31
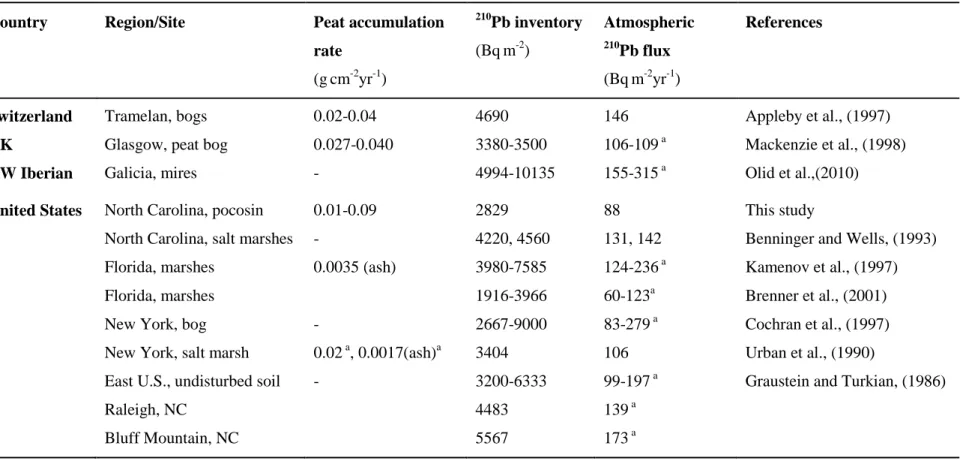
2. Peat accumulation rate, 210Pb inventory and atmospheric 210Pb flux comparisons from different atmospheric deposition sites…………..…………..32
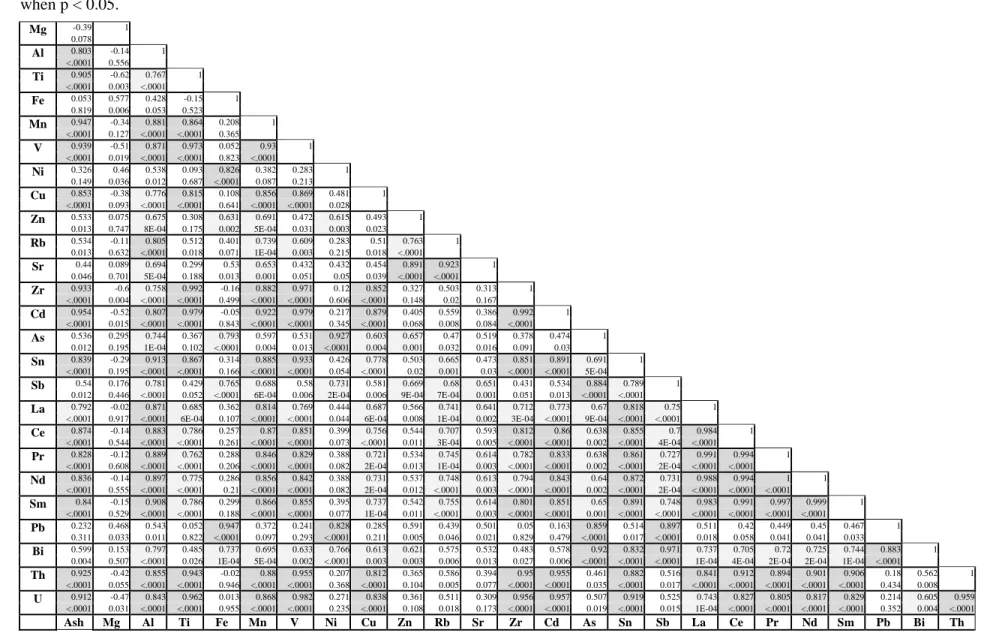
3. Elements concentrations correlation relationship table…...………....……33
4. Trace elements concentrations in peat from Croatan National Forest pocosin, NC, U.S.………..…...34
5.
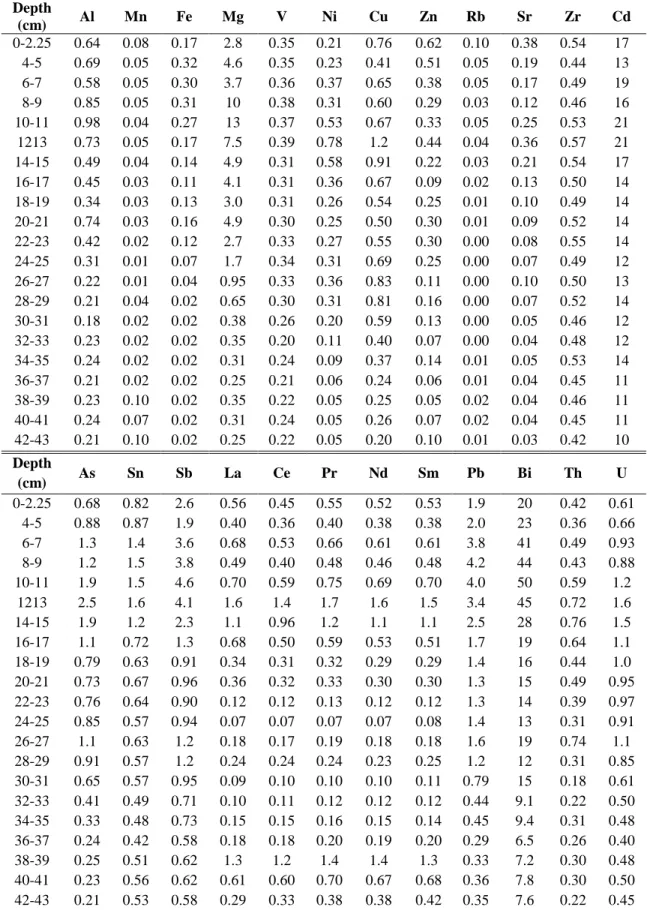
Trace elements concentrations in ash from Croatan National Forest pocosin, NC, U.S.………...356. Enrichment factor of trace element in CNF pocosin, U.S…...….36
7. Accumulation rates of 25 elements in CNF pocosin………37
vi
LIST OF FIGURES
1. The mineral sources distribution of North Carolina Coastal Plain………..…...39
2. The total population growth in the adjacent counties around CNF: Carteret, Craven, Jones, Onslow, Pamilco.………...40
3. The total population change/growth rate in the adjacent counties around CNF: Carteret, Craven, Jones, Onslow, Pamilco………….……….40
4. The study site in the pocosins of Croatan National Forest, North Carolina, U.S…....41
5. Bulk density, water content and Loss on Ignition profiles of CNF pocosin, NC…....42
6. Excess 210Pb and 137Cs activities in Core 1, CNF pocosin, NC...42
7. The chronology from CRS 210Pb dating model………...………….43
8. Major elements concentrations in peat, CNF pocosin, NC...………..43
9. Major elements accumulation rates in CNF pocosin, NC.………...44
10.Selected trace elements concentrations in peat, CNF pocosin, NC….……...……….44
11.Pb isotopic compositions graph versus depth and age index………...45
12.Sr concentration in ash, Sr enrichment factor and 87Sr/86Sr isotopic ratio profiles, CNF pocosin, NC.………45
13.Pb, Cu, Zn and Cdconcentrations in peat from the CNF, NC graph in comparison with data from Florida.……...………...46
14.Zn, Pb, Cu and Cd concentrations in ash from the CNF, NC graph in comparison with data from New York City……...……….47
15.Pb concentration in peat, in ash, Pb E.F. and Pb accumulation rate in CNF pocosin, NC….……….49
16.The 206Pb/207Pb comparisons profile between CNF NC Pocosin, Georgia swamp and Chesapeake Bay sediment………...………….49
Introduction
In the last several centuries, increasing industrial activity has introduced pollutant trace elements into the atmosphere on a global scale. These trace elements enter sedimentary environments via precipitation and dry deposition. The record of trace element deposition from the atmosphere can be tracked from ice cores (Candelone et al., 1994; Barbante et al., 2004), peat deposits (Shotyk, 1995; Coggins et al., 2006; Cloy et al., 2008) and lake sediments (Koinig et al., 2003). Due to the isolation of the peat deposition from nearby groundwater and surface water in most ombrotrophic bogs (Damman, 1986, 1987), the only water input to ombrotrophic peat bogs is precipitation; therefore the inorganic component of ombrotrophic peats is introduced from the atmosphere (Shotyk, 1995).
2
In the last 20 years, long and short-term trace element records in European peatland studies suggest that estimated trace element concentrations, flux and accumulation rates not only relate to the historical anthropogenic major events in different times such as the Industrial Revolution, but also act as indicators of local industrial activities on shorter time scales. Such activities involve, for example, leaded gasoline usage and industrial mining activities (Shotyk et al., 1998; Vleeschouwer et al., 2007; Cloy et al., 2008). Therefore, similar peatland records from other areas such as North America and Asia may show quite different trace elements deposition profiles compared with the European studies within the same time periods (Kamenov et al., 2009; Bao et al., 2010).
3
forest fires have been significant around the coastal forest for more than a century (Fowler and Konopik, 2007).
Major events in North Carolina are summarized in Table 1. Sand and gravel, crushed stone, and phosphate, as well as widespread agriculture, have all occurredalong the east coast of North Carolina. Their byproducts are the major potential sources of mineral dust deposition in coastal pocosins. The North Carolina Geological Survey (NCGS) reports that the primary source of crushed stone in the coastal plain is limestone. In the same area, phosphate mines have been developed for about 60 years (USGS) (Figure 1). The
historical populations and growth rates for the five major relevant counties are also shown in Figure 2 and 3.
Trace elements have been used as markers for different anthropogenic activities (Huang et al., 1994). Many studies have utilized lead (Pb) concentration profiles and accumulation rates to track historical local industrial activities such as leaded gasoline usage (Shotyk at el., 1998; Dunlap et al., 1999; Vleeschouwer et al., 2007). The spatial variability of these data imply regional lead pollution conditions (Rothwell et al., 2007; Novak et al., 2008). Also, lead isotope composition (206Pb/207Pb) has been compared among several areas as a signal to track other local industrial histories such as the sources of ore at different times (Shotyk at el., 1998; Bollhӧfer and Rosman, 2001; Cloy et al., 2008; Kamenov et al., 2009).
Besides Pb, other trace elements (Cu, Zn, Cd, Sn, Sb, Bi, V, Ni) are also discussed in this study to develop a better understanding of the local history of anthropogenic
4
indicator of atmospheric pollutant deposition in peatlands (Cochran et al., 1998; Mighall et al., 2009;Kamenov et al., 2009; Olid et al., 2010). Major elements such as Al, Fe, Mg, Mn, and Ti and minor trace elements of low geochemical mobility (REE, Th)were also analyzed. These elements can trace inputs of dust from silicate and oxide sources, while the elements of low solubility in normal conditions are concentrated in the ash fraction of the peat (Weiss et al., 2009; Shotyk et al., 2002; Kamenov et al., 2009). Therefore, ash content is an important factor in interpreting the concentrations of some elements in peat. “Ash” refers to the inorganic materials of peat, and is made up of minerals and ionically bound inorganics (Andrejko et al., 1983). Elements deposit in peat in the form of ash via precipitation and dry depostion. Typical ash content for ombrotrophic peat is below 5%, whereas minerotrophic (river-fed) peat usually has ash contents well above 5% (Weiss et al., 1999).
To study the last 100-200 years of peat deposition, 210Pb is commonly used to establish peat chronology (Appleby et al.,1997; Farmer et al., 2006; Novak et al., 2008; Cloy et al., 2008; Bao et al., 2010). Nuclear fallout 137Cs has also been used with 210Pb to help establish a more secure chronology (Oldfield et al., 1979; Oldfield et al., 1995; Appleby et al., 1997). 210Pb and 137Cs inventories in these studies reflect the regional
210
Pb and 137Cs deposition (Oldfield et al., 1979).
5
Site description
Methods
Field sampling
A 1.5 m long soil probewas used to test the thickness of the peat deposit in the study area. The sampling site was chosen when the testing probe easily reached deeper than one meter.Two peat cores were collected using stainless steel core tubes with inner diameters of 9.5 and 9.8 cm and a length of 50 cm. The two cores were located about 1.5 meters apart at the field site; Core 2 was at higher elevation by about 10-15 cm. Both cores were sealed immediately with rubber stoppers at both top and bottom. They were returned to Chapel Hill within six hours of collection and stored in a walk-in refrigerator (4°C) until subsampling.
Sample preparation
8
in Core 1 and 3.75cm depth in Core 2 (the beginning of trimming depth was based on the dryness and shape of the edge of each section). Leaves and roots were commonly found in the layers closest to the surface, and thicker roots were found at intervals through the entire cores. Peat depths containing roots were noted during sampling, and the larger roots were discarded. All samples were placed in pre-weighed polypropylene jars which were weighed and stored in a laboratory freezer (-12°C) after sampling in preparation for freeze drying. All the peat samples were freeze-dried at -40˚C or below for 72 hours.
The water content of the peat was determined by re-weighing samples after freeze-drying. Bulk density (g cm-3) was calculated from total dry mass of each sample divided by each increment volume. Increment volume was calculated from increment thickness and radius, after correcting the radius for any trimming (in Core 1, 1 mm for depth 18-22 cm, and 2 mm for depth > 22 cm). Ash content was determined by roasting dry peat samples in air. The furnace temperature was increased incrementally from 200 C to 500
C, and held over night at 500˚C. Ash weights were recorded and calculated as loss on ignition, which is interpreted as organic matter content.
137
Cs and 210Pb dating
137
9
efficiencies were calibrated with standards prepared from by mixing certified reference materials (uraninite from EPA, monazite from New Brunswick Lab, 137Cs from
Amersham International, now GE Healthcare) into purified cellulose fibers. The peaks in gamma spectra were manually integrated above baselines and corrected for backgrounds averaged at bi-weekly intervals. 226Ra was determined by its daughters 214Pb at 295.1 keV and 352 keV and 214Bi at 609.3 keV and 226Ra presents in situ supported 210Pb activity;
228
Ra was determined by its daughters 228Ac at 338.4 keV and 911.2 keV; 228Th was determined by 212Pb at 238.6 keV and 208Tl at 583 keV. 137Cs was measured by its emission at 661.7 keV. Excess 210Pb and 137Cs were decay-corrected to the date of collection using half-lives of 22.3 years and 30.1 years, respectively. The
excess/unsupported 210Pb is obtained from total 210Pb (210Po activity) minus supported
210
Pb (226Ra activity).
Total 210Pb activity was determined via its granddaughter 210Po on alpha
spectrometers in the Department of Geological Sciences. The methods of laboratory preparation and digestion were similar to the work of Benninger and Wells (1993). Five to 10 gr samples of dry peat were spiked with 209Po, and went through complete acid digestion in 10 mL concentrated HNO3, 2 mL HF, and 4 mL 1:1 sulfuric acid/water acid
on a hotplate for 4 days on average. An additional 5 mL concentrated HNO3 and 20 drops
of 30% H2O2 were added 1-3 times during digestion to promote complete dissolution.
The solution was evaporated to dryness and dissolved by heating into 50 mL 0.2N HNO3.
10
precipitation of hydroxides at pH 7-8. After dissolution of the precipitate into dilute HCl, Po was deposited onto silver disks for alpha spectrometry.
The CRS model for 210Pb dating was applied in this study and 137Cs was used as a single chronology marker within the core (Appleby and Oldfield, 1978; Oldfield et al., 1979; Robbins and Herche, 1993; Cochran et al., 1998). The constant rate supply of 210Pb (CRS) model is most suitable to produce this chronology; the underlying assumptions are that unsupported 210Pb flux is constant and that no obvious migration of 210Pb is observed in the sediment (Appleby and Oldfield, 1978; Robbins, 1978). Using CRS (Robbins and Herche, 1993), the age t (y) is obtained by:
t = − (1/λ) ln [1− Σ 210Pb (z)/Σ210Pb(∞)] (1)
where Σ210Pb(∞) is the total excess 210Pb inventory (Bq m-2), Σ 210Pb (z) is the accumulative excess 210Pb activity (Bq m-2) at the depth z (cm). λ is decay constant of
210Pb (λ = ln(2)/22.3 yr = 0.03108 y-1
) and t is age (y). 210Pb flux is obtained by:
210Pb flux = Σ210Pb(∞) × λ (2)
Major and trace element concentrations
For ICP-MS (inductively coupled plasma mass spectrometry) measurement of elemental concentrations, 0.25 g ash samples were digested in trace metal grade acids to extract trace metals. The HNO3-HF digestion method was applied after modification from
Yafa and Farmer, (2006). Nine mL concentrated HNO3 and 2mL diluted (HF:H2O = 1:1)
11
elements during the whole operation. The samples were heated at least overnight at 150˚C. After the solids were completely dissolved, the samples were evaporated down to 1 mL or less. The residue was dissolved into 20 mL 2% HNO3 by heating. All the
solutions were filtered (Whatman 542) and diluted into 50 mL polypropylene flasks. Solutions were filtered (0.2 μm polypropylene) and further diluted, as necessary, before concentrations were determined by ICP-MS (Varian 820-MS, Department of Chemistry). Indium was used as the instrumental internal standard.A total of 25 elements were assessed including five major elements (Al, Ti, Mn, Fe, Mg) and 20 trace elements (Cu, Zn, Sr , Cd, As, Sn, Sb, V, Pb, Bi, Ni, Zr, Rb, La, Ce, Pr, Nd, Sm, Th and U). Due to potential spectral overlap from 40Ar35Cl+, the As measurements may not be accurate (Olesik, 2000). The major and trace element test results were corrected by internal standard Tl and background samples, and calculated as both total peat and ash
concentrations. All the elements concentrations in total peat were used to examine the correlations among the elements and between the elements with ash content in the pocosinby using SAS 9.3 program.
Pb and Sr isotopes
The isotopic composition of Sr (87Sr, 86Sr) and Pb (204Pb, 206Pb, 207Pb and 208Pb) were determined by thermal ionization mass spectrometry (TIMS) in the Department of
Geological Sciences. Peat ash (20-50 mg) was digested in 1 mL concentrated HF and 1 mL 8M HCI on a hotplate at 150 ˚C for two hours, then evaporated to dryness. The residue was dissolved in 3mL 8.8M HNO3 and 3 mL 8M HCI on a hotplate overnight in
12
dissolved in 2 mL 0.5M HCI. Solutions were separated into two parts for Sr and Pb isotopes.
For Sr chemistry, the separated solution was dried and dissolved in 1 mL 3.5N HNO3,
then centrifuged. Eichrom SR-B100-S Sr Resin (about 200 µL) was used to collect Sr from the supernate. Before loading the sample, the resin was washed fully two times with MQ water (water that is purified through ion exchange) and 3.5N HNO3. After loading
the samples, they were rinsed multiple times with 3.5N HNO3 with a total volume of 1.84
mL. Each rinse was started by adding three 30 uL drops, followed by performing five consecutive additions of one 350 µL aliquot each.The Sr was collected in beakers by rinsing two times with 500 µL MQ water.
The separated HCl solutions for Pb isotopes were dried and re-dissolved in 525 µl 1.1N HBr. Pb isotopes were collected in about 200 µL Eichrom anion resin AG1×8. Before loading the samples, the resin columns were rinsed two times with 500 µl 6N HCL, 500 µl MQ water and equilibrated by 250 µl HBr. The sample were rinsed by single drop 1.1N HBr (five times), 500 µl HBr and 250 µl 2N HCl (one time bulk rinse), and Pb was eluted with 500 µl 6N HCl. The process was repeated for collecting
maximum Pb in samples. One drop of H3PO4 was added to both the final Sr and Pb
Results
Bulk properties
Bulk density increases rapidly with depth within the top 3 cm of the peat and stays around an average of 292 kg m-3 below 3 cm (Figure 5). Bulk density below the depth 17 cm is higher and more consistent compared to the values at shallower depths. The ash content of Core 1 is plotted as Loss on Ignition (Figure 5), and shows that within 10-30 cm depth, ash content is5%on average. However, below 30 cm, ash material of Core 1 significantly increases and exceeds 20% of the total peat. The average water content is 70.7% throughout the whole core, which is lower than the observation in Ingram’s (1987) study with an 80% average in the top 1.2 m.
Radiochemistry and peat chronology
The average supported 210Pb concentration is 9.8 ± 1.2 Bq kg-1, and the total excess
210
Pb inventory is 2828 ± 51 Bq m-2 in the CNF pocosin. In the unsupported 210Pb profile, the trend decreases from the surface to the depth of 12 cm in Core 1 (Figure 6). Two major peaks are shown in the main profile: one has the maximum activity (303 ± 9 Bq kg
-1
14
(Figure 6). Finite 137Cs exists through the whole core (i.e., 137Cs exceeds zero by two standard deviations in all samples). The maximum value of 137Cs activity is near the top of the core (2.25 cm depth) with 63.7 ± 1.5 Bq kg-1 and the other peak of 16.7 ± 0.8 Bq kg-1 is at 9 cm in Core 1. Complete radiochemistry results for cores 1 and 2 are presented in tabular form in the Appendices.
Based on the CRS model calculation, Core 1 provided about 120 years of peat depositional records between the surface and the depth of 20 cm (Figure 7). The peak of
137
15 Major elements abundance
Among the major elements (Al, Ti, Fe, Mg), Al and Ti have higher concentrations in peat above 10 cm and below 30 cm depth, which match the higher ash content deposition within the same depths through the core (Figure 8). The correlation table also shows strong correlations between Al, Ti and ash content (Table 3). Fe concentrations above 10 cm depth also increase with higher ash content but show no significant increasing trend below the depth of 30 cm. Mg concentration does not correlate with ash content (Table 3), and slowly increases from the bottom to the top of the core (Figure 8). The profiles of the major element Al, Ti and Fe accumulation rates have similar trends in the top 20 cm of the peat core (Figure 9), and it shows that between 1930 – 1984, Al, Ti, Fe accumulation rates slowly increased.
Trace elements abundance
The trace element concentrations in both peat and ash were obtained (Table 4 and 5). All trace elements except Zn and Sr have significant peaks in ash concentrations at the depth interval 12-13 cm (time interval 1930 – 1938). Excess 210Pb is finite at 29-30 cm depth, and the concentrations of many of the trace elements in ash have local maxima near this depth.
16
concentrations of other trace elements (Ni, Sb, Pb and Bi). In general, all the trace element concentrations in total peat increase when the ash content is high (Table 4). Several trace elements such as Pb, Sb, Bi and Ni have the maximum concentrations at depths of 8-9 cm (Figure 10), where the ash content is only moderately high. These elements are also highly correlated with each other and quite highly correlated with Fe (Table 3).
The trace elements Zr, La, Ce, Pr, Nd, Sm and Th have very low geochemical mobility and relatively low anthropogenic use compared with other elements such as Al, Fe, Cu, Zn, Pb, etc. Those elements all have high correlation with ash content as well as some major elements (Al, Ti, Mn) (Table 3). At the bottom of the core, REE
concentrations are much higher than the average values.
Accumulation rate and enrichment factor of trace elements
The accumulation rates of all the trace elements were computed by applying the CRS
210
Pb dating model for the secure chronology in the last 100 years. The enrichment factor (E.F.) of all the trace elements was also produced and calculated by Ti and its crustal background (Shotyk et al., 2002):
E.F.= (Conc.X/Conc.Ti)sample/(Conc. X/Conc. Ti)UCC background
where X is a trace element; Conc. is mass-based concentration; and UCC is upper continental crust. UCC concentrations for selected trace elements X and Ti are the
17
towards the core top, and they show three obvious peaks in their E.F. profiles at the depth intervals 12-13 cm, 28-29 cm and 38-39 cm, although three elements are significantly enriched in the samples Pb×4, Cd×20 and Bi×50 at their maximum values.
Pb and Sr isotopes
Pb and Sr isotopic compositions are shown in Table 7. The ratios of 206Pb/207Pb,
206
Pb/204Pb, 207Pb/204Pb and 208Pb/204Pb display relatively constant values above the depth of 30 cm, and all the ratios increase dramatically below 30 cm of the core (Figure 11). Previous studies from other locations in the southeastern United States show similar
206
Pb/207Pb ratios (about 1.20) from 1970 to present and lower 206Pb/207Pb ratios (about 1.19)between 1900 and 1970 (Jackson et al., 2004; Kamenov et al., 2009). Bollhӧfer and Rosman (2001) summarized the range of 206Pb/207Pb isotope ratios from 75 studies in the Northern Hemisphere (United States, 1.159 – 1.231; Western Europe, 1.097 – 1.165; Asia, 1.091 – 1.177).
Discussion
Pocosin ombrotrophic and minerotrophic characteristics
At the bottom of the core (below 30 cm), the significantly higher ash content may reflect the transitional character from a mineralogical fen to an ombrotrophic bog. The high organic content shows the ombrotrophic character of the pocosin between depths of 10-30 cm. Above 10 cm, high ash content (greater than 10%) (Figure 5) implies that the peat in the study site has accepted significant soil-dust deposition. The high ash content in this top layer which represents the past 50 years may relate to the frequent forest fires in the CNF pocosin. Below 30 cm of the core, the extensive ash content with higher Al, Ti, Zr and REE concentrations reveals that the materials are most likely derived from the underlying regolith, implying a minerotrophic character. Additionally, from the contour map of peat thickness reported in Ingram (1999), the range of peat thickness around the study site is about 0-1 m deep. It suggests that the source of the bottom material of the core is possibly from underlying soil or bedrock.
Sediment chronology
19
proposed that 210Pb was mobile under the water table. In that case, the part of peat preserved under the water table would contain less 210Pb deposition, jeopardizing the chronology. Thus, the problem is more significant where the water table is shallow (beneath hollows) than where it is deeper (beneath hummocks). In consequence, lower
210
Pb inventory and younger age from 210Pb dating were often observed in the cores that were collected from hollows in peat bogs. Although we did not measure the water table of the study site, due to the facts that the water table was shallow during the field sampling and the nearby ditch was also shallow, the water table in the CNF pocosin should be shallow. However, at the study site, no obvious surface elevation changes were observed. Therefore, whether 210Pb activities near the top of the core could be affected by the water table in this study needs more evidence to further advance this discussion.
There are two unexpected small peaks at approximately 20 cm and 30 cm in the 210Pb and 137Cs activities profiles. They indicate vertical transportations that took more recent
210
Pb and 137Cs deposition into the deeper peat during the last century. Since there were no visible live animals or burrows throughout the whole core, bioturbation is not a likely explanation.
20
vegetation (Eriophorum vaginatumwith rich roots) in Oldfield et al., (1979). The abundant leaves and a few thin roots near the top core samples suggest the possibility of the upper plants effects on 137Cs in this study.
Similar 137Cs trends were also found in other studies. Olid et al., (2010) discussed profiles of 137Cs and 241Am in peat from the NW Iberian Peninsula, in which both 137Cs and 241Am have peak activities around 1963 at three out of the four study sites, and the maximum activities of 137Cs also appear to be near the surface at those study sites. However, studies from the west of Ireland (Coggins et al., 2006) and the Great Hinggan Mountains in NE China (Bao et al., 2009) only observed one peak from the 137Cs
concentration profiles corresponding to 1963, from the fallout deposition of atmospheric testing of nuclear weapons.
Major elements, Zr and REE
Al, Mg, Ti, Mn, Zr and REE were tested to track the characteristics of the original soil/dust source or mineral mines inputs that influenced the pocosin (Weiss et al., 1999; Shotyk et al., 2002b). In CNF pocosin, Al, Ti, Mn, Zr and REE concentrations in peat strongly correlate with ash content through the whole core (Table 3), which reveals that their concentrations increase with enhanced mineral deposition. However, Fe
concentrations do not correlate with Al and Ti, but highly correlate with Pb in the core (Table 3). The reason for the high correlation between Pb and Fe remains unclear.
21
Table 3 suggests that either of them can be used as an index to present the original mineral dust input in the peat, as well as a factor in the background of enrichment factor calculation.
Mineral sources that are high in silica can result in increasing Al and Fe levels in peat. They can be from the mining of non-metal minerals, such as crushed stone and
construction sand and gravel, which are widely distributed in the coastal plain of North Carolina. Raven and Loeppert (1997) found abundant Fe, Mn and Ti in rock phosphate samples. Therefore, the mining process of phosphate in Beaufort County (about 80 km north of CNF, Figure 1) could have introduced Fe, Mn and Ti to the study site over the last 60 years (Stuckey, 1965). Additionally, more activities such as the deforestation and agriculture expansion that introduce enhance dust deposition could also have increased these elements concentrations.
The nature of the mixed-vegetation (pine tree and shrub) in the Croatan National Forest (CNF) makes it difficult to approach the study site. Therefore, the study site was chosen close to secondary gravel roads and small ditches (Figure 4). This location raises the issue that the process of building roads could have introduced dust to the site.The material of the road is mostly limestone, and it may contain silicate sand. Thus, crushed stone mines, construction sand and gravel, phosphate mines, local farming and road construction could have been the primary external sources of dust to the CNF pocosin.
Trace element deposition in CNF pocosin
22
were probably mainly introduced from mineral dust, whereas the group 2 (Ni, Zn, Rb, As, Sb, Sr, Pb and Bi) ones that have relatively weak correlation with ash content may have also been introduced by other anthropogenic sources (Table 3). In the last century, most trace elements concentrations in ash start to increase from the depth 17 cm to 13 cm, corresponding with the year from 1905 to 1930. This may represent the period of the beginning of North Carolina industrialization. At these same depths, however, their concentrations in the total peat do not have a peak, which is due to the low ash content (less than 5%).
The enrichment factor (E.F.) of trace elements is used to distinguish the earth material background from anthropogenic input (Shotyk, 2002a). The higher E.F. of certain
element(s) can be caused by extensive anthropogenic input. From the results of the E.F. calculation in this study, a number of trace elements have E.F. values lower than 1.0 (Table 6), while and their profiles still display obvious variations. Most the trace elements E.F. above 16 cm (after the year of 1893) are higher than those values at the bottom core. This suggests the significant anthropogenic source input in the last 120 or so years. Enrichment factors show that the soil material in the CNF demonstrates a localized and thin upper continental crust layer, instead of the average upper continental crust in North America (Rudnick and Gao, 2004).
Trace elements group one
23
the coastal plain of North Carolina. The strong correlation between these elements and major elements Ti and Al in peat indicate that these trace elements were deposited in proportion to the input of weathered minerals. Pocosin forest fires can also significantly affect trace elements concentrations in peat. When they occurred, parts of vegetation and peat were turned into ash, resulting in a thinner layer of peat with higher ash content.
Cu is one of the most commonly reported trace elements (Pb, Cu, Zn) in studies of atmospheric deposition. In southeastern Florida, the Cu trace element concentrations are close to the levels shown in this study (Kamenov et al., 2009). The comparisons in Figure 13 reveal Cu concentrations trends are different between the two studies, showing no increasing trend near the surface of Core 1 from CNF pocosin. The comparison may imply the difference in Cu usage in the recent years between Florida and North Carolina. In New York City, Cochran et al., (1998) observed that the two salt marshes have high Cu concentrations in ash, which are about six times higher than the records in CNF pocosin (Figure 14), suggesting greater Cu pollution in NYC.
The Cd maximum concentration in the CNF pocosin is 1.18 ppm at depths of 34-35 cm (Table 5, Figure 13) which is much higher than the maximum Cd concentration in the Florida peat sediment (0.072 ppm) (Kamenov et al., 2009). Cd concentration (ash) in North Carolina is also higher than the ones in New York City (Figure 14). The possible sources of Cd in North Carolina are the nearby phosphate mines, and coal-fired power plants fly ash (Querol et al, 1999).
24
between the trace elements in North Carolina phosphate rock (Raven and Loeppert, 1997) and that in CNF pocosin, it is possible that Cu, Zn, Rb, Sr, Zr, Cd and U elements are introduced from dust suspended during phosphate mining.
Trace elements group two
The other group elements (Ni, Zn, Rb, As, Sb, Sr, Pb and Bi) have weak correlations with ash content that may be influenced by other different anthropogenic sources such as leaded gasoline usage and coal combustion during the last century. These records can also be affected by the local population growth rate and the distances from the coal-fired power plants to the study site.
Different Pb records in the CNF (Figure 15) indicate that the industrialization and the introduction of leaded gasoline could have dominated the Pb sources during the period between 1908 and 1933. After 1933, Pb accumulation rate rapidly increased until the year 1970, which coincides with a period of growing usage of leaded gasoline in North
Carolina. Therefore, leaded gasoline usage may be one of the dominating Pb sources in the area during this period. Moreover, Pb emissions are also affected by the growth rate of populations in the surrounding counties, which correlate with the number of leaded gasoline-using vehicles on roads. Within the five adjacent counties, the highest
population growth rates were found in the 1950s and 1960s, which match the rapid Pb accumulation rate during the same period (Figure 15). Between 1970 and 1983, the Pb concentrations were lower than the previous period in both peat and ash, and Pb
25
may be related to other Pb sources such as the coal combustion in the area, phosphate mines in Beaufort county and dust from phosphate fertilizer (Raven and Loeppert, 1997).
The comparisons of Pb between different regions in the United States are shown in Figure 13 and 14. Both Florida (Kamenov et al. 2009) and CNF peat contain Pb maxima at depths corresponding to 1970. It suggests the similarity in leaded gasoline usage period between Florida and North Carolina. Cochran et al., (1998) observed that the two salt marshes in New York City have high fluxes of Pb in ash. Comparison shows their
concentrations in ash are several times higher (Pb×9) than the records in the CNF pocosin (Figure 14), which implies greater trace metal pollution in cities such as New York City. The same comparisons for Zn also indicated the similar Zn maxima nearer the core tops in Florida, while a higher concentration was observed in NYC (Zn×5) relative to that in North Carolina. This supports the notion that extra Pb can be from the emissions from motor vehicles (Huang et al, 1994), and that more Pb and Zn can be released to the atmosphere near a denser populations and heavier-traffic areas.
26
The very strong correlation (r is great than 0.8, Table 3) between Pb concentration and some other elements (Ni, As, Sb, Bi) concentrations suggest they were probably introduced from similar anthropogenic sources. Sb, Bi and Ni all have their highest concentrations (in peat) at depths of 8–9 cm (time interval 1959 – 1969) (Table 4, Figure 10). The excess Sb and Bi are most likely from anthropogenic input since their
concentrations are very low in fresh water and they are relatively volatile (Kamenov et al., 2009). The high Sb, Bi and Ni concentrations between 1960 and 1975 in CNF pocosin may be from motor vehicle emissions (Huang et al., 1994). Previous studies have shown that fossil fuel combustion, coal mining and fly ash from coal-fired power plants often carry extra Sb, Bi and Ni into the atmosphere (Kaakinen et al., 1975; Querol et al, 1999; Kamenov et al., 2009). Coal burning has constituted a large fraction of the energy generation of North Carolina, although coal mining has not been significant. Therefore, coal combustion could be one of the Sb, Bi and Ni sources in CNF pocosin.
In general, the elements (V, Cu, Zr, Cd, Sn, La, Ce, Pr, Nd, Sm, Th and U) that strongly correlate with ash content were possibly introduced by the dust from phosphate mines, agricultural soil, crushed stone mines and fly ash from coal combustion. The other group of elements (Ni, Zn, Rb, As, Sb, Sr, Pb and Bi) that do not show strong correlation with ash content may have been mainly emitted by motor vehicles, particularly cars that used leaded gasoline, and also by coal combustion.
Sources to the CNF pocosin based on Sr and Pb isotopes
27
old sialic rock (0.720 ± 0.005) and marine carbonate rocks (0.708 ± 0.001). The 87Sr/86Sr ratio in the modern seawater is 0.70918 (Frank, 2002), whereas the average 87Sr/86Sr ratio in CNF pocosin is 0.71361 ± 0.00047. The high 87Sr/86Sr ratio (above 0.71196)
throughout the whole core implies that the radiogenic Sr sources dominate the deposition in the CNF. The bedrock of CNF pocosin is fossiliferous clay and sand, shelly sand, sandy marl and limestone that formed in the Tertiary. The high 87Sr/86Sr ratio in the bottom core (below 30 cm) also implies that the underlying rock may contain more sialic rocks which usually have a higher 87Sr/86Sr ratio. The less radiogenic Sr sources at depth of 12 cm suggest that the additional materials such as marine aerosols with low 87Sr/86Sr ratio character were deposited in the CNF pocosin around 1940’s. Tobiassen (1982) measured the 87Sr/86Sr ratio (0.70790-0.70935) in phosphate grains from the Miocene Pungo River formation in North Carolina. Therefore a marine isotopic signature can be introduced from anthropogenic activities such as phosphate mining and crushed stone (shell limestone) mining in coastal plain during the last 100 years.
28
years. Similarly high 206Pb/207Pb ratios were found in Georgia (Jackson et al., 2004) for the last 50 years and in the Chesapeake Bay area (Marcantonio et al., 2002) for the last 35 years.
Coal combustion has also been claimed to be an important source of Pb in North America, Western Europe and East Asia (Bollhӧfer and Rosman, 2001; Diaz-Somoano et al., 2009). Diaz-Somoano et al., (2009) observed that the 206Pb/207Pb in coal from the U.S. ranges from 1.1907 – 1.2314 and that 208Pb/206Pb ranges from 2.0201 – 2.0829. These Pb isotopic records in coal are comparable with those in CNF pocosin (206Pb/207Pb: 1.1992 – 1.2366; 208Pb/206Pb: 2.0479 – 2.0851). Therefore, coal combustion could also be one of the major Pb sources in North Carolina during the last 100 years.
Figure 17 shows the comparison of Pb isotopic compositions (207Pb/206Pb and
208
Conclusion
The Croatan National Forest pocosin, even though it has both ombrotrophic and minerotrophic characteristics, can be used as an archive of the atmospheric deposition of trace elements such as lead. The distribution of pocosin peat in North Carolina offers many opportunities to expand this study to different locations in the coastal plain and to conduct more detailed analysis with longer sample cores, which will provide more information about the local history.
By using both 210Pb and fallout radionuclides, along with trace elements
concentrations and Pb isotopes, a robust chronology was constructed. Mobility of 210Pb, Pb and other trace elements concentration is possible due to the water table influence on the peat; however, further work is would be needed to better evaluate that possibility. Additionally, the 137Cs was moving chemically in the peat, independent of the effects of plants. Therefore, additional analysis testing immobile radionuclides such as 242Pu or
241
Am could help to better define the peat chronology.
The recent lead input reflects the local/regional lead emissions from industrial
30
phosphate mines, crushed stone mines, forest fires, road construction and coal
Table 1 North Carolina local anthropogenic history.
Time Period Historical Events
1500s to 1700s Early European Settlers, fire for agriculture purpose in Southern U.S.1
1800 to mid-1800’s Gold mines started and the most significant production period in North Carolina. 2
1890s to1920s Industrialization; initiation of a variety of mines (i.e. gold mines); the rapid growth in the timber industry and
associated logging led to increasingly numerous, intense and widespread fires. Many Coastal Plain forests were
slashed-and-burned, or often accidentally ignited, causing more severe fires, especially for 12 NC counties in
1894. 1,2
1905 The first production of sand and gravel, crushed stone in the coastal Plain of North Carolina. 2,3
1920s to 1940s In the southern U.S., fire suppression (not allowing fires) was sponsored in this period, which allowed
Appalachian hardwood forests with other species, replacing many areas of oak/pine fire-tolerant species.1
1923 Introduction of leaded gasoline in U.S.4
1950s The highest population change/growth rate (53.1%) in the adjacent counties (Figure 2, 3).
1951-1958 The first phosphate mines in Beaufort county.2
1960s The second highest population change/growth rate (43.2%) in the adjacent counties (Figure 2, 3);
Renewed phosphate mines in Beaufort county.2
1973 Leaded gasoline phaseout began4
1990s Regular wildland fire by forest fire management in the coastal plain.1
1
Fowler and Konopik, 2007; 2 Stuckey, 1965; 3 NCGS: http://www.geology.enr.state.nc.us/Mineral; 4 US EPA.
Table 2 Peat accumulation rate, 210Pb inventory and atmospheric 210Pb flux comparisons from different atmospheric deposition sites.
a
Calculated value using 22.3 yr as the half-life of Pb.
Country Region/Site Peat accumulation
rate
(gcm-2yr-1)
210
Pb inventory
(Bqm-2)
Atmospheric
210
Pb flux
(Bqm-2yr-1)
References
Switzerland
UK
NW Iberian
Tramelan, bogs
Glasgow, peat bog
Galicia, mires 0.02-0.04 0.027-0.040 - 4690 3380-3500 4994-10135 146
106-109 a
155-315 a
Appleby et al., (1997)
Mackenzie et al., (1998)
Olid et al.,(2010)
United States North Carolina, pocosin
North Carolina, salt marshes
Florida, marshes
Florida, marshes
New York, bog
New York, salt marsh
East U.S., undisturbed soil
Raleigh, NC
Bluff Mountain, NC
0.01-0.09
-
0.0035 (ash)
-
0.02 a, 0.0017(ash)a
- 2829 4220, 4560 3980-7585 1916-3966 2667-9000 3404 3200-6333 4483 5567 88 131, 142
124-236 a
60-123a
83-279 a
106
99-197 a
139 a
173 a
This study
Benninger and Wells, (1993)
Kamenov et al., (1997)
Brenner et al., (2001)
Cochran et al., (1997)
Urban et al., (1990)
Graustein and Turkian, (1986)
Table 3 Elements concentrations correlation relationship table. Dark grey represents very strongly correlated elements (Correlation Coefficient > 0.8); Light grey represents strong correlated elements relationship (Correlation Coefficient is from 0.8-0.6). r is considered statistically significant when p < 0.05.
Mg -0.39 1
0.078
Al 0.803 -0.14 1
<.0001 0.556
Ti 0.905 -0.62 0.767 1
<.0001 0.003 <.0001
Fe 0.053 0.577 0.428 -0.15 1
0.819 0.006 0.053 0.523
Mn 0.947 -0.34 0.881 0.864 0.208 1
<.0001 0.127 <.0001 <.0001 0.365
V 0.939 -0.51 0.871 0.973 0.052 0.93 1
<.0001 0.019 <.0001 <.0001 0.823 <.0001
Ni 0.326 0.46 0.538 0.093 0.826 0.382 0.283 1
0.149 0.036 0.012 0.687 <.0001 0.087 0.213
Cu 0.853 -0.38 0.776 0.815 0.108 0.856 0.869 0.481 1
<.0001 0.093 <.0001 <.0001 0.641 <.0001 <.0001 0.028
Zn 0.533 0.075 0.675 0.308 0.631 0.691 0.472 0.615 0.493 1
0.013 0.747 8E-04 0.175 0.002 5E-04 0.031 0.003 0.023
Rb 0.534 -0.11 0.805 0.512 0.401 0.739 0.609 0.283 0.51 0.763 1
0.013 0.632 <.0001 0.018 0.071 1E-04 0.003 0.215 0.018 <.0001
Sr 0.44 0.089 0.694 0.299 0.53 0.653 0.432 0.432 0.454 0.891 0.923 1
0.046 0.701 5E-04 0.188 0.013 0.001 0.051 0.05 0.039 <.0001 <.0001
Zr 0.933 -0.6 0.758 0.992 -0.16 0.882 0.971 0.12 0.852 0.327 0.503 0.313 1
<.0001 0.004 <.0001 <.0001 0.499 <.0001 <.0001 0.606 <.0001 0.148 0.02 0.167
Cd 0.954 -0.52 0.807 0.979 -0.05 0.922 0.979 0.217 0.879 0.405 0.559 0.386 0.992 1
<.0001 0.015 <.0001 <.0001 0.843 <.0001 <.0001 0.345 <.0001 0.068 0.008 0.084 <.0001
As 0.536 0.295 0.744 0.367 0.793 0.597 0.531 0.927 0.603 0.657 0.47 0.519 0.378 0.474 1
0.012 0.195 1E-04 0.102 <.0001 0.004 0.013 <.0001 0.004 0.001 0.032 0.016 0.091 0.03
Sn 0.839 -0.29 0.913 0.867 0.314 0.885 0.933 0.426 0.778 0.503 0.665 0.473 0.851 0.891 0.691 1
<.0001 0.195 <.0001 <.0001 0.166 <.0001 <.0001 0.054 <.0001 0.02 0.001 0.03 <.0001 <.0001 5E-04
Sb 0.54 0.176 0.781 0.429 0.765 0.688 0.58 0.731 0.581 0.669 0.68 0.651 0.431 0.534 0.884 0.789 1
0.012 0.446 <.0001 0.052 <.0001 6E-04 0.006 2E-04 0.006 9E-04 7E-04 0.001 0.051 0.013 <.0001 <.0001
La 0.792 -0.02 0.871 0.685 0.362 0.814 0.769 0.444 0.687 0.566 0.741 0.641 0.712 0.773 0.67 0.818 0.75 1
<.0001 0.917 <.0001 6E-04 0.107 <.0001 <.0001 0.044 6E-04 0.008 1E-04 0.002 3E-04 <.0001 9E-04 <.0001 <.0001
Ce 0.874 -0.14 0.883 0.786 0.257 0.87 0.851 0.399 0.756 0.544 0.707 0.593 0.812 0.86 0.638 0.855 0.7 0.984 1
<.0001 0.544 <.0001 <.0001 0.261 <.0001 <.0001 0.073 <.0001 0.011 3E-04 0.005 <.0001 <.0001 0.002 <.0001 4E-04 <.0001
Pr 0.828 -0.12 0.889 0.762 0.288 0.846 0.829 0.388 0.721 0.534 0.745 0.614 0.782 0.833 0.638 0.861 0.727 0.991 0.994 1
<.0001 0.608 <.0001 <.0001 0.206 <.0001 <.0001 0.082 2E-04 0.013 1E-04 0.003 <.0001 <.0001 0.002 <.0001 2E-04 <.0001 <.0001
Nd 0.836 -0.14 0.897 0.775 0.286 0.856 0.842 0.388 0.731 0.537 0.748 0.613 0.794 0.843 0.64 0.872 0.731 0.988 0.994 1 1
<.0001 0.555 <.0001 <.0001 0.21 <.0001 <.0001 0.082 2E-04 0.012 <.0001 0.003 <.0001 <.0001 0.002 <.0001 2E-04 <.0001 <.0001 <.0001
Sm 0.84 -0.15 0.908 0.786 0.299 0.866 0.855 0.395 0.737 0.542 0.755 0.614 0.801 0.851 0.65 0.891 0.748 0.983 0.991 0.997 0.999 1
<.0001 0.529 <.0001 <.0001 0.188 <.0001 <.0001 0.077 1E-04 0.011 <.0001 0.003 <.0001 <.0001 0.001 <.0001 <.0001 <.0001 <.0001 <.0001 <.0001
Pb 0.232 0.468 0.543 0.052 0.947 0.372 0.241 0.828 0.285 0.591 0.439 0.501 0.05 0.163 0.859 0.514 0.897 0.511 0.42 0.449 0.45 0.467 1
0.311 0.033 0.011 0.822 <.0001 0.097 0.293 <.0001 0.211 0.005 0.046 0.021 0.829 0.479 <.0001 0.017 <.0001 0.018 0.058 0.041 0.041 0.033
Bi 0.599 0.153 0.797 0.485 0.737 0.695 0.633 0.766 0.613 0.621 0.575 0.532 0.483 0.578 0.92 0.832 0.971 0.737 0.705 0.72 0.725 0.744 0.883 1
0.004 0.507 <.0001 0.026 1E-04 5E-04 0.002 <.0001 0.003 0.003 0.006 0.013 0.027 0.006 <.0001 <.0001 <.0001 1E-04 4E-04 2E-04 2E-04 1E-04 <.0001
Th 0.925 -0.42 0.855 0.943 -0.02 0.88 0.955 0.207 0.812 0.365 0.586 0.394 0.95 0.955 0.461 0.882 0.516 0.841 0.912 0.894 0.901 0.906 0.18 0.562 1
<.0001 0.055 <.0001 <.0001 0.946 <.0001 <.0001 0.368 <.0001 0.104 0.005 0.077 <.0001 <.0001 0.035 <.0001 0.017 <.0001 <.0001 <.0001 <.0001 <.0001 0.434 0.008
U 0.912 -0.47 0.843 0.962 0.013 0.868 0.982 0.271 0.838 0.361 0.511 0.309 0.956 0.957 0.507 0.919 0.525 0.743 0.827 0.805 0.817 0.829 0.214 0.605 0.959
<.0001 0.031 <.0001 <.0001 0.955 <.0001 <.0001 0.235 <.0001 0.108 0.018 0.173 <.0001 <.0001 0.019 <.0001 0.015 1E-04 <.0001 <.0001 <.0001 <.0001 0.352 0.004 <.0001
Ash Mg Al Ti Fe Mn V Ni Cu Zn Rb Sr Zr Cd As Sn Sb La Ce Pr Nd Sm Pb Bi Th
Table 4 Trace elements concentration in peat (uncertainties estimated at ≤ 10%) from Croatan National Forest pocosin, NC, U.S. Depth cm V ppm Ni ppm Cu ppm Zn ppm Rb ppm Sr ppm Zr ppm Cd ppm As ppm Sn ppm Sb ppm La ppm Ce ppm Pr ppm Nd ppm Sm ppm Pb ppm Bi ppm Th ppm U ppm LOI %
0.5-2.25 9.46 2.79 5.95 11.6 5.41 33.8 12.5 0.425 0.914 0.480 0.287 4.83 7.99 1.10 3.93 0.689 9.09 0.908 1.24 0.457 85.9
4-5 15.0 4.86 5.10 15.3 3.91 27.7 16.2 0.526 1.88 0.814 0.340 5.94 10.9 1.38 4.95 0.867 15.2 1.61 1.69 0.793 74.5
6-7 7.17 3.57 3.70 5.22 2.07 11.0 8.27 0.348 1.30 0.597 0.293 4.27 6.78 0.943 3.33 0.580 13.1 1.34 1.05 0.514 89.2
8-9 13.3 5.21 6.06 6.87 1.80 13.3 13.7 0.513 2.02 1.12 0.544 6.05 10.1 1.36 4.93 0.903 25.3 2.53 1.63 0.853 81
10-11 3.94 2.70 2.05 2.42 1.11 8.66 4.71 0.207 1.01 0.349 0.202 2.94 4.98 0.713 2.51 0.441 7.34 0.870 0.677 0.343 94.8
12-13 1.94 1.88 1.70 1.52 0.396 5.84 2.40 0.099 0.625 0.168 0.083 1.43 2.49 0.355 1.23 0.212 2.94 0.367 0.389 0.217 98.2
14-15 3.05 2.77 2.59 1.51 0.677 6.78 4.46 0.154 0.933 0.265 0.094 2.38 4.09 0.574 1.98 0.334 4.27 0.457 0.809 0.404 96.1
16-17 4.31 2.45 2.67 0.872 0.493 6.08 5.83 0.183 0.772 0.217 0.074 3.15 4.75 0.627 2.13 0.357 4.15 0.438 0.962 0.423 91
18-19 6.00 2.57 3.03 3.43 0.203 6.45 8.40 0.252 0.800 0.266 0.074 2.37 4.48 0.509 1.76 0.310 4.85 0.527 0.966 0.572 87.9
20-21 5.84 2.39 2.79 4.06 0.300 5.93 8.59 0.253 0.705 0.285 0.077 2.55 4.63 0.533 1.84 0.319 4.50 0.498 1.03 0.514 87.9
22-23 5.56 2.21 2.68 3.52 0.075 4.53 7.72 0.218 0.634 0.233 0.062 1.13 2.28 0.268 0.959 0.175 3.68 0.380 0.703 0.451 90.8
24-25 6.29 2.73 3.64 3.17 0.043 4.50 7.59 0.212 0.768 0.226 0.071 0.771 1.62 0.194 0.711 0.133 4.36 0.401 0.612 0.464 91.4
26-27 5.49 2.87 3.96 1.30 0.124 5.43 6.99 0.197 0.860 0.225 0.079 1.90 3.62 0.455 1.63 0.289 4.54 0.521 1.33 0.493 90.9
28-29 7.29 3.60 5.63 2.73 0.074 5.18 10.5 0.307 1.08 0.296 0.120 1.11 2.22 0.258 0.934 0.172 5.24 0.482 0.818 0.571 92.4
30-31 9.45 3.57 6.29 3.36 0.104 5.50 14.2 0.404 1.19 0.455 0.145 0.824 1.71 0.207 0.759 0.139 5.10 0.942 0.704 0.625 91
32-33 5.94 1.56 3.32 1.33 0.145 3.63 11.7 0.311 0.585 0.308 0.085 0.941 2.07 0.256 0.949 0.176 2.22 0.434 0.679 0.406 91.9
34-35 23.0 4.01 10.0 8.84 1.70 14.5 42.3 1.20 1.52 0.973 0.283 7.53 15.5 1.82 6.53 1.11 7.34 1.46 3.10 1.25 50.4
36-37 20.3 2.64 6.96 3.77 2.02 12.1 37.4 1.02 1.17 0.908 0.237 5.85 12.4 1.52 5.48 0.975 5.10 1.06 2.76 1.11 67.2
38-39 15.3 1.84 5.02 2.27 2.30 9.46 27.4 0.727 0.886 0.783 0.181 5.95 10.6 1.46 5.23 0.893 4.08 0.837 2.30 0.937 80.5
40-41 27.4 2.98 8.39 5.27 3.96 15.4 43.2 1.15 1.27 1.38 0.288 7.76 15.8 2.06 7.49 1.33 7.08 1.46 3.69 1.59 64.6
42-43 20.1 2.13 5.22 6.00 2.41 10.3 31.7 0.844 0.924 1.03 0.216 2.36 5.51 0.711 2.69 0.520 5.45 1.13 2.17 1.13 71.5
Table 5 Trace elements concentrations in ash (uncertainties estimated at ≤ 10%) from Croatan National Forest pocosin, NC, U.S. Depth interval cm V ppm Ni ppm Cu ppm Zn ppm Rb ppm Sr ppm Zr ppm Cd ppm As ppm Sn ppm Sb ppm La ppm Ce ppm Pr ppm Nd ppm Sm ppm Pb ppm Bi ppm Th ppm U ppm
0.5-2.25 67.1 19.8 42.3 82.3 38.4 240 88.5 3.02 6.49 3.41 2.04 34.3 56.8 7.81 27.9 4.90 64.5 6.45 8.80 3.24
4-5 58.7 19.0 20.0 59.8 15.3 109 63.6 2.06 7.36 3.19 1.33 23.3 42.6 5.39 19.4 3.40 59.5 6.33 6.62 3.11
6-7 66.7 33.2 34.4 48.5 19.2 102 76.9 3.23 12.1 5.55 2.72 39.7 63.1 8.77 30.9 5.39 122 12.4 9.73 4.78
8-9 69.6 27.4 31.8 36.1 9.47 69.8 71.7 2.70 10.6 5.86 2.86 31.8 53.3 7.16 25.9 4.74 133 13.3 8.55 4.48
10-11 76.1 52.2 39.6 46.7 21.4 167 91.1 4.01 19.5 6.74 3.90 56.7 96.3 13.8 48.5 8.53 142 16.8 13.1 6.62
12-13 105 102 92.4 82.4 21.5 317 130 5.37 33.9 9.15 4.53 77.9 135 19.3 67.0 11.5 160 19.9 21.1 11.8
14-15 78.2 70.9 66.4 38.7 17.4 174 114 3.94 23.9 6.79 2.40 61.0 105 14.7 50.8 8.58 110 11.7 20.8 10.4
16-17 47.7 27.1 29.6 9.66 5.46 67.3 64.6 2.02 8.55 2.40 0.814 34.9 52.6 6.95 23.6 3.96 45.9 4.86 10.7 4.69 18-19 49.6 21.2 25.1 28.4 1.68 53.3 69.5 2.08 6.62 2.20 0.609 19.6 37.0 4.21 14.6 2.56 40.2 4.36 7.99 4.73 20-21 48.2 19.7 23.0 33.5 2.47 48.9 70.9 2.08 5.82 2.35 0.635 21.0 38.2 4.40 15.2 2.63 37.1 4.11 8.53 4.24 22-23 60.2 23.9 29.0 38.1 0.811 49.1 83.7 2.36 6.87 2.52 0.671 12.2 24.7 2.91 10.4 1.89 39.9 4.12 7.61 4.89 24-25 72.9 31.6 42.1 36.7 0.500 52.2 87.9 2.46 8.90 2.62 0.825 8.94 18.7 2.24 8.24 1.54 50.5 4.65 7.09 5.37 26-27 60.6 31.7 43.7 14.4 1.37 59.8 77.1 2.18 9.48 2.48 0.876 21.0 39.9 5.02 18.0 3.19 50.0 5.74 14.6 5.44 28-29 95.5 47.2 73.8 35.8 0.969 67.9 138 4.02 14.1 3.88 1.58 14.6 29.1 3.38 12.2 2.25 68.7 6.32 10.7 7.48
30-31 105 39.6 69.7 37.3 1.16 61.0 158 4.48 13.1 5.05 1.61 9.14 18.9 2.30 8.43 1.55 56.5 10.5 7.81 6.93
32-33 73.7 19.3 41.1 16.5 1.79 45.0 145 3.86 7.26 3.82 1.06 11.7 25.7 3.17 11.8 2.18 27.5 5.38 8.41 5.03 34-35 46.3 8.08 20.2 17.8 3.44 29.3 85.3 2.42 3.07 1.96 0.572 15.2 31.3 3.67 13.2 2.25 14.8 2.94 6.25 2.52 36-37 61.9 8.06 21.2 11.5 6.16 37.0 114 3.10 3.58 2.77 0.722 17.9 37.7 4.63 16.7 2.98 15.5 3.23 8.44 3.38 38-39 78.5 9.43 25.7 11.6 11.8 48.4 140 3.72 4.54 4.01 0.929 30.4 54.1 7.48 26.8 4.57 20.9 4.28 11.8 4.79 40-41 77.4 8.42 23.7 14.9 11.2 43.4 122 3.24 3.59 3.89 0.813 21.9 44.5 5.81 21.2 3.75 20.0 4.12 10.4 4.48 42-43 70.6 7.45 18.3 21.0 8.43 36.1 111 2.96 3.24 3.62 0.76 8.25 19.3 2.49 9.44 1.82 19.1 3.94 7.61 3.97
36
Table 6 Enrichment factor (E.F.) of trace element in CNF pocosin, U.S.
Depth
(cm) Al Mn Fe Mg V Ni Cu Zn Rb Sr Zr Cd
0-2.25 0.64 0.08 0.17 2.8 0.35 0.21 0.76 0.62 0.10 0.38 0.54 17
4-5 0.69 0.05 0.32 4.6 0.35 0.23 0.41 0.51 0.05 0.19 0.44 13
6-7 0.58 0.05 0.30 3.7 0.36 0.37 0.65 0.38 0.05 0.17 0.49 19
8-9 0.85 0.05 0.31 10 0.38 0.31 0.60 0.29 0.03 0.12 0.46 16
10-11 0.98 0.04 0.27 13 0.37 0.53 0.67 0.33 0.05 0.25 0.53 21
1213 0.73 0.05 0.17 7.5 0.39 0.78 1.2 0.44 0.04 0.36 0.57 21
14-15 0.49 0.04 0.14 4.9 0.31 0.58 0.91 0.22 0.03 0.21 0.54 17
16-17 0.45 0.03 0.11 4.1 0.31 0.36 0.67 0.09 0.02 0.13 0.50 14
18-19 0.34 0.03 0.13 3.0 0.31 0.26 0.54 0.25 0.01 0.10 0.49 14
20-21 0.74 0.03 0.16 4.9 0.30 0.25 0.50 0.30 0.01 0.09 0.52 14
22-23 0.42 0.02 0.12 2.7 0.33 0.27 0.55 0.30 0.00 0.08 0.55 14
24-25 0.31 0.01 0.07 1.7 0.34 0.31 0.69 0.25 0.00 0.07 0.49 12
26-27 0.22 0.01 0.04 0.95 0.33 0.36 0.83 0.11 0.00 0.10 0.50 13
28-29 0.21 0.04 0.02 0.65 0.30 0.31 0.81 0.16 0.00 0.07 0.52 14
30-31 0.18 0.02 0.02 0.38 0.26 0.20 0.59 0.13 0.00 0.05 0.46 12
32-33 0.23 0.02 0.02 0.35 0.20 0.11 0.40 0.07 0.00 0.04 0.48 12
34-35 0.24 0.02 0.02 0.31 0.24 0.09 0.37 0.14 0.01 0.05 0.53 14
36-37 0.21 0.02 0.02 0.25 0.21 0.06 0.24 0.06 0.01 0.04 0.45 11
38-39 0.23 0.10 0.02 0.35 0.22 0.05 0.25 0.05 0.02 0.04 0.46 11
40-41 0.24 0.07 0.02 0.31 0.24 0.05 0.26 0.07 0.02 0.04 0.45 11
42-43 0.21 0.10 0.02 0.25 0.22 0.05 0.20 0.10 0.01 0.03 0.42 10
Depth
(cm) As Sn Sb La Ce Pr Nd Sm Pb Bi Th U
0-2.25 0.68 0.82 2.6 0.56 0.45 0.55 0.52 0.53 1.9 20 0.42 0.61
4-5 0.88 0.87 1.9 0.40 0.36 0.40 0.38 0.38 2.0 23 0.36 0.66
6-7 1.3 1.4 3.6 0.68 0.53 0.66 0.61 0.61 3.8 41 0.49 0.93
8-9 1.2 1.5 3.8 0.49 0.40 0.48 0.46 0.48 4.2 44 0.43 0.88
10-11 1.9 1.5 4.6 0.70 0.59 0.75 0.69 0.70 4.0 50 0.59 1.2
1213 2.5 1.6 4.1 1.6 1.4 1.7 1.6 1.5 3.4 45 0.72 1.6
14-15 1.9 1.2 2.3 1.1 0.96 1.2 1.1 1.1 2.5 28 0.76 1.5
16-17 1.1 0.72 1.3 0.68 0.50 0.59 0.53 0.51 1.7 19 0.64 1.1
18-19 0.79 0.63 0.91 0.34 0.31 0.32 0.29 0.29 1.4 16 0.44 1.0
20-21 0.73 0.67 0.96 0.36 0.32 0.33 0.30 0.30 1.3 15 0.49 0.95
22-23 0.76 0.64 0.90 0.12 0.12 0.13 0.12 0.12 1.3 14 0.39 0.97
24-25 0.85 0.57 0.94 0.07 0.07 0.07 0.07 0.08 1.4 13 0.31 0.91
26-27 1.1 0.63 1.2 0.18 0.17 0.19 0.18 0.18 1.6 19 0.74 1.1
28-29 0.91 0.57 1.2 0.24 0.24 0.24 0.23 0.25 1.2 12 0.31 0.85
30-31 0.65 0.57 0.95 0.09 0.10 0.10 0.10 0.11 0.79 15 0.18 0.61
32-33 0.41 0.49 0.71 0.10 0.11 0.12 0.12 0.12 0.44 9.1 0.22 0.50
34-35 0.33 0.48 0.73 0.15 0.15 0.16 0.15 0.14 0.45 9.4 0.31 0.48
36-37 0.24 0.42 0.58 0.18 0.18 0.20 0.19 0.20 0.29 6.5 0.26 0.40
38-39 0.25 0.51 0.62 1.3 1.2 1.4 1.4 1.3 0.33 7.2 0.30 0.48
40-41 0.23 0.56 0.62 0.61 0.60 0.70 0.67 0.68 0.36 7.8 0.30 0.50
Table 7 Accumulation rates of 25 elements in CNF pocosin (µg cm-2y-1). Depth
(cm) Al Ti Mn Fe Mg V Ni Cu Zn Rb Sr Zr Cd
0.5-2.25 181 27 0.42 46 30 0.23 0.069 0.14 0.28 0.13 0.82 0.31 0.010
4-5 591 100 1.0 213 88 0.84 0.28 0.29 0.86 0.23 1.6 0.95 0.029
6-7 324 44 0.41 143 78 0.38 0.20 0.20 0.28 0.12 0.58 0.46 0.018
8-9 171 28 0.42 83 40 0.38 0.10 0.17 0.20 0.036 0.38 0.27 0.015
10-11 130 14 0.13 45 57 0.14 0.093 0.074 0.087 0.038 0.31 0.16 0.007 12-13 70 6.3 0.035 29 45 0.065 0.060 0.057 0.051 0.013 0.20 0.077 0.003 14-15 125 12 0.060 34 62 0.099 0.085 0.084 0.049 0.021 0.22 0.14 0.005
16-17 332 43 0.32 73 126 0.36 0.19 0.22 0.072 0.039 0.50 0.46 0.015
Depth
(m) As Sn Sb La Ce Nd Sm Pr Pb Bi Th U
0.5-2.25 2.3 0.023 0.012 0.007 0.12 0.19 0.027 0.095 0.017 0.22 0.022 0.031 4-5 5.0 0.11 0.046 0.019 0.33 0.61 0.077 0.28 0.049 0.85 0.090 0.099 6-7 7.0 0.073 0.032 0.016 0.23 0.36 0.050 0.18 0.031 0.70 0.071 0.059 8-9 9.0 0.041 0.032 0.015 0.17 0.29 0.039 0.14 0.026 0.72 0.072 0.033 10-11 11 0.035 0.013 0.007 0.11 0.18 0.026 0.090 0.016 0.26 0.031 0.023 12-13 13 0.020 0.006 0.003 0.048 0.084 0.012 0.041 0.007 0.099 0.012 0.012 14-15 15 0.029 0.009 0.003 0.077 0.13 0.019 0.064 0.011 0.14 0.015 0.025 16-17 17 0.060 0.018 0.006 0.26 0.39 0.052 0.18 0.030 0.34 0.036 0.075
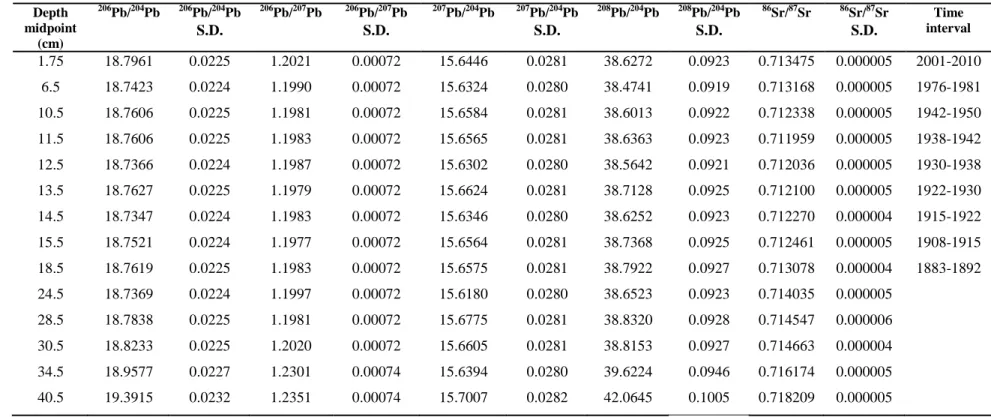
Table 8 Pb and Sr isotopic compositions in CNF pocosin, NC. (S.D. Standard deviation) Depth
midpoint (cm)
206
Pb/204Pb 206Pb/204Pb 206Pb/207Pb 206Pb/207Pb 207Pb/204Pb 207Pb/204Pb 208Pb/204Pb 208Pb/204Pb 86Sr/87Sr 86Sr/87Sr Time interval
S.D. S.D. S.D. S.D. S.D.
1.75 18.7961 0.0225 1.2021 0.00072 15.6446 0.0281 38.6272 0.0923 0.713475 0.000005 2001-2010
6.5 18.7423 0.0224 1.1990 0.00072 15.6324 0.0280 38.4741 0.0919 0.713168 0.000005 1976-1981
10.5 18.7606 0.0225 1.1981 0.00072 15.6584 0.0281 38.6013 0.0922 0.712338 0.000005 1942-1950
11.5 18.7606 0.0225 1.1983 0.00072 15.6565 0.0281 38.6363 0.0923 0.711959 0.000005 1938-1942
12.5 18.7366 0.0224 1.1987 0.00072 15.6302 0.0280 38.5642 0.0921 0.712036 0.000005 1930-1938
13.5 18.7627 0.0225 1.1979 0.00072 15.6624 0.0281 38.7128 0.0925 0.712100 0.000005 1922-1930
14.5 18.7347 0.0224 1.1983 0.00072 15.6346 0.0280 38.6252 0.0923 0.712270 0.000004 1915-1922
15.5 18.7521 0.0224 1.1977 0.00072 15.6564 0.0281 38.7368 0.0925 0.712461 0.000005 1908-1915
18.5 18.7619 0.0225 1.1983 0.00072 15.6575 0.0281 38.7922 0.0927 0.713078 0.000004 1883-1892
24.5 18.7369 0.0224 1.1997 0.00072 15.6180 0.0280 38.6523 0.0923 0.714035 0.000005
28.5 18.7838 0.0225 1.1981 0.00072 15.6775 0.0281 38.8320 0.0928 0.714547 0.000006
30.5 18.8233 0.0225 1.2020 0.00072 15.6605 0.0281 38.8153 0.0927 0.714663 0.000004
34.5 18.9577 0.0227 1.2301 0.00074 15.6394 0.0280 39.6224 0.0946 0.716174 0.000005
40.5 19.3915 0.0232 1.2351 0.00074 15.7007 0.0282 42.0645 0.1005 0.718209 0.000005
Figure 1 The mineral sources distribution of North Carolina Coastal Plain (Modification from USGS, 2012).
40
Figure 2 The total population growth in the adjacent counties around the the study site [Croatan National Forest (CNF)]: Carteret, Craven, Jones, Onslow, Pamilco.
Figure 3 The total population change/growth rate in the adjacent counties around CNF: Carteret, Craven, Jones, Onslow, Pamilco.
0 50,000 100,000 150,000 200,000 250,000 300,000 350,000 400,000
1890 1900 1910 1920 1930 1940 1950 1960 1970 1980 1990 2000 2010 Population growth in the adjacent counties
0% 5% 10% 15% 20% 25% 30% 35% 40% 45% 50% 55% 60%
1900 1910 1920 1930 1940 1950 1960 1970 1980 1990 2000 2010
41
42
Figure 5 Bulk density, water content and Loss on Ignition (LOI) profiles of CNF pocosin.
Figure 6 Excess 210Pb and 137Cs activities in Core 1, CNF pocosin, NC.
0 5 10 15 20 25 30 35 40 45
0.0 0.2 0.4
Bulk Density g cm-3
D ept h (cm ) 0 5 10 15 20 25 30 35 40 45
20 40 60 80
Water Content %
0 5 10 15 20 25 30 35 40 45
40 60 80 100
LOI %
0 5 10 15 20 25 30 35 40 45
0 200 400
Excess 210Pb Bq kg-1
De p th (c m ) 0 5 10 15 20 25 30 35 40 45
0 20 40 60 80
43
Figure 7 The chronology from CRS 210Pb dating model.
Figure 8 Major elements concentrations in peat, CNF pocosin, NC. 0 2 4 6 8 10 12 14 16 18 20
0 20 40 60 80 100 120 140 160
De pth (c m) Age (year) 0 2 4 6 8 10 12 14 16 18 20
1860 1900 1940 1980 2020
De pth (c m) Year 0 5 10 15 20 25 30 35 40 45
0.0 0.1 0.2 0.3
Dept
h
(cm
)
Mg %
0.00 0.40 0.80 1.20
Al %
0.0 0.1 0.2 0.3 0.4 0.5 Ti %
0.0 0.1 0.2 0.3 0.4 0.5
Figure 9 Major elements accumulation rates in CNF pocosin, NC. A.R. = accumulation rate
Figure 10 Selected trace elements concentrations in peat that show a significant peak at 8-9 cm, CNF pocosin, NC. 0
5
10
15
20
0 200 400 600 800
De
pth
(c
m)
Al A.R. µg cm-2y-1
0
5
10
15
20
0 100 200
Ti A.R. µg cm-2y-1
0
5
10
15
20
0 100 200 300
Fe A.R. µg cm-2y-1
0
5
10
15
20
0 100 200
Mg A.R. µg cm-2y-1
0 5 10 15 20 25 30 35 40 45
0 10 20 30
Pb µg g-1
De
pth
(c
m)
0 0.2 0.4 0.6
Sb µg g-1
0 1 2 3
Bi µg g-1
0 2 4 6
Ni µg g-1
0 1 2 3
As µg g-1
Figure 11 Pb isotopic compositions graph versus depth and age index.
Figure 12 Sr concentration in ash, Sr enrichment factor and 87Sr/86Sr isotopic ratio profiles, CNF pocosin, NC. 0 5 10 15 20 25 30 35 40 45
0 100 200
De
pth
(c
m)
Pb (ash) ppm
0 5 10 15 20 25 30 35 40 45
18.50 19.00 19.50
206Pb/204Pb
0 5 10 15 20 25 30 35 40 45
1.18 1.20 1.22 1.24
206Pb/207Pb
0 5 10 15 20 25 30 35 40 45
35 40 45
208Pb/204Pb
0 5 10 15 20 25 30 35 40 45
0 200 400
Sr in ash µg g-1
De pth (c m) 0 5 10 15 20 25 30 35 40 45
0 0.2 0.4
Sr E.F. 0 5 10 15 20 25 30 35 40 45
0.71 0.715 0.72
87Sr/86Sr
Figure 13 Pb, Cu, Zn and Cd concentrations in peat from the CNF, NC (right) graph in comparison with data from Florida (left) (Kamenov et al., 2009).
0 4 8 12 16 20 24 28 32 36 40 44 48 52 56 60 64 68 72 76 80
0 10 20 30
Pb (ppm) NC
1970 0 4 8 12 16 20 24 28 32 36 40 44 48 52 56 60 64 68 72 76 80
0 3 6 9 12
Cu (ppm) NC
1970 0 4 8 12 16 20 24 28 32 36 40 44 48 52 56 60 64 68 72 76 80
0 10 20
Zn (ppm) NC
1970 0 4 8 12 16 20 24 28 32 36 40 44 48 52 56 60 64 68 72 76 80
0 0.05 0.1
D ept h ( cm ) Cd (ppm) 0 4 8 12 16 20 24 28 32 36 40 44 48 52 56 60 64 68 72 76 80
0 0.5 1 1.5
Cd (ppm) NC
47
0
10
20
30
40
50
60
0 25 50 75 100
D
epth
(c
m)
Zn (µg g-1) NC
0
10
20
30
40
50
60
0 100 200
De
pth
(c
m)
Pb (µg g-1) NC
0
10
20
30
40
50
60
0 50 100
De
pth
(c
m)
48
Figure 14 Zn, Pb, Cu and Cd concentrations in ash from the CNF, NC (left) graph in comparison with data from New York City (Alley Pond, Goose Creek) (Cochran et al., 1998).
0
10
20
30
40
50
60
0 2 4 6
De
pth
(c
m)
Figure 15 Pb concentration in peat, in ash, Pb E.F. (Enrichment Factor) and Pb accumulation rate in CNF pocosin, NC.
Figure 16 The 206Pb/207Pb comparisons profile between CNF NC pocosin, Georgia swamp (Jackson et al.,2004) and Chesapeake Bay sediment (Marcantonio et al., 2002).
0 5 10 15 20 25 30 35 40 45
0 10 20 30
Pb in peat (ppm)
D ept h ( cm ) 0 5 10 15 20 25 30 35 40 45
0 100 200
Pb in ash (ppm)
0 5 10 15 20 25 30 35 40 45
0 5 10
Pb E.F. 1908 1933 1970 1985 0 5 10 15 20 25 30 35 40 45
0 0.5 1
Pb A.R. µg/cm-2y-1
1850 1870 1890 1910 1930 1950 1970 1990 2010
1.18 1.2 1.22
206Pb/207Pb
NC, pocosin
Chesapeak Bay, sediment
Georgia, swamp


![Figure 2 The total population growth in the adjacent counties around the the study site [Croatan National Forest (CNF)]: Carteret, Craven, Jones, Onslow, Pamilco](https://thumb-us.123doks.com/thumbv2/123dok_us/8253054.2186716/46.918.143.762.118.434/population-adjacent-counties-croatan-national-forest-carteret-pamilco.webp)
