I I I
THE ENVIRONMENT
I I I . 1 G E N E R A L O B S E R V A T I O N S O N T H E R E C O N S T R U C T I O N
T h e first question vvith vvhich we are faced in the reconstruction of an environment, is vvhat exactly it is that we are to reconstruct. The environment of a human population is a notion which is difficult to define. It is a complex of living and inanimate elements, from which we shall have lo make a choice. We have the advantage that we study populations of a species to which we belong ourselves, namely mankind. This permits assumptions as to those factors which are of primary importance to the existence of man. We think of the following elements: climate, relief, hydrology (with particular reference to drinking water), vegetation (especially the higher plants) and fauna (animals which are visible with the naked eye). The presence of other, similar, but also of different populations (groups of people with the same, respectively a different, way of life) is deemed important as well. T o this, aspects must be added from geology (e.g. the presence of mineral resources) and sometimes pedology. Relief, hydrology, geology and pedology can be combined under the heading: the substrate. The above factors togcther constitute the "environment" of mankind which we shall consider. It is these aspects which we shall try to reconstruct.
A second question is how large the area should bc, of vvhich we have to reconstruct the environment. 1 n our opinion, the size of the area to be described will depend strongly on the size of the population, or the taxonomie entity, which we wish to examine. The reconstruction of the environment of a cultural group or of a technocomplex in the sense of Clarke (Clarke 1968) requires the description of a quite different area than the reconstruction of the environment of a site assemblage. As our study is in the first instance concerned with the latter, we shall restrict ourselves to a consideration of an area around a settlement.
A settlement is, rcgardless of its size or its span of life, the centre of the daily existence of the population in question. Starting from the settlement, different activities are undcrtaken, but in principle the inhabitants return to the settlement each day, to sleep there. The area which can be visited daily is therefore limited. We refer to this area by the term "home range", a term originating from animal ecology. Besides "home range" the term "territory" also exists. In general, "home range" is used when the area of activity has rather vague boundaries or is overlapped by the area of another individual or group; territories are clearly defined. Both terms can be used to describe human behaviour. For the area around a settlement, which is visited more or less daily, we prefer to use "home range". It is the environment within the home range, which is of primary importance to the inhabitants of the settlement and which must be reconstructed anyhow. T h e environment outside the home range is of less evident importance.
6 THE ENVIRONMENT
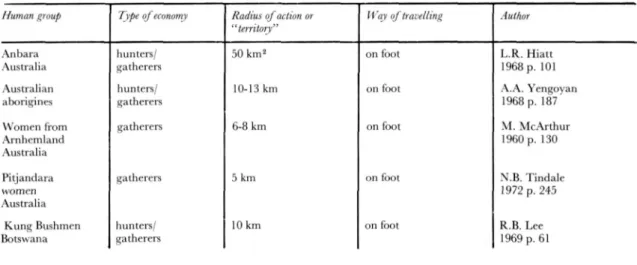
as a determinant fbr the size of a home range. It appears that such a limit indeed exists for travelling times, at least as far as economie activities are concerned. Concerning the radius of action of cultivators Chisholm says (Chisholm 1968 p. 131): "A point which emerges from the preceding discussion . . . is the frequency with which the same orders of magnitude keep on recurring among peoples of widely different technical achievements and inhabiting areas with markedly different physical characteristics." For the area in which the economie activities of a settlement are carried out, Vita Finzi and Higgs have introduced the term "site territory": "Site territory - the territory surrounding a site which is exploitcd habitually by the inhabitants of the site" (Vita Finzi & Higgs 1970 p. 7). O n the basis of Chisholm's work, they define the site territory of farmers as: "the area which lies within one hour's walking distance from the site". T h e site territories could be different per main type of economy. Higgs defines the site territorv of hunters and gatherers as: "the area which lies within two hours' walking distance from the site" (Higgs 1975 p. I X ) . This definition is based on the work of Lee (Lee 1969). However, Chisholm has used little material about swidden systems* in his study, whereas Lee's work deals exclusively with !Kung Bushmen, so that we are not willing to adopt the definition given by Higgs and Vita Finzi without any research of our own. For this reason, we have tried to collect more data on hunters/gatherers and swidden cultivators. T h e material which we have collected is brought together in table 1. Almost all entries relate to obtaining food and thus to the site territory. We gain the impression that for the site territory of the hunters/gatherers mentioned, a circle with a radius of two hours' walking distance is a quite acceptable estimate. As far as swidden cultivators are concerned, the figures mostly relate to the distance to the fields or the area where fields can be made. The distance from the fields to the settlement indeed lies within a circle of one hour's walking distance in most cases. But all populations mentioned in table 1 also obtain matcrials and food from the wild. If these economie activities are to be included in the consideration, the radius will exceed the above-mentioned one hour's walking distance. E.g. the distance which the Hanunóo are willing to cover to their fields is one hour's walking distance, but two hours' walking distance for getting rattan (Conklin 1957V Two hours' walking distance, as for hunters/gatherers, seems to us a safer estimate for the size of the site territory.
For most of the groups examined, the home range seems to coincide with the site territory. T h e home range, however, can be larger, e.g. when the boundaries set to the subsistence activities are crossed for social activities in the widest sense of the word. Something like this can be observed with the Bemba (Richards 1939). We cannot yet estimate the size of the home range in such cases, as we have too little Information at our disposal. Anyhow, the Bemba easily walk a distance of 25 km for making visits. For lack of better Information, we shall use, for the time being, the theoretical home range with a radius of six hours' walking distance.
GENERAL OBSERVATIONS ON THE RECONSTRUCTION 7
specilic composition of Hora and fauna will be of lesser importance. If, however, raw materials, which are not present within the site territory, occur within the home range, this must be noted.
O n the basis of the above-mentioned considerations, we arrive at a thrcc fold division of the environment around a settlement:
1) an area with a radius of two hours' walking distance, the environment of which must be reconstructed in detail.
2) a zone with a radius of six hours' walking distance, of which the topography, the location of other settlements and the presence of essential raw materials must be reconstructed.
3) the area beyond, the environment of which need not be reconstructed in the first instance.
It depends on the available means of transport and on the speed which can be maintained, what two hours' walking distance and six hours' walking distance will mean in real distances.
Unfortunately, nothing concrete is known about the means of transport which the Linearbandkeramik culture had at its disposal. Of course we may assume that people could travel on foot. T h e distance which can be coveredon foot varies with the relief and the burden tobecarried. VVecount witha walking speed of 5 km/h with a light burden on more or less even ground, and vvith 3 km/h with a heavy burden in mountainous terrain. As the areas examined by us are not particularly mountainous, in the present study we reckon with 5 km/h; that means that two hours' walking distance equals 10 km and six hours' walking distance equals 30 km. These are probably maximum values.
It is improbable that the LBK knew of carts, but the use of a means of transport such as the travois or the sledge may not be excluded. Probably, the possible use of these means of transport hardly influenced the radius of action. A travois is accompanied on foot. T h e sledge may carry persons. This transport can be fast when one possesses fast draught-animals and a good gliding ground in open terrain. T h e LBK and the landscape at that time did not meet these conditions. The domesticated horse was not known and few dogs were found. In wintertime, snow might have provided a gliding ground but open terrains, which are necessary for maintaining speed, were not yet present (see p. 38). Travois and/or sledge may have played a part in the transport of goods, but probably this was not faster than a journey on foot.
It is not impossible that the LBK possessed boats and could thus travel by water. It is true that boats or oars have never been found in a LBK context, but that tells nothing, because in most settlements the find circumstances are not suitable for preserving organic material. Vessels are known, however, from the Mesolithic and the Middle-Neolithic. T h e type of boat, of which we think, are dug-out canoes and
8
THE ENVIRONMENTlessthan 10 km (Kloos 1975 verbal information). The Iban travel bycanoetoficlds which are at adistance ofsomewhat more than 1.5 km from their house (Freeman 1970 p. 161). VVhen thefieldsare further away, the agricultural activities are undertaken from a secondary house. These secondary houses are located up to a distance of 11 km from the primary settlement (Freeman 1970 p. 164); Freeman mentions elsewhere that the secondary houses may even be located at two to three hours' travelling from the primary settlement (Freeman 1970 p. 161). T h e data on the Maroni River Carib women and the Iban relate to travelling on rivers. It is evident that down-stream the speed is higher than up-stream. As in our considerations both way trips have to be made, the advantages of a fast trip down-stream are cancelled out by the trip up-stream.
From the few figures at our disposal, we get the impression that travelling, even with rather specialized boats as the Hawaiian doublé canoe, is not much fastcr than walking. At present, a radius of action of 10 to 30 km seems to be acceptable for possible LBK boats.
T h e above considerations have answcrcd the question how large the area will be which we intend to reconstruct around the LBK settlements Elsloo, Stcin, Sittard and Hienheim.
Within a radius of 10 km we shall reconstruct as completely as possible the environment which we presume to have been important to the settlement. This reconstruction comprises aspects concerning climatc, substrate, flora, fauna and h u m a n settlements. VVithin a radius of 30 km wc shall consider only the topography and the presence of human settlements. A priori, we shall reconstruct nothing beyond the 30 km houndary. Important factors beyond the 30 km boundary will come to light when we will have a closer look at the relationship man-environment.
Table 1. T h e sizc of tht cultivators.*
area, which is visited daily from a settlement: some data from the Hteraturc on hunters/gatherers and swidden
Human gmitp Type qfeconomy Radius of action oi '' tcrritory"
li'ay (ff travelling Aiilhin
.\ n b a r a
Australia
hunters/ gatherers
50 l<m2 on foot 1..R. H i a u
1968 p . 101
Australian aborigines
hunters/ gatherers
10-13 km on foot \ . \ . Yengovan
1968 p. 187'
W o m e n from .\ r n h e m l a n d
Austraha
gatherers 6-8 km on foot M . M c A r t h u r
1960 p. 130
Pitjandara womon Austraha
gatherers 5 km on foot X.B. T i n d a l e
1972 p. 245
K u n g Bushmeii Botswana
liunters/ gatherers
10 km on foot R.B. Lee
1969 p. 61
GENERAL OBSERVATIONS ON THE RECONSTRUCTION
Hunum groiip 7 yf}f oj economy Radius oJ action or "territory"
IVay oJ travelling Author
G/wi Bushmen on fbot G.B. Silberbauer
men hunlers 24 km 1972 p. 290
women gatherers 8 km p . 287
Botswana
H a d z a women gatherers hour's walk on foot J . W o o d b u r n
T a n z a n i a ' l 9 6 8 p . 51
Birhors hunters/ 4-8 km on foot D.P. Sinha
India gatherers 1972 p. 377
Copper Esicimo hunters 8 km on foot D. Damas
C a n a d a 1972 p. 23
Bemba swidden for cultivation on foot .^.I. Richards
Z a m b i a cultivators a few km for fishing up to 16 km for visiting u p to 25 km
1939 p. 18 and T a b l e E
Yako swidden 120 km2 on foot C D . Forde
Nigeria cultivators 1968 p. 161
K a p a u k u swidden 45 min = on foot L. Pospisil
New Guinea cultivators 1.8 km 1963 p. 87
Tsembaga swidden orthographically on foot R.A. R a p p a p o r t New Guinea cultivators 8.2 km"
to gardens: 20 min walk down hill and 30 min walk u p slope
1968 p. 33 and T a b l e 5
Iban swidden u p to 1.5 km on foot D. Freeman
Borneo cultivators slightly
further than 1.5 km
by boat 1970 p. 161
H a n u n ó o swidden 6 k m 2 on foot H. Conklin
Philippines cultivators one hour's walk to garden = 1 km with heavy load
2 hours' walk for a coil of rattan
1957 p. 12 Plate 29
L a m e t swidden 2.48 km on foot K.G. Izikowitz
Indochina cultivators walking speed 3 km/h
1951 p. 40
Maroni River swidden 45 min on foot P. Kloos
Carib women cultivators 2 hours or by boat 1971 p. 26
Surinam more
K i i i k i i r u swidden 6-8 km on foot R.L. Carneiro
Brazii cultivators 1956 p. 232
Average Amazonian swidden_ 5 km on (bot R.L. Carneiro
cultivators cultivators 1956 p. 232
10 THE ENVIRONMENT
I I I . 2 T H E C L I M A T E
T h e present climate of the area in Southern Limburg, which we investigated, is recorded by the climatological stations at Beek and at Buchten. These stations used to be located at Maastricht (until 1953) and at Sittard (until 1949) respectively. T h e use of the records of the present locations presents some disadvantages. T h e station at the airport of Beek is located on a very exposed plateau, so that it is not really comparable with the conditions at Sittard, Stein and Elsloo. It is true that its predecessor Maastricht lies beyond the 10 km radius, but its location corresponds better to that of the LBK settlements.* Moreover, the former stations have longer series of observation than the new ones. Therefore, we shall refer to the stations Sittard and Maastricht.
For Hienheim, the nearest climatological station is at a distance of 30 km at Ingolstadt. There is another station at Regensburg. T h e station Ingolstadt probably provides the most useful data, as Regensburg is located within the rainshadow of the Frankische Alb.
T h e most relevant climatological data relating to temperature and precipitation are brought together in the climatic diagrams of figure 1. These diagrams are taken from the work of VValter and Lieth (Waker & Lieth 1960 and 1964). It can be concluded from the diagrams that the precipitation in the Southern Limburg area is spread more equally over the year than the precipitation in the valley of the Donau near Hienheim. Besides, winters are much more moderate in Southern Limburg. The area around Hienheim clearly has a more continental climate than the area around Sittard, Elsloo and Stein. Wind-direction and wind-force are not incorporated in the diagrams. In Southern Limburg, the wind is usually south-west to south-south-west in the months from July to February. In the months between March and J u n e the wind may blow from any direction, except from the south-east. The winds are of moderate force. In the valley of the Donau near Hienheim, the winds are usually from the south-west. Their force varies from weak to moderate. Storms occur rarely.
The climate was different at the time of the LBK. T h e second half of the fifth millennium B.C. falls within the postglacial climatological optimum or hypsothcrmal ( ~6000 - ~1000 B.C.) and more precisely within the so-called Atlantic ( ~6000 - ~3000 B.C.).
Data about earlier climatic periods are taken from four sources of Information. The first sourcc is the investigation of subfossil flora and fauna. There are some species of plants and animals of which it is known that their area of distribution is limited by certain climatological factors. For example ivy (Hedera helix L.) appears unable to survive when the average temperature of the coldest month is below 1.5° C (Iversen 1944). T h e eggs of the pond turtle (EmysorbicularisL.), which a r c i n c u b a t c d b y the w a r m t h o f t h e s u n , do not hatch in areas north of the 20° C July-isotherm in France and the 18° C July-isotherm in Eastern Europe (Degerbol & Krog 1951). When subfossils of such organisms are found in dcposits in areas where they no longer occur at present, conclusions may be drawn regarding the earlier climate of the find site. Another biological method is the study of tree-rings, as the thickness thereof is among other things determined by the climate. A climate, which is favourable to a certain tree, usually leads to the growth of thick rings. Glaciology is a second source of Information. The advance or retreat of glaciers indicates changes in climatological factors as temperature and precipitation. Geomorphology provides further data, e.g. the grasize distribution of cave deposits is dependent on the climate. A fourth type of
THE CLIMATE
11
SITTARD I 4 4 m ) [30 33)
l*}^/>/^//////\ ' ' \/?//////\
MAASTRICHT (67m) ( 3 0 - 7 8 1
°^^/>/////A ' '
V/>/J//\
INGOLSTADT (370m) 150-40
REGENSBURG (343m) [50-401
a station b altitude
c n u m b e r of years of observation (the first stands for temperature, the second for precipilation)
d mean annual temperature in degrees centigrade e mean annual sum-total of precipitation in m m f mean daily minimum of the coldest month g absolute minimum
h m e a n m i n i m u m of month falls below zero i absolute m i n i m u m below zero
k monthly means of temperature I monthly means of precipitation
Fig. 1. Climatic diagrams of the weather stations at Sittard, Maastricht, Ingolstadt and Regensburg. T h e diagrams are based on data
12 T H E E N V I R O N M E N T
formation is obtained by the examination of the ratio of the oxygen-isotopes 018 and 016, e.g. in C a C O o , or in ice. The 018-016 ratio in remains of, for instance, foraminifera depends on the temperature of the water in vvhirli these planktonic species lived. An example of this method for climate reconstructions is the investigation of undisturbed sections of globigerina ooze in ocean bottoms. The oxygen-isotopes ratio in the ice of ice-caps depends on the temperature of the air during the formation of the ice. T h e ice-cap of Greenland has been studied in this fashion.
So far the two areas, of which we want to reconstruct the climate, have provided no useful data which, as indicated above, could inform us about the climate in the Atlantic. Therefore we have to use what is known about the Atlantic in a larger area, namcly Central and Western Europe. T h e most concrete data are provided by the investigation of flora and fauna. Glaciology and geomorphology also provide information. T h e 018-016 method has not yet been helpful.
Iversen calculated the summer and winter temperature of Djursland (Denmark). By means of the presence of pollen of mistletoe (Viscum album L.),ivy (Hedera helix L.) and holly (Ilexaquifolium L.) in peat deposits from the Atlantic, he arrived at the conclusion that the average temperature of the warm est month must have been about 2° C higher than the present temperature, whereas the average temperature of the coldest month must have been about 0.5° C higher than at present (Iversen 1944). T h e findings of Degerbol and Krog with respect to the pond turtle (Emys orbicularis L.) confirm the occurrence of a summer temperature 2° C highcr in Denmark during the Atlantic (Degerbol & Krog 1951). For Great Britain, Conolly and Dahl were able to conclude from the fossil distribution ofa large number of arctic and montane plants, that summers during the Atlantic were warmer by 2 to 3° C than summers in our time
(Conolly & Dahl 1970).
Figures applying to Central Europe are mentioned by Mania and by F u h r m a n n (Mania 1973a, Fuhrmann 1973). Their observations concern mollusc faunas. T h e following table, taken from Mania, relates to the Saaie- and Middlc Elbe-area:
Tahle 2. The .\tlantic climate according to M a n i a 1973a.
present climate estimated situatioii during the Atlantic
average annual temp, + 8° to + 9° C circa + 9° to + 11° C average temp. July + 16° to + 18° C circa + 18° to + 20° C average temp. J a n u a r y — 3° t o — 1° C c i r c a — 1° C average annual precipitation 450 - 650 mm circa 550 — 700 mm
In Central and West Sachscn Fuhrmann distinguishcs, as is usual in the Central Europcan pollen analysis, two periods within the Atlantic: an "Alt-Atlantikum" from 5600-4000 B.C. and a "Jung-Atlantikum" from 4000-2500 B.C. During the Alt-Atlantikum, the average annual temperature was circa 1° C higher than nowadays, whereas the optimum with 1 to 2° C higher temperatures was reached during the J u n g -Atlantikum. The climate ressembled the present climate in the south-eastern part of Central Europe. According to Fuhrmann, a strong submediterranean influence is characteristic for this period. Unfortunately his Saxon mollusc faunas provide no information about the precipitation.
THECLIMATE 13
As a result of the above it may be assumed for floristic and faunistic reasons, that summers in Western and Central Europe were 1 to 3° C warmer than in our days. Winters were warmer too, and as a whole the climate probably was wetter as well.
Additional data are provided by glaciology. The alpine glaciers were of rather small size during the hypsithcrmal. It cannot always be determined whcthera small size is related t o a h i g h e r temperatureor to less precipitation. Besides, the topography of the glacier valley influences the speed of growth of the ice-tongue. According to Mercer, however, small glaciers in temperate areas react mainly on differences in temperature and they can be used for information about this factor (Mercer 1967). It may be concluded from the small size of the alpine glaciers that it was rather warm during the Atlantic. However, the value of the dificrence in temperature between then and now is difiicult to estimate.
Geomorphology providcs strong indications that it was not only warmer but also wetter. On the basis of a great number of observations, mainly in Poland and Czechoslovakia, Starkei concludes: "Geomorphological data have established that the Atlantic period was of humid character with rainfall all the year round, with warm winters (no traces of frost processes in Central E^urope) and with the mean aniuial temperature about 2" higher than that of the present day. Fluvial deposits bear witness to the occurrence of periods of heavy rain of long duration" (Starkei 1966 p. 26).
In much of the literature quoted so far, the Atlantic is described as a single climatological period. However, Firbas already divided the Atlantic into two parts (Firbas 1949) and in the above-mentioned article of Fuhrmann different temperatures are calculated for these two parts (Fuhrmann 1973). Frenzel shows that probably much more variations can be distinguished in the climate of the Atlantic Period
(Frenzel 1966 fig. 4). T o these oscillations belong the cool Misox-oscillations of Zoller, which lasted from 5500-4500 B.C. (Zoller 1960). However, these oscillations have not yet been observed generally. According to the data gathered by Frenzel, the period 4500-4000 B.C. in which we are interested, belongs to a relatively warm phase within the Atlantic. Thereforc all above cstimates concerning temperatures and precipitation are probably applicable to the period which we examined and can be used for the reconstruction of the climate.
For the reconstruction of the climate, we base ourselves on the work of L a m b (e.g. Lamb et al. 1966, Lamb 1971 and 1974). This author starts from surface temperatures which have been reconstructed foracertain period in a certain area, bccause these data are the most reliable and often the only available concrete data. Lamb plots the surface temperatures of the coldest or the warmest month on a world-map of the period in question. O n the basis of the surface temperatures, he subsequently charts the temperature of the upper air, starting from the principle that the present relation between surface temperature and temperature of the upper air also applied in the past. From the second temperature chart, the vertical thickness of the lower half of the atmosphere is calculated and charted by means of the density of the air. This 1000-500 millibar thickness chart leads to the reconstruction of the corresponding upper winds and the pattern and the intensity of the circumpolar vortex of the upper westerlies, which determine the weather in our areas. Subsequently, Lamb uses the process, with which the synoptic charts of the upper air are converted into weather charts near the surface, in order to reconstruct the weather system at sea level. T h e result ofthis method for the period around 4000 B.C. is shown on maps in an article from 1966 (Lamb et al. 1966).
14 THE ENVIRONMENT
least in summertime, a course which lies more to the north than the present course. T h e climate in Western and Central Europe was therefore more influenced by the subtropic anti-cyclones. T h e result was that summers were warmer with more sunshine. Because of the marked zonal circulation, polar airstreams did not penetrate into Western and Central Europe. This circumstance and the fact that this weather type was combincd with mainly moderate south-western winds and with high sea-temperatures, caused relatively warm winters. Another consequence is a higher relative humidity of the air and more precipitation. Especially in wintertime, the influence of the humid winds was also exerted in Central and Eastern Europe. T h e climate can be described as oceanic and summer-anticyclonic.
T h e model developed above for the climate during the Atlantic is bascd on scanty data. It provides, however, an adequate explanation for what has become known about the Atlantic. For this reason, we can usc it for the reconstruction of the climate in Southern Limburg and around Hienheim.
O n the basis of temperature values obtained elsewhere in Europe, we assume for both areas that summers were probably 2° C warmer. This means that the July-temperature at Sittard, Stein and Elsloo averaged 20° C. At Hienheim it was also 20° C. T h e "correction" for the winter-temperature is more difhcult to make. Perhaps 1° C must be added to the temperature of the coldestmonth, so that the average temperature was 3° C for Southern Limburg and —1° C for Hienheim. The season to be considered as winter probably lasted less long and at Mienheim the period of frost was perhaps considerably shorter. Of course, the average annual temperature was higher than at present. For Southern Limburg we estimate it at 12° C and for Hienheim at 10° C. T h e summers were more or less anticyclonic and could therefore have been sunnicr. Under these circumstances the weather was tranquil. It is diflTicult to say something about the wind-force in winter. There was more precipitation than nowadays and perhaps it was spread differently over the year. As the summers are considered to have been reasonably dry, much of the precipitation must have fallen in wintertime. This flattens the curve of the precipitation in the climate diagrams. L a m b has demonstrated that it is sometimes possible, though with many reservations to calculate the amount of precipitation from the estimated temperature (Lamb 1965, L a m b et al. 1966). For this purpose, one requires regression equations of rainfall versus temperature, based on statistically significant correlation coefTicients between both quantities (Lamb et al. 1966 p . 188). L a m b calculated for England that circa 4000 B.C. the precipitation amounted to 110 to 115% of the present value.
For the calculation of the regression equation he used records from the year 1740 on. As we have at our disposal a long series of observations in the Netherlands too, we carried out Lamb's calculation with Dutch figures. We used the monthly means of the air-temperature in ° C at Zwanenburg-Utrecht-De Bilt, converted to De Bilt, and the monthly means of the amounts of precipitation at Zwanenburg, converted to Hoofddorp, as gathered by Labrijn, complemented with the records up to 1974 (Labrijn 1945 and 1948). These series of records start in 1735. We calculated the correlation coefTicients between the precipitation expressed in % of the 1921-1950 means and the temperature in ° C for the pairs: annual precipitation-annual temperature, precipitation in June/July/August-temperature in June/July/August, precipitation in December/January/February-tcmperature in December/January/February, precipitation in September to Maytemperature December/January/February and precipitation in September to J u n e -temperature December/January/February. Unfortunately, none of the calculated correlations was higher than I 0.4| . So no clear relation could be found for the Netherlands between precipitation and temperature. Such calculations have not yet been carried out for Germany.
T H E S U B S T R A T E 15
Mania (Mania 1973a). According to Mania, the Atlantic was 8-22°o wetter than now. This percentage relates to the Middle Elbe and Saale-area. It is of the same order of magnitude as Lamb's estimate. This may be coincidence: many more independent observations are necessary. If, however, we want to say something about the precipitation in the Atlantic, we must, for lack of better, work with an estimated precipitation of circa 110% of the present precipitation. VVhen we increase the present annual pre-cipitation of Sittard by 10%, we arrive at circa 770 mm. For Hienheim this figure becomes approximately 730 mm. It is obvious that these precipitation values must be handled with the greatest pos.sible care.
T h e differences between the present climate and that at the time of the LBK settlements are obvious. T h e wet winters and the warm, long summers, with perhaps much sunshinc, gave the climate a slightly mediterranean charactcr. This is in accordance with what Fuhrmann concluded in Sachsen (Fuhrmann 1973). At that time too, however, the climate at Hienheim was different from that in Southern Limburg. Especially the winters were colder and in general the climate had a more Continental character.
The reconstruction provides, of course, only a global impression of the climate. The climate at a certain place within the area studied, such as at the location of a settlement, is strongly influenced by local factors. T h e degree of exposure is of great importance and also the influence of the vegetation and the substrate should not be underestimated. For instance the presence of fringes of trees around a settlement can modify the micro-climate within that settlement considerably. The soil exerts an influence by its warmth coiiductivity, which co-determines the risk of night frost and the like. We must therefore consider the possibility that local variants, which cannot be reconstructed by means of the data used by us, existed in the climate.
I I I . 3 T H E S U B S T R A T E
By "substrate" we understand a number of abiotic environmental factors which are interrelated, namely geology, hydrology, relief and soil. These factors will be discussed in the following, first for the area in Southern Limburg and then for the one around Hienheim.
SOUTHERN LIMBURG
T h e deeper geological subsoil of the area around Sittard, Stein and Elsloo consists of deposits belonging to the Tertiary. they are shown in the "Geologische Overzichtskaart (kwartair afgedekt) 1:100000". (Kuyl 1971). North of Sittard there aresands and gravels from the Pliocene. Sediments from the Oligocene and the Miocene can be found more to the south. The Oligocene comprises glauconitic sands and some clay-layers. T h e deposits from the Miocene consist of fine .sands, in which seams of lignite may occur. T h e Southern limit of the formations from the Tertiary is formed by the limestone deposits of the Upper Cretaceous. This limit extends itself along the small stream, the Geul. The limestone formation lies just outside the 10 km zone around the LBK settlements.
During the Pleistocene, the older deposits were covered for the greater part by deposits from the river Maas. Because the area belongs to the periphery of the Ardennes, it was subject to uplift in this geological period. As a result a terrace landscape originated. Three main terraces can be distinguishcd, namely the Higher Terrace, the Middle Terrace and the Lower Terrace.* Several steps can be distinguishcd in these
16 THE ENVIRONMENT
terraces. T h e Higher and the Middle Terrace consist mainly of sand and gravel. The material originates for the greater part from the Ardennes. T h e Lower Terrace consists of fmer sediments, namely sand, sik and clay. T h e terraces of the river Maas broadly determine the present relief (de J o n g 1967 pp. 319 and 320).
During the Saaie- and Weichsel-glaciations, the relief was planed down by the deposit of loess and eolian sand on the Higher and Middle Terrace. T h e loess deposits are limited to the area east of the river Maas. T h e thickness of the loess mantle varies. T h e largest deposits are on the Middle Terrace, where the thickness may amount to 8-15 m. T h e loess deposit is much thinner on the Higher Terrace. North of the Roode Beek thcre is very little loess. It is sandy and contains much terrace gravel. West of the river Maas the terraces are covered with a very thin layer of eolian sand. For a more detailed description of the Quaternary deposits we refer to a publication of De J o n g (de J o n g 1967).
Nowadays the Lower Terrace is covered partly with Holocene alluvial silts and clays. These are also present in the Holocene valleys. T h e thick layers of loam and clay in the Western and Central European river-valleys originated, in as far as we know, in the Middle Ages and later (Huckriede 1972). They are the result of important anthropogene influences. T h e age of the loams and clays in the river-valleys will often have to be taken into account for the reconstruction of a landscape. Paulissen's investigation of the Maas-valley shows, howevcr, that the Maas deposited loams and clays during the entire Holocene. It is truc that the intensity of the alluviation varied with time. The alluviation was minimal during the Atlantic. T h e sedimentation increased continuously after this period. More and more coarse silt was deposited, which Paulissen attributed to the increasing deforestation of the loess areas upstream (Paulissen 1973 p. 246). T h e nature of the filling of the Maas-valley, however, has not changed essentially since the Atlantic. T h e bed material of the river itself consists of a coarse gravel. T h e diameter of the blocks is 80 cm at the most (Paulissen 1973 p. 87). At low discharges parts of the gravcls fall dry. These gravels were certainly present during the Atlantic.
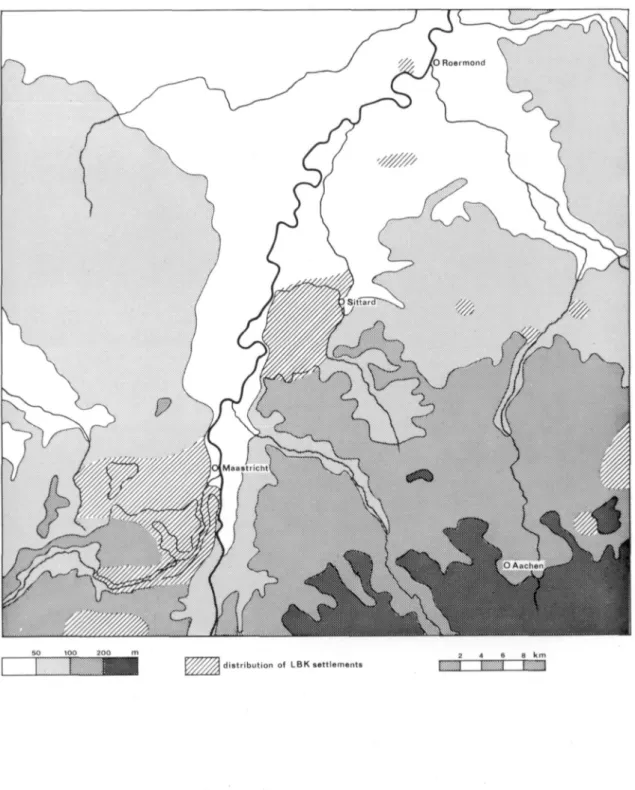
There are no other reasons either to assume that what can be scen on the recent geological m a p is different from the situation during the Atlantic. Figure 2 shows those sediments which are visible at the surface nowadays. In our opinion, this m a p gives a correct representation of the geological aspect of the substrate in the period of LBK occupation. The legend unit "Tertiary and older" comprises mainly Tertiary sands in the eastern part of the m a p and represents a complex of slope deposit and chalk along the small stream Geul. T h e legend unit "Remaining Pleistocene" mainly concerns terrace gravels of the Higher Terrace.*
T h e same figure shows the d r a i n a g e p a t t e r n . T h e most important river is the Maas. T h e entire region is drained by this river. It has a very irregular discharge; low water-levels may occur especially in summer. The Maas has a number of tributaries within the area under consideration. At the west side these are from south to north the Heeswater, the Zijpbeek and the Bosbeek. At the east side, the Maas receives water from the Geul, the Ur and the Geleen with the Roode Beek. T h e upper courses of the Geleen and the Roode Beek divide themselves into a great number of smaller streams and so-called dry valleys. T h e lattcr do not have a permanent water course cut carry water only after heavy rainfall or during the mclting of a layer of snow. Bocause of the great number of valleys and dry valleys, this landscape is strongly dissected. This can
T H E S U B S T R A T E 17
CM
Holoccnc alhivial deposits
I iOwer Tcrracc
Loess
I 1 riiin loess-covcr on i^ravt-1
Kemaining Pleistocenc
rrrtiary and older
9 'l'hc LBK settlements under consideration
O O t h e r LBK settlement sites
18 THE ENVIRONMENT
be seen in figure 2 by means of the course of the contour lines. T h e dissected landscape coincides with the loess-covered Higher Terrace. It seems that the drainage pattern was not subject to changes during the Holocene. The water courses were already in their present valleys at the time of LBK occupation. The meander system of the Maas was already activc during the Atlantic (Paulissen 1973 p. 123). The position of the meanders has changed of course. According to Paulissen, the Maas has moved noticeably to the east (Paulisscn 1966 p . 127). This means that Elsloo and Stein aresituated much closer to this water course at the present time than during the LBK occupation. It is impossible to reconstruct the exact course of the Atlantic river.
In the area under consideration, the surface water is restricted mainly to flowing water. But west of the Maas there are a few small lakes. Some of them now have a depth of 1.5 m (Willems 1975 verbal Information). The subsoil consists there of a little permeable layer of loamy sand, which has become entirely impermeable by the formation of a strongly cemented iron-B-horizon on which rain-water stagnates (Lamberts 1958). T h e question is whether such cemented horizons and thus the lakes cxisted already during the Atlantic. An indication that at least some of the lakes existed during the Subboreal may be seen in the fact that a concentration of Neolithic artefacts has been found around the water (Willems 1967).
T h e dry valleys require a closer consideration. They are a rather general phenomenon in the Central and Western European loess areas. Although some valleys may have originated comparatively recently, e.g. in the Subatlantic (Fuhrmann 1973), it is generally assumed and also demonstrated that they date from before the Holocene (Stevens 1934, Schalich 1973). Therefore the dry valleys of Southern Limburg already existed in the period of LBK occupation. It is imaginable that these valleys were not dry valleys at that time, but carried water all around the year. An argument in favour of this view could be that the climate was probablywetter during the Atlantic (see I I I . 2). In this connection we should like t o m a k e the following remarks. According to our climate reconstruction, there would have been more precipitation. Since temperatures were rather high, this precipitation occurred mostly in the form of rain. A part thereof disappears by evaporation (evaporation from the earth's surface) and by transpiration (evaporation by means of plan ts). Another part joins the ground water (infiltration) and is drained underground. T h e rest runs ofl over the surface. Evaporation and transpiration (together called evapotranspiration) are not only depcndent on the available moisture (rainfall) but also on the temperature, the wind speed and the relative humidity. As the temperature was higher during the Atlantic than in our days, the evaporation was possibly also more important than at present. Turc has developed a formula, with which the evapotranspiration can be calculated approximately from the annual rainfall and the annual temperature (Turc 1954). When the evaporation is known, it can be deducted from the precipitation, so that the quantity of water can be found which represents the annual runoff The application of Turc's formula on recent data and data of the reconstructed climate shows that the annual runoff was about the same in both periods. It is therefore improbable that the valleys regularly had to carry more water all the year around because of the increased rainfall. Moreover, the possible difference between the Atlantic and the present rainfall must be attributed mainly to an increased precipitation in winter. T h e calculation provides no Information about greater water discharges in winter, but it is obvious that in summertime the valleys must have been just as dry as nowadays.
THESUBSTRATE 19
deciduous forest (see I I I . 4). Deforestation has a pronounced effect on the hydrological cycle. This effect has been studied in the Hubbard Broek Expcrimental Forest, New Hampshire, USA. After a series of very accurate obscrvations concerning the hydrological cycle of an area covered with deciduous forest, all vegetation was removed from a part of this area. T h e deforestation took place in the winter of 1965-1966. T h e effect is described as follows; "Deforestation had a pronounced effect on runoff. Beginning May 1966, runoff from the cut watershed began to increase over the levels that would have been expected if there had been no cutting. T h e cumulative runofffor 1966 exceeded the expected amount by 40 percent. T h e largest diffcrence was recorded during the four months from J u n e through September, when the runoff was 418 percent higher than the expected amount. This difference is directly attributable to changes in the hydrological cycle resulting from the removal of the transpiring surface. Accelerated runoff has continued through the succeeding summers." (Borman & Likens 1970). Although the loess is used as agricultural land and is therefore not completely bare throughout the year, as was the expcrimental area in New Hampshire, the transpiration has probably decreased considerably in comparison with the Atlantic. Especially in the months of summer probably less rather than more water would remain for runoff.
The application of Turc's formula and the remarks concerning a possible correction of the calculated evaporation as a result of the deforestation lead to the conclusion, that it is improbable that the dry valleys carried water around the year during the Atlantic. One more remark should be made, namely that so far we have not taken into account the fact that the valleys were deeper in former days (see page 20). Their valley floor could have been at the level of the water table. We assume, for the following reason, that during the Atlantic the water table was at the present level. Since the loess and the terrace gravels underneath are permeable, a minor increase of the rainfall, especially vk'hen spread equally over time, will have led to an increased infiltration, though this does not necessarily involve a corisiderable rise of the water table. We assume that an increase of the rainfall by 10% in this area with permeable rocks has little influence on the level of the water table. T h e surplus of infiltrated water contributes to an increased runoff, be it not directly. T h e water table is very deep nowadays, much deeper than the base of the eroded loess.deposits, the so-called coUuvium, which fills the dry valleys (Stiboka 1974 verbal Information). In our opinion it is therefore not likely that the valley floor of the dry valleys reached the water table in the Adantic.
If the above assumptions are correct, they lead to the conclusion that during the Atlantic the dry valleys discharged less, rather than more water than today during the growing period, that is late spring, summer and early autumn. In wintertime the situation might have been the same as it is now. This would also apply to the discharge of the rivers and small streams, which carry water continuously.
For the water table we assume, in view of the geological subsoil, that it has not changed much since the Atlantic. This means that a high water table occurred only on terrains within the Lower Terrace and the valles of the ri^'ers and small streams. In the remaining area the level was at least 1 meter under the surface. For detailed data we refer to the soil map 1:25000, sheet 59, 60 west and 60 east (Stiboka 1970).
2 0 T H E E N V I R O N M E N T
Otherwise this area is rather even. T h e height of the rehef has been planed down considerably since the Atlantic by erosion and accumulation. Particularly in the loess area, this process has had great influence. Loess is extremely susceptible to erosion. The valleys are filled up with deposits of eroded loess, sometimes with a thickness of several meters: the so-called colluvium. Also lower places, which do not belong to a valley-system, are often partly filled up with colluvial material. T h e process of erosion and colluviation must have started as the result of the first agricultural activities and therefore during the Neolithic. This has been established by Schalich on a loess-plateau the "Aldenhovcncr Platte", which is located 30 km cast of the area underconsideration (Schalich 1973). But the process only became important in the Roman era; it is continuous to the present day (Scheys 1955, van den Broek 1958/1959, Schalich 1973). Therefore the thick colluvia in the valleys date from after the period under consideration. This means that the small valleys and the dry valleys could have been up to a few meters deeper at the time of LBK occupation. T h e surface of the plateaus was of course higher in that time. T h e difference with the present must have been considerable, especially in the dissected landscape.
Soil f o r m a t i o n has taken place in the different sediments in the course of time. O n the loess, Parabraunerdcn (Orthic Luvisols) were developed. T h e complete profile has been maintained in flat terrains only. O n slopes, the A-horizon and a part of the B-horizon have disappeared because of erosion. The argillic horizon lies at the surface here. In the valleys only a weakly developed Braunerde (Eutric Regosol) originated on the colluvium. The area with a thin cover of sandy loess on gravel also shows a Parabraunerde or a Braunerde. But where the loess is very sandy, the soil is slightly podzoHzed. The sands west of the Maas are characterized on our sheet of the m a p by a Podsol-Braunerde, Braunérde-Podsol (Leptic Podzols) or even a Humuseisen-Podzol or Humuspodsol (Humic Podzols) (Tavemier & Maréchal 1958, Lamberts 1958, Lamberts & Baeyens 1963, M u n a u t 1967). There are places where the podzol is very pronounced, and places where it has hardly developed. In the areas with fluviatile sands and gravels of the Higher Terrace, there are weakly developed Podsol-Braunerden (Dystric Cambisols). T h e Tertiary sands show Humuspodsole with very thick Albic horizons (bleached material). T h e Lower Terrace comprises a mosaic of different soils, since several different steps can be distinguished within the terrace. T h e water table differs from place to place. O n the terrains with the highest water level local peat formation even occurred, which led to Anmoorgleye (Humic Gleysols). A variety of hydromorphic soils prevails in the low parts. In the dryer parts the deposits with a fine texture formed Parabraunerdcn; the more sandy sediments formed weakly developed Podsol-Braunerden. The Holocene deposits in the river valleys show no or almost no profile development, Auenböden or Fluvisols. Depending on the regularity with which they were inundated, they are either calcareous or poor in lime. For details we refer to the Soil M a p of the Netherlands 1:50000, sheet 59, 60 west and 60 east (Sdboka 1970).*
The present soils have developed under the influence of many factors. T h e main ones are climate, hydrology, flora and fauna, man and certainly also the time during which these five factors could exert their influence. A recent soil map can therefore not be used without reservation to represent the situation in any particular prehistorie period.
THESUBSTRATE 21
For the situation at the time of LBK occupation, we may assume that the Holocene deposits in the river valleys showed as little profile development as nowadays. T h e history of the soil development in the Late Pleistocene deposits, however, is difficult to reconstruct. O n the loess, the soil formation begins directly after its deposition. By accumulation of organic matter, produced by the vegetation an A-horizon was formed. Water with dissolved CO2 and organic acids, produced by the vegetation and by decay of organic matter, causes a decalcification of the upper part of the soil. After decalcification weathering of other minerals starts, during which clay minerals and free iron oxide are formed. Eluviation of clay, which is possible after decalcification, causes a decrease in clay content in the surface horizon. T h e clay illuviates in a lower level and ferms the so-called argillic horizon or Bt. The question is how far this process of clay illuvation had advanced at the time of LBK occupation. Van den Broek concludes from his observations at Sittard, that the clay illuvation layer continued through the filling of the pits from the LBK period, instead of being interrupted thereby (van den Broek 1958/1959). Scheys writes about the Neolithic in a nearby loess area in Belgium: "Soils on eolian loess were practically as eluviated a s . . . they are nowadays." (Scheys 1962 p. 64). He made this observation in a loess section covered by colluvium at Rosmeer. O n and in the upper horizon of this section there were LBK artefacts. This does not necessarily mean that the colluviation occurred during or just after the LBK occupation; the argillic horizon may also date from some time after the LBK. However, in the same section Scheys observed that the pits of the LBK were dug through the A2-horizon into the clay illuviation layer. Therefore the clay illuviation at this spot dates from before the LBK, at least for an important part (Scheys 1962). In the loess area which is adjacent to ours in the east, Schalich also found that the development of the Bt took place before the LBK occupation (Schalich 1973 p. 14). Van den Broek's observation could not beconhrmed here, neitherin the field nor by means of thin sections (Geenen 1975 verbal Information). With Scheys and Schalich we assume that the clay illuviation zone in Southern Limburg was already present, at least to a ceftain extent, in the period under consideration. It is not inconceivable that the clay illuviation continued after this period.
T h e history of the podzol-development in the eolian sands has become known to some extent by the examination of buried profiles, which have been dated archeologically or palynologically (Scheys 1963, M u n a u t 1967). Ingeneral it isassumed that the Humus- und Humuseisenpodsoledevelopedonly after the Atlantic (Munaut 1967 p. 154 and the literature quoted there). The podzol-development must have been weak, as under the oldest known barrows only a very weak podzol profile can be seen in most cases. These barrows date from the Late-Neolithic, which means that the profiles are 2000 years later than the profiles which we intend to reconstruct. For the interpretation of the profiles under barrows we refer to an article by Modderman and to the literature quoted there (Modderman 1975). It appears from the above that the eolian sands carried a very weakly developed Podsol-Braunerde at the most during the LBK.
Practically nothing is known about the soil development in the other Late Pleistocene sediments. We assume that developments as in the loess and in the eolian sand took place. The only indication concerning the higher, sandy part of the Lower Terrace is perhaps present as a buried soil under a barrow at Swalmen, a place not far north of our region. Under the Late-Neolithic barrow Bosheide 1 a Podsol-Braunerde was found (Lanting & van der Waals 1974). But this profile, just as the buried profiles on the eolian sand, dates from 2000 years after the period under consideration.
22 THE ENVIRONMENT
With geology, hydrology, relief and soil profiles, the main aspects of the substrate have been discussed. In this discussion certain types of landscape have been mentioned. Finally we give a summary of the classification which we use for the substrate in the Atlantic. We distinguish:
1) A dissected loess landscape. The landscape is characterized by inany deep valleys, particularly dry valleys, and a few flat parts. On the small plateaus between the valleys the water table is deeper than 120 cm. In the loess a soil with an argillic horizon has developed.
2) A loess plateau. This rather flat terrain with a very thick loess deposit has its southern border near the terrace edge towards the Higher Terrace; in figure 2 this terrace edge lies in the area between the 75 m and
100 m contour line. In the west it is limited by the valley of the Maas, in the east by the Geleen, running parallel to the terrace edge of the Higher Terrace. The northern border is formed by a strip of thin loess on gravel. The water table is deeper than 120 cm. A soil with an argillic horizon has developed already in the loess.
3) An area with thin eolian loess on terrace gravel. A virtually undissected landscape, with the water table deeper than 120 cm. T h e soil probably already has the characteristics of the type of soil with an argillic horizon, although a slightly podzolized soil is not excluded.
4) An eolian sand area, hardly dissected, with in general a water table which is more than 2 m deep in summer. A few small lakes were probably present. T h e soil profile is at the most a Podsol-Braunerde. 5) A river-valley landscape, comprising both the Lower Terrace and the present valley of the Maas. T h e landscape is strongly dissected by small streams. The water table varies from place to place. Wet parts are not rare. At many places a soil profile has hardly developed. Perhaps the higher parts already show a slightly podzolized soil or a soil with an argillic horizon.
6) A landscape of sands and gravels which belong to the Higher Terrace. This landscape is hardly present in our area. We have not studied it in detail.
7) A landscape of Tertiary sands. Probably this landscape does not play an important part either. It is strongly dissected and has for the greater part its water table at a great depth. The soil profile is not known. A strongly developed podzol is not excluded.
HIENHEIM
THESUBSTRATE 23
be fouiid mainly south of the Donau. North of this river the Molasse-deposits have disappeared almost entirely by erosion.
T h e present drainage system originated in the Pleistocene. The Donau has been flowing in its present valley since the Riss-glaciation. As a result of tcctonic movements and strong climate oscillations.-terraces were formed by the tributaries of the Donau, the Abens and the Ilm, and later also by the Donau itself Several terrace steps can be distinguished, of which only the latest, the so-called Lower Terrace, is still of some size to-day. The terrace material consists of gravels with varying quantities of sand.
Part of the area was covered with loess and eolian sand during the Riss- and Würm-glaciations. The deposits of loess were practically limited to the left bank of the Donau. Near the river the thickness of the deposits does not exceed 4 m and becomes less further away. T h e loess areas cover only a small area on the right bank where mainly eolian sand was deposited.
The \alley of the Donau was filled up with fine-sandy sediments in the Holocene. In old stream channels more clayey sediments were deposited. Peat development could occur locally in abandoned meanders. The age of the Holocene river deposits has not yet been investigated systematically. Undoubtedly, much
material originated in historie periods (see p. 16). In the valley of the Feckinger Bach we were able to establish by means of pollen analysis that an alluvial deposit with a thickness of circa 2 m originated in the Subatlantic (Bakels, own observations). As the deposits of the Donau have a more sandy development at the base, whereas the silt content increases upwards (van de Wetering 1974), we assume that the sediment, which was at the surface at the time of LEK occupation, was more sandy than the present one. For the rest we prcsume that the geology of the area has not changed significantly since the Atlantic.
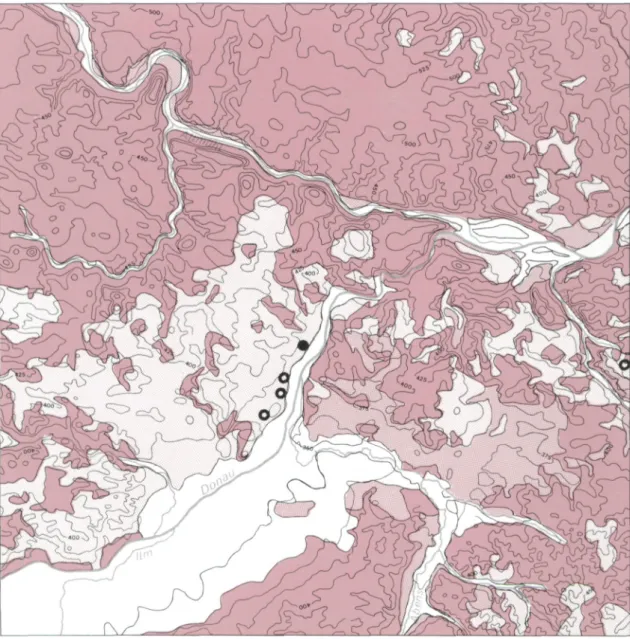
The present situation is shown in figure 3. In order to make the m a p legible, the deposits from the Jurassic, the Cretaceous and the Miocene have been brought together into one legend unit: Tertiary and older. North of the Donau this legend unit mainly represents Jurassic limestones and the products of limestone weathering. An exception is an area east of the Altmühl, where there is still much material from the Cretaceous and the Miocene. In this area some loess occurs locally. It can be recognized in figure 3 by the presence of these small loess areas. South of the Donau, the legend unit "Tertiary and older" refers to deposits from the Miocene in the area between the Donau and the Abens. The Miocene is also situated south and south-east of the eolian sand. Further the legend unit represents limestone from the Jurassic. T h e legend unit "Remaining Pleistocene" relates almost entirely to the eolian sands.
T h e m a p shown in figure 3 is based partly on already published sheets of the Geological M a p of Bayern 1:25 000, namely the sheets no. 7136 Neustadt a.d. Donau and no. 7037 Kelheim (Schmidt-Kaler 1968 and Rutte 1962). Dr. H. Schmidt-Kaler of the Bayerisches Geologisches Landesamt was so kind as to complete the missing parts.
24
T H E E N V I R O N M E N TFig. 3. The substrate within a radius of 10 kms around Hienheim. Scale 1:200000. For the legend see fig. 2.
Besides stream-valleys there are also dry valleys. These are found mainly in the loess area on the left bank of the Donau. As in Southern Limburg they carry water only during heavy rainfall or in times of melting snow. They are filled partly with colluvial material.
THESUBSTRATE 25
of Bad Gögging, 4 km south of Hienheim, are of this type. In general, however, the karst-water contains no hydrogen sulphide and provides excellent drinking-water. A second type of spring owes its existence to the presence of impermeable layers of clay in the subsoil. These clays belong to the formations of the Cretaceous or the Miocene. The springs from the Miocene supply the largest quantity of water. In addition to springs there are also wet places and pools, which originated because rainwater could not penetrate through clays just under the surface. These pools are of small size.
Most of the surface water is found in the area with Miocene deposits in the southern part of the map sheet. T h e limestone area is very poor in water resources.
Therc are no reasons to assume that the pattern of the drainage was essentially different at the time of LBK occupation. T h e rcmarks on p . 18, which relate to Southern Limburg, also apply to the deforested loe.ss in the surroundings of Hienheim. This means that the dry valleys carried water only incidentally, just as at present.
There remains the question to what extent the vast fenlands in the valley of the Donau and its tributaries have influenced the water discharge of the Donau. These peats are now for the greater part artificially drained, but undoubtedly they had a great capacity for water storage before the drainage. As far as can be established, the vast fenlands already cxisted during the Atlantic. We may assume that much water evaporatcd at the surface of these fenlands, espccially in summer. The summer discharge of the Donau may therefore have been less important than it is nowadays. Bcsides it is possible that because of the influence of the fenlands, the discharge of the river was more regular. The inundations, which now characterize the Donau-valley, may have occurred far less frequently.
We have also tried to show the r e l i e f i n f i g u r e S . It appears from the contour lines that there was almostno flat land. The few river-valleys in the limestone area have entrenched themselves very deeply. T h e limestone area itself is often described as a plateau, but it is, however, one with a rolling surface. This applies also to the area with formations from the Cretaceous, the Miocene and the Jurassic, to the loess and
to the eolian sand. T h e area of the Molasse is usually referred to as the "Tertiary Hilly Country". But the slopes of the hills in the area under consideration are very gentle, so that here too rolling landscape is a better term. ()nly the Lower Terrace and the wide Holocene valley of the Donau can be described as even ground. Both are separated from each other by a very clear terrace edge, which is visible as a step in the land.scape. The difference in height can be several meters.
26
T H E E N V I R O N M E N TFig. 4. Contour map of the scttlement area "Am VVeinberg" near Hienheim. Scale 1:5000. Lcft: reconstruction of the original relief
Right; recent situation.
Van de Wetering determined the extent of decapitation of the soil profile and the thickness of the covering colluvial layer. He added the missing part to the decapitated profiles and he subtracted the coUuvium from the covered profiles. Figure 4 shows the reconstructed contour lines next to the recent ones. T h e reconstruction of the original relief probably corresponds to the situation at the time of the LBK settlcment, since the colluviation must have been very slight in this period.
O n the relatively level settlement ground, the remainder of a river terrace, the differences between present and past are not very great, it is true, but are yet clearly present. As mentioned above, level ground is rare in the area around Hienheim. If the original relief of the entire loess landscape were mapped, it might appear that the area had an even more rolling character than nowadays.
THESUBSTRATE 27
strongly depends on the silt- and clay-content. Where the parent material consisted of calcareous deposits, it lias been decalcified to some depth. Loamy sands and loams therefore led to the development of soils with an argillic horizon. These soils are found in deposits from the Cretaceous and the Miocene, as well as in the loess. T h e sandy facies from the Cretaceous and the Miocene, the eolian sand and the terrace deposits high above the water table show Podsol-Braunerden and Braunerde-Podsole. Humuspodsole and Humuseisenpodsole are not present. A very weakly developed podzol is sometimes present on the sands from the Cretaceous and in the eolian sand.
In a large part of the Lower Terrace the water table is so close to the surface that a Gley is the result. Where peat development occurred on these wet grounds, Anmoor and Anmoorgleye (Humic Gley-sols) developed.
T h e Holocene river deposits hardly show any soil development; some humus has formcd in the relatively dry parts. T h e deposits of the Donau are richer in lime than those of the Abens.
Data relating to the above soils can be found in the pedological contributions to the explanatory book which accompanies the geological m a p sheets 1:25000 no. 7136 Neustadt a.d. Donau and no. 7037 Kclheim (Diez 1968, Kohl 1962) and in the explanatory book to the pedological map of Bayern 1:500000 (Vogel 1961).
In the surroundings of Hienheim the sediments from the Jurassic, the Cretaceous and the Miocene have been at the surface for a long time. It is not known to what extent the soils in these sediments have changed since the Atlantic. For lack of information we assume that a profile had developed in anv case. In these deposits, where the anthropogene influence has perhaps never been very great, as the land on them is not u.sed intensively nowadays, this profile was perhaps not much different from the present one. We also assume that the Lower Terrace and the Holocene river deposits showed profiles similar to the present ones. T h e history of the soil profile in the eolian sand, a relatively young formation, is unknown. T h e development of a podzol in these sands is closely related to the presence of pine-trees (Hohenester 1960). As these trees do not seem to have been part of the forest on the eolian sand during the Atlantic (see p. 41) we assume that there were no podzols yet.
In the case of the loess we do have some information. Van de Wetering observed the following at Hienheim: " T h e r e has been at least some illuviation of clay in natural soil profiles before the Bandcerarnic culture. Red burnt papules of oriented clay are found in pieces of red burnt loam in bandcerarnic pits." According to him it was not impossible that the loess showed the following soil profile: " T h e profile was decalcified to a certain depth, possibly the present depth, and had a B-horizon with at least some clay illuviation." (van de Wetering 1975a). Since there was already a soil type in this rather young sediment which resembled the present one, it is our opinion that the recent soil-map can be used globally as soil-map of the area around the Hienheim settlement.
It appears from the above that we may distinguish the following types of landscape:
28 THE ENVIRONMENT
2) A Hmestone area, partly covered vvith weathering loams. T h e ground is hilly and poor in water resources. T h e surface water is limited to some rivers, karst-springs and places where rain-water stagnates on impermeable sediments or residual loams. The soil development shows much variation. T h e area with the limestones is situated mainly in the north-western part ofthe m a p sheet shown in figure 3.
3) An area with eolian sand. 11 is situated exclusively south ofthe Donau, on a subsoil ofJurassic Hmestone and Miocene deposits. T h e eolian sands themselves are entirely permeable; the water table depends on the depth at which the impermeable layers in the material underneath are situated. T h e ground is hilly. No real podzols were developed yet in the Atlantic.
4) An area with river deposits. It is the only level ground in the surroundings of Hienheim. It comprises deposits from both the Donau and the Abens. With the exception of a few higher parts, this area was inundated more or less regularly until recently. In the lower parts there is hardly any soil development. 5) An area with loamy sands and sandy loams, which belong to the deposits ofthe Molasse-basin. T h e ground is hilly. The groundwater stagnates on impermeable clays, the depth of which determines the water table. T h e latter is usually far below the surface, but can reach the surface at some places and then forms a spring horizon. Several small rivers rise in this area. Depending on the loam-content, a slightly podzolized soil or a soil with an argillic horizon has developed in the sediments. T h e area with the deposits from the Miocene Molasse-basin is situated mainly in the southern part ofthe m a p shown in figure 3. T h e unit lies for the greater part outside the 10 km zone around the LBK settlement.
6) An area with a mosaic of Jurassic limestones, deposits from the Cretaceous and Miocene sands and loams. There are a few springs in this area; for the rest it is rather dry. T h e soil development is dependent on the parent material and therefore heterogenous. T h e area is confined to the north-eastern part of figure 3 and limited by the Altmühl and the Donau. It is not represented within the 10 km zone around Hienheim.
I I I . 4 T H E V E G E T A T I O N
A reconstruction of a vegetation is usually based on the interpretation of pollen diagrams, complemented, if possible, with data from wood analysis and seed examination.* In the following, we shall try to reconstruct the vegetation ofthe landscapes dcscribed in the preceding paragraph by means of this kind of data.
SOUTHERN LIMBURG
In Southern Limburg, we are confronted in the first place with the two loess landscapes, the terrain with eolian sand and the area with a thin loess cover on gravel, as well as the river valley landscape, which comprises both the Lower Terrace and the Holocene valley of the Maas. T h e Tertiary sand and the Higher Terrace are hardly represented within the 10 km radius around the settlements. We shall discuss the loess plateau and the dissected loess landscape together, since both plateaus and valleys are included in our study, and since we feel that the size ofthe plateaus has no relevance to the vegetation on it.
In the loess l a n d s c a p e the number of deposits which are suitable for pollen analysis is not large. T h e plateaus are too dry for the conservation of pollen. T h e colluvium in the dry valleys is unsuitable for the same reason, so that we are dependent on the peaty deposits in the stream valleys. Unfortunately, the
THE VEGETATION 29
valley deposits are also rarely ideal for pollen analysis, since they are frequently interrupted by hiatuses, resulting from shifts in the stream bed and the consequent erosion of the older sediments.
The loess landscape is nowadays completely deforested. Where not covered by houses or industrial plants, it is used as arable. T h e valleys support grasslands. The first diagram from this area, however, already showed that the region has been covered with forests. This diagram relates to Broeksittard and was published in 1953 by Belderok and Hendriks (Bclderok & Hendriks 1953). Unfortunately, it is too summary to be used for a vegetation reconstruction. A few years later, Janssen examined 35 sloughs in the area covered mainly with loess and 7 such places on the edge of the loess area and the valley of the Maas. It appeared thatonly H o u t of these 42 sloughs were suitable for pollen analysis (Janssen 1960). At thesame time, Van Zeist took samples from peat covered with colluvium near Sittard (van Zeist 1958/1959). As the loess area of Southern Limburg has hereby been studied sufficiently for our purpose, we dit not think a new investigation necessary. It is possible, however, that .somewhere there is peat buried colluvium, which might provide good results.
Janssen used the zonation of Firbas for the division of his diagrams. Unfortunately, he added no C14 dates to his diagrams. The transition from Firbas VI to Firbas V I I , however, is generally dated to around 4000 B.C., so that for a reconstruction of the vegetation during the LBK, we should use the data from the last part of zone VI and pcrhaps the beginning of zone V I I . Zones VI and V I I , which are also referred to by the names of Older Atlantic and Younger Atlantic, are present in 6 of Janssen's 14 diagrams. They are characterized by high percentages of Tilia (lime), Corylus (hazel) and Alnus (alder). Zone V I I distinguishes itself from Zone VI by the first occurrence of Fagus (beech) in small percentages.
In V a n Zeist's diagram, the Boreal is foliowed by a zone with a small percentage of Fagus and a considerable amount of Tilia, Corylus and Alnus. This zone correspxjnds to Janssen's zone V I I . To the beginning of this zone at Sittard belongs a C14 date of 3130 ± 80 B.C. (GRO-1660), so that this part of the deposit is too recent to serve directly for a reconstruction of the vegetation around 4000 B.C. It seems that zone V I is absent at Sittard.
Zone V I is represented only in the diagrams Leiffenderven and Brommelen. The Leiffenderven is in the valley of the Roode Beek, 10 km east of Sittard. Brommelen is in the valley of the Geleen, 5 km north-west of Heerlen. The other 4 diagrams from Janssen's publication in which the Atlantic is present, begin either with zone V I I (Rimburg), or zone V is foliowed directly by zone V I I (Cortenbach 2, Voerendaal 1, Voerendaal 2). The hiatus in the deposits of the former lake, in which the borings Cortenbach and Voerendaal aresituated, is probably largerstill, since theattributionofzone V I I to Firbas V I I is unlikely to be correct. At Cortenbach 2, Centaurea cyanus was found in " V U " and Juglans at Voerendaal 1; these species do not usually occur until the Sub-Atlantic. The Rimburg core was taken in the valley of the Wurm, a small stream beyond the limits of the map of figure 2, some 7 km north-east of Heerlen. T h e small peat deposit Voerendaal/Cortenbach is located in the valley of the Geleen, 4 km west of Heerlen.
In the Leificnderven only 20 cm of deposit belong to zone V I . Moreover, the surroundings are but partly covered with loess. In the Brommelen diagram, the lowermost 25 cm belong to zone V I . Consequently there is not much material to base a reconstruction of the vegetation in the loess landscape on. However, in both the Leiffenderven and Brommelen diagrams there appears to be such a continuity between zones VI and V I I , that we can also use zone V I I for our reconstruction, provided we leave Fagus
(practically the only difference between the two zones) out of consideration.