EFFECTS OF BIOREMEDIATION ON BIOAVAILABILITY AND GENOTOXICITY OF CONTAMINANTS IN PAH-CONTAMINATED SOIL
Jing Hu
A dissertation submitted to the faculty of the University of North Carolina at Chapel Hill in partial fulfillment of the requirements for the degree of Doctor of Philosophy in the
Department of Environmental Sciences and Engineering, Gillings School of Global Public Health.
Chapel Hill 2012
ABSTRACT
JING HU: Effects of Bioremediation on Bioavailability and Genotoxicity of Contaminants in PAH-contaminated Soil
(Under the direction of Michael D. Aitken)
Polycyclic aromatic hydrocarbons (PAHs) are a major pollutant class at thousands of contaminated sites. They are of great concern due to their genotoxicity, mutagenicity and carcinogenicity. Bioremediation is one of the commonly applied remediation strategies to clean up PAHs from the soils and the sediments. However, remediation goals are typically based on removal of the target PAHs rather than on broader measures related to health risks. To better understand the risks addressed by remedial action and the risks caused by remedial action, the bioavailability and genotoxicity of contaminants in a PAH-contaminated soil from a former manufactured-gas plant site were investigated for two bioremediation processes simulated in the laboratory: an ex situ bioreactor system and an in situ column system.
bioavailability.
ACKNOWLEDGEMENTS
To my academic advisor, Dr. Michael D. Aitken: thank you for your guidance, support and encouragement. To my committee members: thank you for your advices from a variety of perspectives. To Fox: thank you for making me strong along the journey. To my parents: thank you for your unconditional love and for believing in me without hesitation.
I thank Stephen Richardson for operating the column system and performing the analyses on soil characterization for the column system. I thank Alden Adrion for developing the method and performing the analysis of the oxy-PAHs. I thank Chad Roper for design of the method to measure desorption to the C18 disk. I thank Hiroshi Arakawa, Jean-Marie Buerstedde, and Shunichi Takeda for providing various DT40 mutants. I thank Wei Sun for assistance in statistical analysis. I thank Bo Pan (Kunming University of Science and Technology, Kunming, China) for advice on dialysis tubing selection. I also thank Xin-Rui Xia and Xiang Q. Kong (both of North Carolina State University) for assistance with HLB resin application.
TABLE OF CONTENTS
LIST OF TABLES…...ix
LIST OF FIGURES.. ... x
1. INTRODUCTION... 1
1.1. Specific aims and rationale ... 2
1.2. Dissertation organization ... 4
2. LITERATURE REVIEW... 5
2.1. PAH contamination... 5
2.2. PAH distribution in contaminated coil... 7
2.3. Bioavailability of PAHs in contaminated soil ... 11
2.3.1. Bioavailability of toxic and genotoxic agents ... 11
2.3.2. Bioavailability relevant to dermal uptake... 13
2.4. Bioremediation of PAHs in contaminated soil... 18
2.4.1. Microbial metabolism of PAHs ... 18
2.4.2. Incomplete PAH metabolism ... 22
2.5. Genotoxicity of PAH-contaminated soil ... 24
2.5.2. Effects of bioremediation on genotoxicity of PAH-contaminated
soil... 28
2.6. DT40 genotoxicity bioassay... 30
2.6.1. Reverse genetic approach for genotoxicity test ... 31
2.6.2. Advantages of DT40 cell lines in genotoxicity test ... 32
3. DESORPTION OF POLYCYCLIC AROMATIC HYDROCARONBS FROM FIELD-CONTAMINATED SOIL TO A TWO-DIMENSIONAL HYDROPHOBIC SURFACE BEFORE AND AFTER BIOREMEDIATION... 34
3.1. Introduction... 34
3.2. Materials and methods ... 35
3.2.1. Materials ... 35
3.2.2. Desorption experiments ... 37
3.2.3. PAH extraction and analysis ... 38
3.2.4. Data analysis ... 39
3.3. Results ... 39
3.4. Discussion... 43
4. EVALUATING THE EFFECTS OF BIOREMEDIAITON ON GENOTOXICITY OF POLYCYCLIC AROMATIC HYDROCARON-CONTAMINATED SOIL USING GENETICALLY ENGINEERED, HIGHER EUKARYOTIC CELL LINES ... 48
4.1. Introduction... 48
4.2. Materials and methods ... 50
4.2.2. Soil, bioremediation processes, and sampling ... 51
4.2.3. Sample extraction, PAH analysis and residue preparation... 52
4.2.4. DT40 DNA damage response analysis... 53
4.2.5. Data analysis ... 53
4.3. Results ... 54
4.4. Discussion... 59
4.4.1. Effects of bioremediation on toxicity and genotoxicity ... 59
4.4.2. Temporal change in toxicity and genotoxicity in the bioreactor system ... 60
4.4.3. Source of toxicity... 60
4.4.4. Genotoxicity profiling ... 61
4.4.5. Value of genotoxicity testing ... 63
5. BIOAVAILABILITY OF (GENO)TOXIC CONTAMINANTS IN PAH-CONTAMINATED SOIL FROM A FORMER MGP SITE BEFORE AND AFTER BIOLOGICAL TREATMENT... 64
5.1. Introduction... 64
5.2. Materials and methods ... 66
5.2.1. Materials ... 66
5.2.2. Desorption experiments ... 67
5.2.3. Sample extraction, chemical analysis and DT40 bioassay... 68
5.2.4. Data analysis ... 69
5.3.1. Dialysis tubing desorption method validation ... 69
5.3.2. Biodegradability and desorbability of PAHs and oxy-PAHs... 71
5.3.3. Toxicity and genotoxicity ... 74
5.4. Discussion... 76
6. CONCLUSIONS AND RECOMMENDATIONS ... 80
6.1. Conclusions... 80
6.2. Recommendations for future work ... 83
APPENDIX A. SUPPORTING INFORMATION FOR CHAPTER 3 ... 85
APPENDIX B. SUPPORTING INFORMATION FOR CHAPTER 4 ... 94
APPENDIX C. SUPPORTING INFORMATION FOR CHAPTER 5 ... 99
LIST OF TABLES
Table 2.1 Chemical structures and selected properties of the 16 USEPA Priority
Pollutant PAHs a, b... 7 Table 2.2 LD50 values of some representative PAHs a... 25 Table A.1 Methods used to measure the properties of the source soil. ... 85 Table A.2 Concentrations of PAHs in source soil and treated soil from a
laboratory bioreactor (n = 3). ... 86 Table A.3 PAH mass desorbed to C18 disks after 12 repeated soil loadings of the
same C18 disk. Each time, 100 mg/cm2 fresh source soil (soil moisture content 2%, temperature 20 ºC) was loaded onto the C18
disk for 24 h. ... 87 Table A.4 PAH recovery (%) for desorption to C18 disks and to Tenax beads. ... 88 Table A.5 Fitted parameter values for models representing desorption from
source soil (SS) or biologically treated soil (BS) to Tenax beads or
from source soil to C18 extraction disks at 20 ºC a,b. ... 89 Table A.6 Selected properties of 14 target PAHs a, b. ... 90 Table B.1 Concentrations of individual PAHs in the soil before and after two
bioremediation processes (ng/mg dry soil) (n = 3). ... 94 Table B.2 Table of LD50 for BPDE, MMS and H2O2 as positive control (µg/L) (n
= 3). ... 95 Table B.3 Partial correlation coefficients and corresponding p-values among
LD50, 1/CtPAHs and 1/Cresidue... 96
Table C.1 Concentrations of PAHs and oxy-PAHs in the feed soil and treated
soils. Data are means and standard deviations of triplicates... 99 Table C.2 Recovery (%) of PAHs and oxy-PAHs for the dialysis-tubing
LIST OF FIGURES
Figure 2.1 Microbial aerobic metabolism of PAHs (from reference (Bamforth
and Singleton 2005))... 19 Figure 2.2 Proposed pathway for anaerobic metabolism of naphthalene under
sulfate-reducing conditions (from reference (Bamforth and Singleton
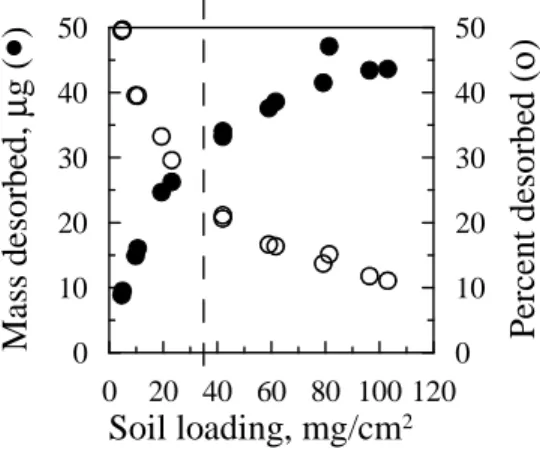
2005)). ... 22 Figure 3.1 Total PAHs desorbed from source soil to C18 extraction disks as a
function of soil loading. Soil moisture content was 2%, temperature 20 ºC and contact time 6 d. Dashed vertical lines indicate the
estimated maximum monolayer coverage of 34 mg/cm2... 40 Figure 3.2 Desorption of PAHs to C18 disks from source soil with or without a
glass microfiber filter placed between the C18 disk and the soil. Soil moisture content was 2%, soil loading 40 mg/cm2, temperature 20 °C, and contact time 6 d. Desorption was less than 2% for BaA, CHR, BbF, BkF, BaP, DBA and BgP under all three conditions. The same letter is assigned to conditions for which there was no significant
difference (p > 0.05)... 41 Figure 3.3 Effect of SMC on desorption of PAHs to C18 disks from source soil.
Soil loading was 50 mg/cm2, temperature 20 °C, contact time 6 d. Desorption was less than 2% for BaA, CHR, BbF, BkF, BaP, DBA and BgP under all four conditions. Same letter is assigned to
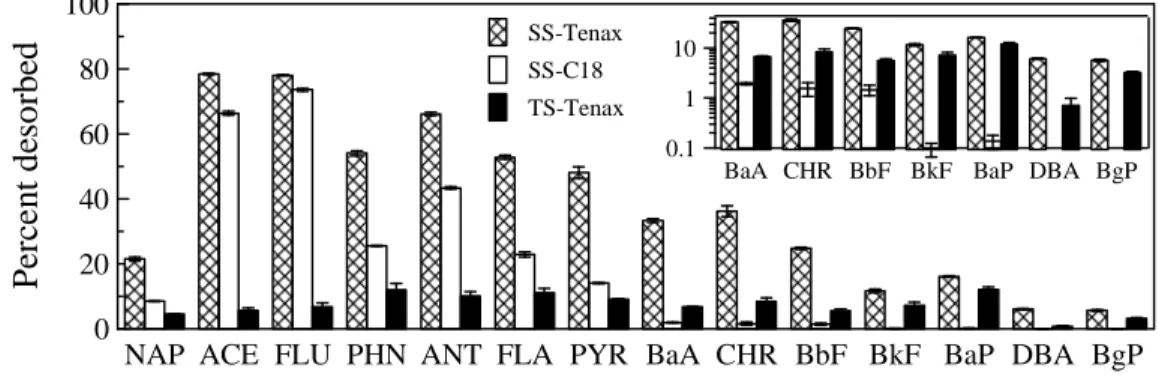
conditions where difference was not significant (p > 0.05)... 42 Figure 3.4 Desorption of individual PAHs from source soil to Tenax beads
(SS-Tenax) or to C18 disks (SS-C18) or from biologically treated soil to Tenax beads (TS-Tenax). The inset enlarges the results for higher molecular weight PAHs. All measurements were at 20 ºC at a 16-d contact time. For desorption to C18 disks, soil moisture content was 2% and soil loading 50 mg/cm2. Desorption to C18 disks from
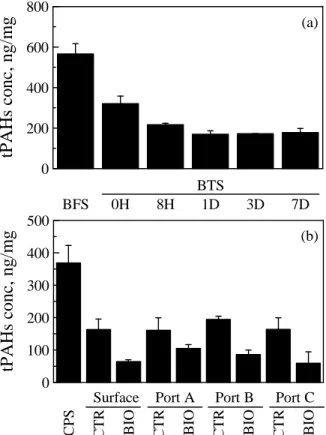
biologically treated soil was not detectable. ... 43 Figure 4.1 Total PAH concentration of soil before and after bioremediation. (a)
BIO, biostimulated-column treated soil. ... 55 Figure 4.2 LD50 of soil before and after bioremediation for parental DT40 cell
line and its Rad54-/- mutant. (a) Soils from five consecutive sampling times during 7 d cycle in the bioreactor treatment. (b) Soils from both control column and biostimulated column at four sampling points along each column after 2.5 year column treatment. Values are mean ± SD of three separate experiments. Abbreviations are as defined in
Figure 4.1. ... 56 Figure 4.3 Inverse correlations between LD50 and concentrations of tPAH for
parental DT40 cell line (a) and its Rad54-/- mutant (b), and between LD50 and concentrations of total residue for parental DT40 cell line (c)
and its Rad54-/- mutant (d). Each data point represents the mean for each soil sample (total 15 samples) including untreated column packing soil, all sampling points along each column, untreated bioreactor feed soil, and all sampling events for bioreactor-treated soil during the 7 d cycle. Asterisks indicate the correlation is
statistically significant (p < 0.05)... 57 Figure 4.4 LD50 (a) and relative LD50 (b) of soil before and after 2.5 year column
treatment in the test with a battery of DT40 cell lines. Values are mean ± SD of three separate experiments. Different letters are assigned to conditions for which there was a significant difference (p < 0.05). Asterisks indicate values significantly less than 1 (p < 0.05). CPS, untreated column packing soil; CTR-A, control-column treated
soil at Port A; BIO-A, biostimulated-column treated soil at Port A. ... 58 Figure 5.1 Desorption kinetics of total PAHs and total oxy-PAHs to HLB resin
from (a) feed soil and (b) treated soil removed from the bioreactor 1 day after feeding using the dialysis-tubing desorption method
described in the text. ... 70 Figure 5.2 Comparison of desorption of PAHs and oxy-PAHs from feed soil to
HLB resin and Tenax beads in the dialysis-tubing desorption method and in the conventional Tenax-bead desorption method. NAP: naphthalene; ACE: acenaphthene; FLU: fluorene; PHN:
phenanthrene; ANT: anthracene; FLA: fluoranthene; PYR: pyrene; tPAHs: total PAHs; tOxy-PAHs: total oxy-PAHs. Desorption was less than 2% for benz[a]anthracene (BaA), chrysene (CHR),
benzo[b]fluoranthene (BbF), benzo[k]fluoranthene (BkF), benzo[a]pyrene (BaP), dibenz[a,h]anthracene (DBA) and
benzo[g,h,i]perylene (BgP) under all methods. Desorption time was 7 d. There was no significant difference (p > 0.05) between methods for
Figure 5.3 Removal of PAHs and oxy-PAHs in the treated soils sampled at three time intervals during 7-d feeding cycle: immediately after feeding (TS-d0), 1 d (TS-d1) and 7 d (TS-d7) after feeding. In all cases, there was a significant difference (p < 0.05) between removal of an
oxy-PAH and the corresponding parent PAH. Removal is relative to
the initial concentration of the respective analyte in the feed soil. ... 72 Figure 5.4 Desorption of PAHs and oxy-PAHs to HLB resin (H) and Tenax
beads (T) from feed soil (FS) and treated soils (TS) sampled at three time intervals during 7-d feeding cycle: immediately after feeding (TS-d0), 1 d (TS-d1) and 7 d (TS-d7) after feeding. Different letters are assigned to conditions for which there was a significant difference
(p < 0.05)... 73 Figure 5.5 Percentage of PAH and oxy-PAH removed at the end of 7-d treatment
cycle vs. percentage of PAH and oxy-PAH desorbed from the feed soil. Each point represents the mean value for an individual PAH or oxy-PAH. The dashed line represents a 1:1 correlation. Close and open circles represent PAHs and oxy-PAHs respectively. NAP is not
included because no removal was observed. ... 74 Figure 5.6 LD50 of solvent extracts (SE) and constituents desorbed to HLB (H)
and Tenax (T) of soils for parental DT40 cell line and its Rad54-/- mutant. TS-d0, TS-d1 and TS-d7 represent treated soil sampled immediately after feeding, 1 d and 7 d after feeding during the 7-d feeding cycle, respectively. The inset enlarges the results for LD50 of
solvent extracts... 75 Figure 5.7 Relative LD50 of solvent extracts (SE) and constituents desorbed to
HLB (H) and Tenax (T) of soils. TS-d0, TS-d1 and TS-d7 represent treated soil sampled immediately after feeding, 1 d and 7 d after feeding during 7-d feeding cycle, respectively. Different letters are assigned to conditions for which there was significant difference (p < 0.05). Data are organized by extract type in panel (a) and by sample
type in panel (b). ... 76 Figure A.1 Total PAHs desorbed from source soil to C18 extraction disks as a
function of time. Soil moisture content was 2%, temperature 20 ºC.
Results for triplicate C18 disks are shown at each time point. ... 91 Figure A.2 Effect of temperature on desorption of individual PAHs to C18 disks
as a function of soil loading after 6 d contact time. Soil moisture content was 2%. Desorption was less than 0.5 µg each for
dibenz[a,h]anthracene (DBA), and benzo[g,h,i]perylene (BgP) for all soil loadings at all three temperatures. Note that the legend is at the
lower right. ... 92 Figure A.3 Cumulative desorption of selected PAHs from source soil to Tenax
beads (●), from source soil to C18 extraction disks (○), or from biologically treated soil to Tenax beads (▲) at 20 ºC. Lines represent best fits to the first-order two-site desorption model for source soil and to a simple first-order one-site desorption model for biologically
treated soil. ... 93 Figure B.1 Cell survival of DT40 parental cells and mutant Rev3-/- exposed to
benzo[a]pyrene. ... 98 Figure C.1 LD50 of solvent extracts of soils before (SE) and after desorption to
HLB (H-SE) or Tenax (T-SE) for parental DT40 cell line and its
Rad54-/- mutant. TS-d0, TS-d1 and TS-d7 represent treated soil sampled immediately after feeding, 1 d and 7 d after feeding during 7-d feeding cycle, respectively. No significant differences (p > 0.05) of LD50 for DT40 or Rad54-/- were observed among solvent extracts
of each sample before or after desorption to HLB or to Tenax... 101 Figure C.2 Relative LD50 of solvent extracts of soils before (SE) and after
desorption to HLB (H-SE) or Tenax (T-SE). TS-d0, TS-d1 and TS-d7 represent treated soil sampled immediately after feeding, 1 d and 7 d after feeding during 7-d feeding cycle, respectively. No significant differences (p > 0.05) of relative LD50 were observed among the
solvent extracts of each sample before or after desorption to HLB or
1. INTRODUCTION
Polycyclic aromatic hydrocarbons (PAHs) are among the contaminants of greatest concern at thousands of contaminated sites (USEPA 2004a; USEPA 2011), due to their known or suspected genotoxic, mutagenic or carcinogenic effects (Ramesh et al. 2004; Baird et al. 2005). PAHs have been found at over 700 Superfund sites (USEPA 2011) and also are the predominant pollutant class at an estimated 45,000 former manufactured gas plant (MGP) sites in the U.S.A. (USEPA 2004a). Bioremediation is an established technology to clean up PAH-contaminated soils and sediments by microbial degradation (Bamforth and Singleton 2005; USEPA 2007; Elliot et al. 2011). As of 2005, bioremediation was used at 26% of the PAH-contaminated Superfund cleanup sites designated by the United States Environmental Protection Agency (USEPA), more than any other single remediation technology (USEPA 2007).
caused by or remaining after bioremediation is essential to understanding and overcoming those factors that could limit the application of bioremediation to an even broader range of PAH-contaminated sites. The research described herein seeks to investigate the sources and bioavailability of toxic and genotoxic agents in PAH-contaminated soil undergoing bioremediation using chemical analysis coupled with a toxicity/genotoxicity bioassay.
1.1. Specific aims and rationale
Aim 1: Evaluate desorption of polycyclic aromatic hydrocarbons from field-contaminated soil to a two-dimensional hydrophobic surface before and after bioremediation.
Aim 2: Evaluate the effects of bioremediation on genotoxicity of polycyclic aromatic hydrocarbon-contaminated soil using genetically engineered, higher eukaryotic cell lines.
In most cases it remains unknown whether the removal of the targeted PAHs during bioremediation corresponds to a reduction in health risk (Lemieux et al. 2009). Significant amounts of other carcinogenic polyaromatic compounds are also found in PAH-contaminated soils (Lundstedt et al. 2003; Lemieux et al. 2008; Lemieux et al. 2009), and whether all hazardous compounds degrade concomitantly with the targeted PAHs monitored at contaminated sites is unknown (Lundstedt et al. 2003). Incomplete metabolism of PAHs in contaminated soil can also yield byproducts during bioremediation, which can exhibit greater toxicity than the parent PAHs (Lundstedt et al. 2003; Lundstedt et al. 2007; Lemieux et al. 2008; Lemieux et al. 2009). Aim 2 was to investigate effects of bioremediation on toxicity and genotoxicity of PAH-contaminated soil from a former MGP site using the DT40 DNA damage response analysis.
Aim 3: Evaluate the bioavailability of (geno)toxic contaminants in PAH-contamianted soil from a former MGP site before and after biological treatment.
considerations into the evaluation of contaminated sites to reduce the extent of cleanup required to that which is necessary to be protective of human health and the environment (ITRC 2011). Aim 3 was to investigate the bioavailability of PAHs and their oxygenated metabolites (oxy-PAHs) and the associated toxicity and genotoxicity during biological treatment, using the same toxicity/genotoxicity assay and bioreactor system used under Aim 2.
1.2. Dissertation organization
This dissertation is compiled into six chapters. Chapter 1 is an introduction into the objectives, rationale and framework of the dissertation. Chapter 2 is a review of literature to date, which provides background information for the work described in this dissertation. Chapters 3, 4 and 5 are each dedicated to one of the specific aims previously outlined. Chapter 3 and Chapter 4 were published in Chemosphere (Hu and Aitken 2012) and Environmental Science & Technology (Hu et al. 2012), respectively. Chapter 5 is a draft manuscript intended for submission to a peer-reviewed journal. Chapter 6 provides conclusions and recommendations for future research.
2. LITERATURE REVIEW
2.1. PAH contamination
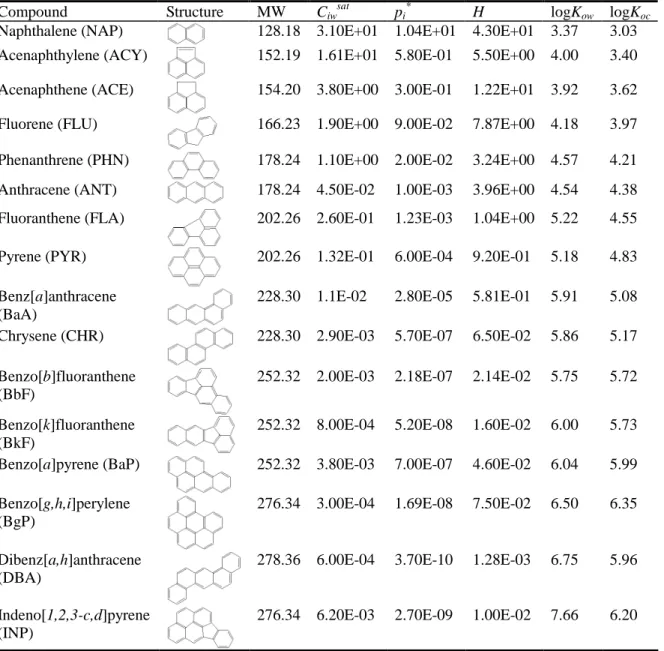
PAHs are a class of compounds consisting of two or more fused benzene rings (Harvey 1991) which provide high chemical stability through the delocalization of electrons in their chemical bonds (Schwarzenbach et al. 2003). They are non-polar compounds with low aqueous solubilities, vapor pressures and Henry’s law constants, but high octanol/water and organic carbon partitioning coefficients (Mackay et al. 1992). Selected properties of 16 USEPA Priority PAHs are presented in Table 2.1. The chemical stability and hydrophobicity of PAHs contribute greatly to their persistence in the environment (Schwarzenbach et al. 2003; Bamforth and Singleton 2005; Johnsen et al. 2005; Lu et al. 2011).
Table 2.1 Chemical structures and selected properties of the 16 USEPA Priority Pollutant PAHs a, b
Compound Structure MW Ciw
sat
pi *
H logKow logKoc
Naphthalene (NAP) 128.18 3.10E+01 1.04E+01 4.30E+01 3.37 3.03 Acenaphthylene (ACY) 152.19 1.61E+01 5.80E-01 5.50E+00 4.00 3.40 Acenaphthene (ACE) 154.20 3.80E+00 3.00E-01 1.22E+01 3.92 3.62
Fluorene (FLU) 166.23 1.90E+00 9.00E-02 7.87E+00 4.18 3.97
Phenanthrene (PHN) 178.24 1.10E+00 2.00E-02 3.24E+00 4.57 4.21 Anthracene (ANT) 178.24 4.50E-02 1.00E-03 3.96E+00 4.54 4.38 Fluoranthene (FLA) 202.26 2.60E-01 1.23E-03 1.04E+00 5.22 4.55
Pyrene (PYR) 202.26 1.32E-01 6.00E-04 9.20E-01 5.18 4.83
Benz[a]anthracene (BaA)
228.30 1.1E-02 2.80E-05 5.81E-01 5.91 5.08
Chrysene (CHR) 228.30 2.90E-03 5.70E-07 6.50E-02 5.86 5.17
Benzo[b]fluoranthene (BbF)
252.32 2.00E-03 2.18E-07 2.14E-02 5.75 5.72
Benzo[k]fluoranthene (BkF)
252.32 8.00E-04 5.20E-08 1.60E-02 6.00 5.73 Benzo[a]pyrene (BaP) 252.32 3.80E-03 7.00E-07 4.60E-02 6.04 5.99 Benzo[g,h,i]perylene
(BgP)
276.34 3.00E-04 1.69E-08 7.50E-02 6.50 6.35
Dibenz[a,h]anthracene (DBA)
278.36 6.00E-04 3.70E-10 1.28E-03 6.75 5.96
Indeno[1,2,3-c,d]pyrene (INP)
276.34 6.20E-03 2.70E-09 1.00E-02 7.66 6.20
a
abbreviations: MW = molecular weight (g/mol); Ciw sat
= aqueous solubility (mg/L); pi *
= vapor pressure (Pa); H = Henry’s Law Constant (Pa·m3/mol· K); Kow = octonol/water partitioning coefficient; Koc = organic carbon partitioning coefficient.
b
All data from (Mackay et al. 1992). 2.2. PAH distribution in contaminated coil
components of the soil, including minerals, soil organic matter (SOM), combustion residue particles and various non-aqueous phase liquids (NAPLs) (Chai et al. ; Zhou et al. ; Gustafsson et al. 1997; Luthy et al. 1997; Hong et al. 2003; Cornelissen et al. 2005). There is a great diversity of physical and chemical principles that govern the interactions between HOCs and these soil components. When total organic matter is present above trace levels in soils/sediments, sorption of HOCs by inorganic minerals could be neglected (Schwarzenbach and Westall 1981; Kile et al. 1995; Huang and Weber 1997; Luthy et al. 1997). Although the mineral phase can indirectly regulate sorption by controlling the distribution and/or conformation of organic matter at the solid-aqueous interface (Xiao et al. 2004; Feng et al. 2006), organic matter controls sorption and bioavailability of HOCs in soils/sediments (Schwarzenbach and Westall 1981; Kile et al. 1995; Huang and Weber 1997; Luthy et al. 1997).
is characterized by relatively rapid rates of sorption and desorption, little or no sorption-desorption hysteresis, and greater bioavailability of sorbed HOCs. The “glassy” domain is characterized by nonlinear sorption, slow rates of sorption and desorption, sorption-desorption hysteresis, and significantly reduced bioavailability of sorbed HOCs. Sorption of HOCs to soil is the combination of sorption to the rubbery domain by dissolution (linear sorption) and sorption to the glassy domain by concurrent dissolution (linear sorption) and hole-filling mechanisms (nonlinear sorption) (Weber et al. 1992; Xing and Pignatello 1997; Xia and Pignatello 2001; Kriipsalu et al. 2008):
( )
1
( )
1
o n
i i w
p w
i i w
S b C
S S D S H K C
b C =
= + = +
+
∑
where, S(D) is the sorption through dissolution; S(H) is the sorption through hole-filling;
Kp is a lumped partition coefficient of HOCs between aqueous phase and dissolution
regions; Cw is the HOC concentration in water; Sio is the capacity constant for specific
site i; bi is the affinity constant for specific site i. However, because of the number of
parameters in S(H), the above isotherm is rather less practical, despite being more mechanistic. A very common mathematical approach for fitting experimentally determined sorption data using a minimum of adjustable parameters employs an empirical relationship such as the Freundlich isotherm (Weber et al. 1992; Xing and Pignatello 1997; Xia and Pignatello 2001; Kriipsalu et al. 2008):
n
F w
S=K C
where, KF is the Freundlich constant or capacity factor; n is the Freundlich exponent (the
more than two domains with different affinities for PAHs in field-contaminated soils or sediments (Luthy et al. 1997; McLeod et al. 2004; Cornelissen et al. 2005), but it is difficult to quantify the relative contributions of each domain (Luthy et al. 1997) and dual-mode models often describe sorption and desorption data adequately (Allen-King et al. 2002; Accardi-Dey and Gschwend 2003).
Combustion residue particles include coal, kerogen and black carbon (i.e. soot and char). These materials typically make up a small fraction of the soil/sediment total organic carbon. For example, median black carbon contents as a fraction of total organic carbon are 9% for sediments (n=300) and 4% for soils (n=90) (Cornelissen et al. 2005). A fraction of PAHs can be sequestered within the particle matrix as a result of simultaneous production during combustion or coalification (Jonker and Koelmans 2002). More importantly, combustion residue particles contribute greatly to the nonlinearity of sorption for HOCs. They are a very strong sorption phase for HOCs and might dominate the observed overall sorption by soils (Xiao et al. 2004). One reason that PAHs are sorbed strongly to black carbon and other combustion residue particles is because PAHs are planar compounds that fit in the black carbon nanopores (Cornelissen et al. 2004). Sorption of HOCs to these materials generally exceeds sorption of HOCs in amorphous organic matter by a factor of 10-100 (Cornelissen et al. 2005).
association of HOCs with NAPLs (Luthy et al. 1997). Diffusion of the HOCs within the NAPL itself and interfacial mass transfer may be rate-limiting steps for desorption of these compounds to the aqueous phase. Partitioning behavior of PAHs for impacted soils at MGP sites containing weathered pitch particles might be dominated by the sorption to pitch and not by natural organic matter or black carbon (Khalil et al. 2006).
2.3. Bioavailability of PAHs in contaminated soil
The term “bioavailability” has been given a variety of discipline-specific definitions in the literature (Ehlers and Luthy 2003; Semple et al. 2004). Bioavailability of a chemical depends on the physical environment, the biological receptor, and time of exposure (Ehlers and Luthy 2003; Semple et al. 2004). It can be viewed as the individual physical, chemical, and biological interactions that determine the exposure of organisms to chemicals associated with soils and sediments, including sorption/desorption between solid and aqueous phase, transport (both dissolved and particulate-bound) to the membrane of the organism, and uptake through the membrane into a living system where compounds are accumulated or metabolized (Ehlers and Luthy 2003). Thus, for example, the bioavailability of a PAH in a contaminated soil to a microorganism capable of degrading it can be different from the bioavailability of the same chemical in the same soil with respect to dermal uptake by a person.
2.3.1. Bioavailability of toxic and genotoxic agents
microorganisms (Alexander 1995; Alexander and Alexander 1999; Alexander 2000; Reid et al. 2000a; Lei et al. 2004; Jablonowski et al. 2008). Poor correlation has been observed between the total amount of a contaminant determined by vigorous solvent extraction and the compound’s bioavailability to earthworms and bacteria over time in soil (Kelsey and Alexander 1997; Kelsey et al. 1997). Assuming that a contaminant is 100% available will overestimate the health risk of soil contaminated with HOCs (Alexander 2000). Recently, the US Interstate Technology and Regulatory Council (ITRC) advised incorporating bioavailability considerations into the evaluation of contaminated sites to reduce the extent of cleanup required to that which is necessary to be protective of human health and the environment (ITRC 2011).
soil is complicated by the fact that current adsorbent resins work well with only a limited range of chemicals.
In a complex system such as soil, some transformations that do not lead to complete metabolism of the parent compound are inevitable. The net accumulation of products of incomplete metabolism is responsible at least in part for the toxicity observed in studies on bioremediation of field-contaminated soil or sediment. In PAH-contaminated soil undergoing bioremediation, hundreds of hazardous compounds have been identified (Lundstedt et al. 2003) covering a very wide range of physicochemical properties, with logKow values ranging from 2 to 8. Polar and semi-polar metabolites of PAHs have been
observed to accumulate in the soil during bioremediation (Lundstedt et al. 2003). In studies employing bioassay-directed fractionation and analysis of extracts from field-contaminated soil or sediment, genotoxicity has been associated with fractions containing oxy-PAHs or other polar compounds rather than the parent PAHs (Park et al. 2008). But until now, no adsorbent resins have demonstrated the ability to accumulate both parent chemicals and their polar transformation products.
2.3.2. Bioavailability relevant to dermal uptake
Jongeneelen 2001), which represents an integrated measure of multiple processes including desorption from the contaminated matrix to the skin surface, uptake by the skin, transport to the dermal capillaries, metabolism, and excretion. In laboratory experiments, the substance of interest is usually applied to a sample of human or animal skin in a diffusion cell, which contains a receptor fluid beneath the skin to absorb any contaminant that is taken up by and diffuses through the skin sample (Stroo et al. 2000; Roy and Singh 2001; Touraille et al. 2005; Spalt et al. 2009) .
uptake via soil, Shatkin et al (Shatkin et al. 2002) concluded that estimated dermal uptake was lower than if total soil concentrations had been used and that fast desorbing fraction of PAHs dominated dermal uptake of PAHs from soil.
soil (Reifenrath et al. 2008).
contaminated soils or sediments (Shatkin et al. 2002).
2.4. Bioremediation of PAHs in contaminated soil
Bioremediation is an established technology for cleanup of PAH-contaminated soil and sediment (Bamforth and Singleton 2005; USEPA 2007; Elliot et al. 2011). As of 2005, bioremediation was used at 26% of the PAH-contaminated USEPA Superfund cleanup sites, more than any other single remediation technology (USEPA 2007). Bioremediation of PAH-contaminated soils/sediments can be accomplished in both in situ and ex situ remediation. In situ treatments do not require excavation and transport of the soil to a treatment plant or disposal, while ex situ treatments are more amenable to monitoring and control. The main principle of bioremediation is to remove organic pollutants to an innocuous state through metabolism by microorganisms via oxidative or reductive processes under controlled conditions (Mueller et al. 1996). It involves the breakdown of organic compounds through biotransformation into less complex metabolites, and through mineralization into inorganic minerals, i.e. H2O and CO2 or, for anaerobic processes,
CH4.
2.4.1. Microbial metabolism of PAHs
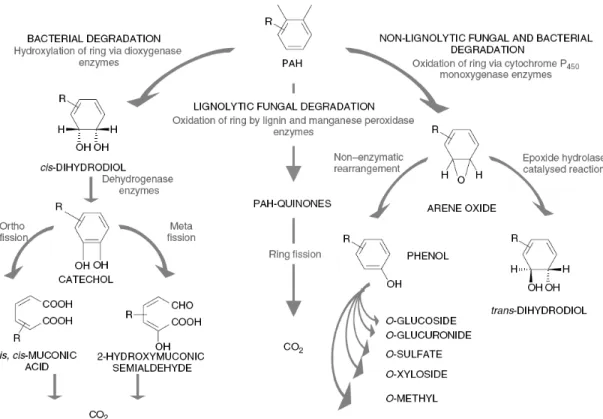
Figure 2.1 Microbial aerobic metabolism of PAHs (from reference (Bamforth and Singleton 2005)).
2.4.1.1. Bacterial metabolism of PAHs
Many bacteria have been documented to use PAHs up to four rings as sole carbon and energy source (Peng et al. 2008). Although bacterial growth on PAHs having five or more rings as sole carbon or energy source has not been documented, co-metabolism of high-molecular-weight (HMW) PAHs has been observed (Moody et al. 2004; Peng et al. 2008). Typically, bacterial metabolism of PAHs is an aerobic process; however anaerobic transformation of PAHs has been observed and is discussed in the Anaerobic Metabolism of PAHs section below.
acenaphthene (Dean-Ross et al. 2001; Pinyakong et al. 2004), and pyrene (Kim et al. 2007). The principal mechanism for the aerobic bacterial metabolism of PAHs is the initial oxidation of the benzene ring by the action of dioxygenase enzymes to form
cis-dihydrodiols. A few bacteria are also capable of oxidizing PAHs by the action of the
cytochrome P450 monooxygenase (two successive reactions) to form trans-dihydrodiols. Then, these dihydrodiols are dehydrogenated to form dihydroxylated intermediates. The dihydroxylated intermediates then can be further metabolized by ring cleavage and further metabolism to tricarboxylic acid (TCA) cycle intermediates, and then further converted to carbon dioxide and water. Complete pathways have not been elucidated for the metabolism of any five- or six-ring PAH.
2.4.1.2. Fungal metabolism of PAHs
Some fungi have been shown to remove PAHs more competently than bacteria. They can degrade low-molecular-weight (LWM) PAHs as well as HMW PAHs, including naphthalene, fluorene, phenanthrene, anthracene, pyrene, benzo[a]anthracene, chrysene, benzo[b]fluoranthene and benzo[k]fluoranthene, benzo[a]pyrene, benzo[g,h,i]perylene, and dibenzothiophene (Cerniglia 1997; Zheng and Obbard 2003). There are two main types of fungal metabolism of PAHs: non-ligninolytic fungal metabolism using cytochrome P450 system and ligninolytic fungal metabolism using the soluble extracellular enzymes such as lignin peroxidase, manganese peroxidase and laccase (Bamforth and Singleton 2005; Peng et al. 2008).
arene oxide is subsequently hydrated via an epoxide-hydrolase-catalyzed reaction to form a trans-dihydrodiol. In addition, phenol derivatives may be produced from arene oxides by the non-enzymatic rearrangement of the compound, which can act as substrates for subsequent sulfation or methylation, or conjugation with glucose, xylose, or glucuronic acid. Most non-ligninolytic fungi are not capable of the complete mineralization of PAHs. The principle mechanism of ligninolytic fungal metabolism of PAHs is generating free radicals (i.e. hydroxyl free radicals) to oxidize PAHs to form PAH-quinones and acids rather than dihydrodiols. The acids produced can be further converted to carbon dioxide and water. Ligninolytic fungi have low substrate specificity and are therefore able to degrade even the most recalcitrant compounds. And also, the enzymes involved are extracellular, and are theoretically able to diffuse into soil/sediment matrix and potentially oxidize PAHs with low bioavailablitity.
2.4.1.3. Anaerobic metabolism of PAHs
It was not until relatively recently that the potential of anaerobic microbial degradation of PAHs has been recognized. In the absence of molecular oxygen, alternative electron acceptors such as nitrate, ferrous iron and sulfate are necessary to oxidize these aromatic compounds (Coates et al. 1996). Recent research has clearly demonstrated that PAH degradation can occur under both nitrate-reducing (Rockne and Strand 1998; Rockne et al. 2000) and sulfate-reducing anaerobic (Coates et al. 1996; Meckenstock et al. 2000; Zhang et al. 2000; Tsai et al. 2009) conditions.
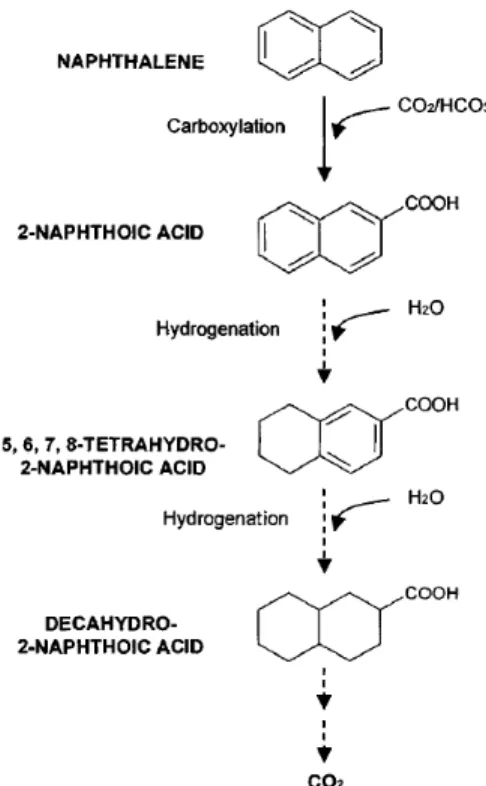
carboxylation of the aromatic ring to 2-naphthoic acid, which may activate the aromatic ring prior to hydrolysis. Stepwise reduction of 2-naphthoic acid via a series of hydrogenation reactions results in decalin-2-carboxylic acid. Decalin-2-carboxylic acid is subsequently converted to decahydro-2-naphthoic acid that is ultimately metabolized to CO2. The exact mechanisms for naphthalene anaerobic degradation have not been
confirmed and it is possible that the initial step under sulfate-reducing conditions occurs via a hydroxylation reaction to form a naphthol intermediate.
Figure 2.2 Proposed pathway for anaerobic metabolism of naphthalene under sulfate-reducing
conditions (from reference (Bamforth and Singleton 2005)). 2.4.2. Incomplete PAH metabolism
of PAHs may have varying kinetic properties and substrate specificities, which can lead to the formation and accumulation of metabolites (products of incomplete metabolism). There are many examples in which PAHs are transformed to non-mineral products that accumulate extracellularly, both in pure or mixed cultures of organisms and in more complex field-contaminated systems. The non-mineral products include metabolites in the known aerobic PAH-metabolic pathways, such as ketones, dihydrodiols and hydroxyl acids (Gibson et al. 1975; Jerina et al. 1984; Mahaffey et al. 1988; Grifoll et al. 1995; Stringfellow and Aitken 1995; Schneider et al. 1996; Kazunga and Aitken 2000; Kazunga et al. 2001; Moody et al. 2004; Jouanneau and Meyer 2006). The non-mineral products also include o-quinones, which are not direct bacterial metabolites of PAHs but the derivatives of the autoxidation of unstable dihydroxy intermediates (Davies and Evans 1964; Laurie and Lloyd-Jones 1999; Kazunga and Aitken 2000; Kazunga et al. 2001; Jouanneau and Meyer 2006).
7H-benz[d,e]anthracene-7-dione (Fernandez et al. 1992; Meyer et al. 1999; Bergknut et al. 2004; Lundstedt et al. 2006), 4H-cyclopenta[d,e,f]phenanthrenone (Fernandez et al. 1992; Lundstedt et al. 2003; Lundstedt et al. 2006; Park et al. 2008), fluoranthene quinone (Fernandez et al. 1992), pyrene quinone (Fernandez et al. 1992), and cis-4,5-pyrene dihydrodiol (Li et al. 1996). The presence of these compounds in field-contaminated soil/sediment that have been contaminated for years indicates that those compounds are either continually produced or are relatively persistent in those contaminated systems (Lundstedt et al. 2007). Some PAH metabolites were observed to accumulate during biological treatment, including 9-fluorenone (Eriksson et al. 2001), phenanthrene-9.10-dione (Eriksson et al. 2001), anthracene-dione (Saponaro et al. 2002), 4H-cyclopenta[d,e,f]phenanthrenone (Eriksson et al. 2001), and ketone products of acenaphthene (Lundstedt et al. 2003). However, in another study (Lundstedt et al. 2003), some PAH metabolites were observed to decline over time during biological treatment, including 9-fluorenone, anthracene-9.10-dione, benz[a]anthracene-7,12-dione, 7H-benz[d,e]anthracene-7-dione and 4H-cyclopenta[d,e,f]phenanthrenone. Transient accumulation and subsequent removal of PAH metabolites has also been observed in uncontaminated soils spiked with PAH mixtures (Wischmann and Steinhart 1997; Meyer and Steinhart 2001). These PAH metabolites can inhibit the metabolism of other PAHs (Kazunga and Aitken 2000; Kazunga et al. 2001; Juhasz et al. 2002; Holt et al. 2005), and some exhibit toxic and/or genotoxic effects (Fernandez et al. 1992; Grifoll et al. 1995; Traczewska 2000; Machala et al. 2001; Zielinska-Park et al. 2004; Pagnout et al. 2006).
2.5. Genotoxicity of PAH-contaminated soil
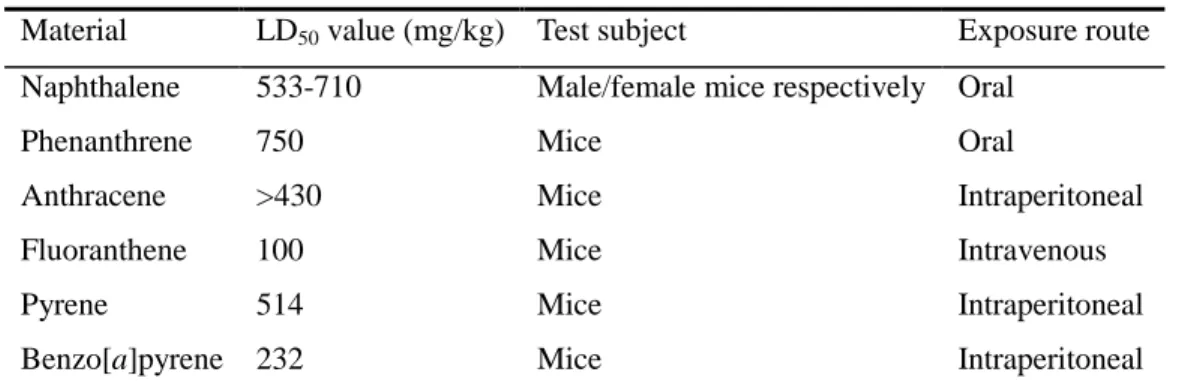
British surgeon Sir Percival Pott demonstrated a correlation between the exposure of chimney sweeps to soot and the incidence of scrotal cancer in 1775 (Baird et al. 2005). Parent PAHs are thought to act by narcosis as the mode of toxic action (Sverdrup et al. 2002). They do not bind to specific receptors within an organism but partition and accumulate in the lipid bilayer to affect the fluidity and function of cell membranes (Sverdrup et al. 2002). This alteration of membranes can influence the energy transduction across membranes as well as the activity of membrane-embedded proteins in order to elicit toxicity (Sikkema et al. 1995). The LD50 values of some representative
parent PAHs are shown in Table 2.2. However, due to their low water solubility and high
logKOC, PAHs in the environment are seldom present in concentrations high enough to
directly cause acute toxicity. They exert deleterious effects when they are metabolized to oxygenated intermediates (Cerniglia et al. 1983; Swanson et al. 1986; Narro et al. 1992; McConkey et al. 1997; Bertilsson and Widenfalk 2002) which can also cause DNA damage (Xue and Warshawsky 2005).
Table 2.2 LD50 values of some representative PAHs a
Material LD50 value (mg/kg) Test subject Exposure route
Naphthalene 533-710 Male/female mice respectively Oral
Phenanthrene 750 Mice Oral
Anthracene >430 Mice Intraperitoneal
Fluoranthene 100 Mice Intravenous
Pyrene 514 Mice Intraperitoneal
Benzo[a]pyrene 232 Mice Intraperitoneal
a
data taken from the Risk Assessment Information System (RAIS) http://risk.lsd.ornl.gov (Bamforth and Singleton 2005).
2.5.1. DNA damage caused by PAHs
metabolic activation to exert their genotoxic/mutagenic/carcinogenic effects through biochemically reactive electrophilic metabolites (Miller and Miller 1966; Miller 1978). Metabolically activated PAHs can cause direct DNA adduction by covalent binding to form stable or depurinating adducts and indirect DNA damage by oxidative stress through the formation of active metabolites (Xue and Warshawsky 2005). There are three principal pathways currently proposed for metabolic activation of PAHs: 1) bay region dihydrodiol epoxide pathway by cytochrome P450 enzymes; 2) radical cation pathway by one-electron oxidation; and 3) o-quinone pathway by dihydrodiol dehydrogenase (Xue and Warshawsky 2005).
The bay region dihydrodiol epoxides pathway involves three enzyme-mediated reactions (Harvey 1991; Baird et al. 2005): 1) oxidation of a double bond catalyzed by P450 enzymes to unstable arene oxides; 2) hydrolysis of the arene oxides by microsomal epoxide hydrolase to trans-dihydrodiols; 3) oxidation of the double bond adjacent to the diol function to a vicinal diol-epoxide by P450 enzymes. The bay or fjord region diol-epoxides produced via this pathway are electrophiles capable of covalently binding to DNA to form bulky DNA adducts (Broyde et al. 2011). The major adducts have been found to result from bonding between the benzylic carbon of the epoxide and the exocyclic amino groups of dGuo and dAdo residues in the DNA (Broyde et al. 2011). Minor covalent dCyd adducts by alkylation at exocyclic amino N4 and ring imino N3 positions have also been found (Wolfe et al. 2004).
extremely reactive electrophiles in nature and they are capable of binding with nucleophilic centers in DNA (Cavalieri and Rogan 1995) at the N7 and C8 position of guanine bases and the N7 or N3 positions of adenine bases (Rogan et al. 1993). However, DNA adducts formed through PAH radical cations are unstable, leading to spontaneous depurination in addition to some stable adducts. These unstable DNA adducts arise primarily from binding at the N7 position of guanine bases and the N7 or N3 positions of adenine bases, where the glycosidic bond is cleaved to lose the deoxyribose moiety of DNA (Xue and Warshawsky 2005). Spontaneous depurination of adducts would result in formation of apurinic (AP) sites as the major type of DNA damage (Devanesan et al. 1992; Chakravarti et al. 1995).
ROS such as hydroxyl radical can also cause DNA strand scission and illegitimate recombination through formation of base propenals.
Although the principal mechanisms of DNA damage caused by PAHs have been studied, the toxicity/genotoxicity knowledge of each individual PAH is still incomplete. This is further complicated by the fact that PAHs occur in complex mixtures in the environment, such as contaminated soil (White 2002). Contaminated soil may contain hundreds of compounds, many of which individually may or may not exhibit toxic/genotoxic potential. These compounds in a mixture may compete for receptors or metabolizing enzymes, leading to additive, synergistic or antagonistic effects.
2.5.2. Effects of bioremediation on genotoxicity of PAH-contaminated soil
that may accumulate, such as oxy-PAHs, which exhibit greater toxicity than their parent PAHs (Alexander et al. 2002; Andersson et al. 2003; Lundstedt et al. 2003; Lundstedt et al. 2007; Lemieux et al. 2009). These parent compounds and their metabolites all contribute to the total risk of the contaminated site. However, it is not practicable to monitor hundreds of these compounds during the bioremediation process. More importantly, identities of many hazardous compounds in PAH-contaminated sites are rarely known and their concentrations cannot be monitored. Third, chemical-analysis-based risk assessment assumes that the toxicity of a mixture is simply the sum of the expected effects from each mixture component (USEPA 2004b). It doesn’t account for the possible synergistic or antagonistic interactions between mixture components (White 2002; Park et al. 2008).
somewhat cyclical nature of the genotoxicity may suggest the formation, and subsequent degradation, of genotoxic compounds, and longer periods of bioremediation may be required to significantly reduce the genotoxic hazard of a contaminated soil (Lemieux et al. 2009). The sources of genotoxicity either caused by or remaining after bioremediation have not been elucidated, and the extent to which toxicity is transient has not been studied extensively.
2.6. DT40 genotoxicity bioassay
2004). It is a sensitive technique for the detection of DNA damage at the level of the individual eukaryotic cell. However, it is limited to a small range of detectable DNA injuries.
Besides all the genotoxicity bioassays mentioned above, a novel bioassay using DNA-repair-deficient chicken DT40 B-lymphocyte cell lines for measuring the genotoxicity of PAH-contaminated soil before and after bioremediation has been proposed (Knight 2009; Ridpath et al. 2011). The DT40 genotoxicity bioassay is a reverse genetic approach, which has high specificity and sensitivity. Unlike most other assays, DT40 genotoxicity bioassay can also provide information on mechanisms of genotoxicity of a given sample (Ji et al. 2009; Ridpath et al. 2011).
2.6.1. Reverse genetic approach for genotoxicity test
be replicated, the cell cycle does not proceed, and it will finally lead to cellular suicide. The main principle of the reverse genetic approach for genotoxicity testing is that a certain DNA repair pathway is knocked out. Then the mutant deficient in that specific DNA repair pathway is exposed to a genotoxic agent. If cell death is observed, the DNA damage caused by that genotoxic agent is not repaired in that mutant. As a result, it can be concluded that the DNA repair pathway that has been knocked out in that mutant is involved in the repair of DNA damage caused by that genotoxic agent. Since each individual repair pathway processes a distinct set of the DNA lesion type, differential cytotoxicity as a function of which DNA repair pathway has been knocked out would provide insight into the type(s) of genotoxicity induced (Sonoda et al. 2006; Ji et al. 2009; Evans et al. 2010).
2.6.2. Advantages of DT40 cell lines in genotoxicity test
3. DESORPTION OF POLYCYCLIC AROMATIC HYDROCARONBS FROM FIELD-CONTAMINATED SOIL TO A TWO-DIMENSIONAL
HYDROPHOBIC SURFACE BEFORE AND AFTER BIOREMEDIATION1
3.1. Introduction
Polycyclic aromatic hydrocarbons (PAHs) are of great concern because of their known or suspected genotoxicity, mutagenicity and carcinogenicity (Santodonato 1997; Bostrom et al. 2002a). Dermal exposure can represent a significant health risk in settings involving potential contact with complex materials containing PAHs, including PAH-contaminated soil or sediment (Boffetta et al. 1997; Sobus et al. 2009). Most previous work has been concerned with integrated uptake of chemicals through the skin and not with how a contaminant reaches the skin surface in the first place. However, only a contaminant that reaches the skin surface is available for dermal absorption (Roy et al. 1998; Shatkin et al. 2002). Desorption properties, such as dynamic conditions by which soil contacts the skin, interactions of the soil with the skin surface and chemical interaction with the soil, have been identified to influence dermal uptake of chemicals (McKone and Howd 1992; Spalt et al. 2009). Therefore, it is important to understand desorption of PAHs from contaminated soil or sediment to the skin surface.
To account for the association of hydrophobic contaminants such as PAHs with compartments of varying sorptive strength in soil (Alexander 1995; Xing and Pignatello 1997; Cornelissen et al. 2005), a so-called two-compartment desorption model assumes a
1
simplified situation in which a fraction of the contaminant is released relatively rapidly and the remainder is released relatively slowly (Cornelissen et al. 1998; Hawthorne et al. 2001; Zhu et al. 2008). By incorporating two-compartment desorption kinetics into a fugacity model, Shatkin et al. (2002) illustrated that a greater rapid-desorbing fraction of a chemical would result in greater dermal uptake. In most previous experimental work on dermal uptake of contaminants from soil, an individual contaminant was introduced into the soil through a solvent that subsequently evaporated (Spalt et al. 2009). However, exposure to a spiked chemical does not account for the effect of contaminant aging that would have occurred in field-contaminated soil (Roy et al. 1998; Stroo et al. 2000; Spalt et al. 2009), which is well known to decrease its bioavailability (Alexander 2000).
The objective of this study was to evaluate desorption of PAHs from field-contaminated soil from a former MGP site to a two-dimensional hydrophobic surface (EmporeTM C18 extraction disk) as a measure of potential dermal exposure. Various factors affecting desorption were investigated, including soil loading, temperature, soil moisture content (SMC), and exposure time. We also compared desorption to the C18 disk to a conventional method of evaluating potential contaminant bioavailability in soil, desorption to Tenax beads in a well-mixed aqueous slurry (Loehr et al. 2003). The efficacy of bioremediation (in a slurry-phase bioreactor) in removing the most readily desorbable PAH fractions was evaluated with both methods.
3.2. Materials and methods 3.2.1. Materials
4 °C prior to use. The total organic matter fraction (foc) was 0.16 (dry mass basis, wt/wt),
SMC was 2.0% (wt/wt), field capacity was 40% (wt/wt), and soil particle density was 2.57 g/cm3 (methods are identified in Table A.1). The total concentration of 14 target PAHs (the 16 priority PAHs, excluding acenaphthylene and indeno[1,2,3-cd]pyrene) was 780 ± 10 mg/kg (dry mass basis, wt/wt; individual PAH concentrations are shown in Table A.2); the most abundant PAHs were phenanthrene (PHE, 322 ± 5.1 mg/kg) and pyrene (PYR, 121 ± 0.05 mg/kg). Soil samples were mixed with de-ionized water to reach desired SMC levels prior to desorption experiments. Treated soil was the slurry from a continuously stirred, semi-continuous (draw and fill), laboratory-scale aerobic bioreactor (Zhu et al. 2008) treating the source soil. The treated soil had a total PAH concentration of 121 ± 8 mg/kg (individual PAH concentrations are shown in Table A.2).
EmporeTM C18 extraction disks (25 mm diameter, 0.5 mm thickness) were obtained from 3M (St. Paul, MN, U.S.A.) and cleaned by acetone extraction overnight and air-dried before use. Tenax® TA beads (60/80 mesh) were purchased from Alltech (Deerfield, IL, U.S.A.) and cleaned by Soxhlet extraction in acetone: hexane (50:50, v/v) mixture overnight and air-dried before use. PAH standards (EPA 610 PAHs Mixture) were obtained from Sigma-Aldrich (St. Louis, MO, U.S.A.). Anthracene-D10 was obtained from Cambridge Isotope Laboratories (Andover, MA, U.S.A.). Solvents were high-pressure liquid chromatography (HPLC) grade and were obtained from Fisher Scientific (Pittsburgh, PA, U.S.A.).
et al. 2003), in that both C18 extraction disks and Tenax beads serve as an infinite sink; however, we believe that the C18 disk is more relevant to the application of soil to skin in a dermal exposure scenario.
3.2.2. Desorption experiments
shown in Table A.4), calculated by comparing the initial PAH mass in the soil with the PAH mass desorbed to the C18 disk and the PAH mass remaining in the soil after desorption.
Desorption of PAHs from soil to Tenax beads was carried out at 20 °C. Approximately 3 g of soil (dry wt.) and 0.2 g Tenax beads were suspended in 20 mL phosphate buffer (pH 7.5) amended with 4.15 g/L NaN3 in a 30-mL glass serum vial with
a PTFE-lined septum and screw cap. The vials were placed on a wrist-action shaker at 240 rpm in the dark. After 1, 2, 4, 8 and 16 d, the vials were centrifuged at 3500 rpm for 15 min, Tenax beads were removed from the vials for subsequent extraction as described by Zhu et al. (2008), and the supernatant was discarded. For all but the 16-d time point, 20 mL fresh medium was added along with 0.2 g fresh Tenax beads into the vials. The mass recovery of Tenax beads over all time points was 97 ± 2%. Total PAH recovery was 92 ± 10% for combined experiments with source soil and treated soil (individual PAH recoveries are in Table A.4).
3.2.3. PAH extraction and analysis
dichloromethane as described elsewhere (Zhu et al. 2008). All extracts were analyzed by HPLC (Zhu et al. 2008).
3.2.4. Data analysis
SPSS® (v16.0, SPSS Inc.) was applied for data analysis. One-way ANOVA followed by Tukey’s test was employed to test for differences among multiple groups. The maximum soil loading required to provide monolayer coverage was estimated according to Equation 3.1 (Duff and Kissel 1996) assuming solid spherical soil particles and face-centered packing:
(
3)
(
)
2
/ 6
/ 6
particle
monolayer particle
d
SL d
d
ρ
π
ρ
π
= = (3.1)
where SLmonolayer is the soil loading representing a monolayer (mg/cm2); ρparticle is the soil
particle density (g/cm3); d is the soil particle diameter (µm). Desorption kinetics data were evaluated with the commonly used two-compartment kinetic model, Equation 3.2 (Cornelissen et al. 1998; Hawthorne et al. 2001; Zhu et al. 2008):
0 0
1 k tr k ts t
r s
S S
f e f e
S
− −
− = − −
(3.2)
where S0 is the initial soil concentration of a given PAH (µg/g); St is the soil concentration
at time t (µg/g); fr and fs are the fractions of the PAH that desorb rapidly and slowly,
respectively; kr and ks are the rate constants for rapid and slow desorption, respectively
(d-1); and t is the desorption time (d). All model parameters with their standard errors and coefficients of determination were determined using nonlinear regression.
3.3. Results
According to Equation 3.1, the maximum soil loading required to provide monolayer coverage was estimated as no more than 34 mg/cm2 with soil particle density of 2.57 g/cm3 and soil particle diameter less than 250 µm (soil was sieved through 250 µm mesh). It is obvious from Figure 3.1 that the total PAH mass desorbed to the C18 disk kept increasing at soil loadings well above the estimated monolayer coverage.
0 20 40 60 80 100 120 Soil loading, mg/cm2
0 10 20 30 40 50 M as s d es o rb ed , µ g (
•
) 0 10 20 30 40 50 P er ce n t d es o rb ed ( ο )Figure 3.1 Total PAHs desorbed from source soil to C18 extraction disks as a function of soil loading.
Soil moisture content was 2%, temperature 20 ºC and contact time 6 d. Dashed vertical lines indicate the estimated maximum monolayer coverage of 34 mg/cm2.
not approach the sorption capacity of the C18 disk (Table A.3).
Increased desorption of PAHs to the C18 disk at soil loadings well above monolayer coverage suggested that PAHs were transferred to the disk by mechanisms other than direct soil contact. Accordingly, with a fixed soil loading above monolayer coverage (40 mg/cm2), we evaluated the extent to which placing a barrier to direct contact between the soil and the disk would affect desorption. The desorption of PAHs from soil to the C18 disk still occurred even with a dry or moist glass microfiber filter placed between the hydrophobic surface and the soil (Figure 3.2). For NAP, ACE and FLU, there were no significant differences between desorption with a dry or a moist filter and that without a filter. However, for PHN, ANT, FLA and PYR, desorption from the soil to the C18 disk was significantly lower with a dry or a moist filter than without a filter; in addition, desorption was significantly lower in the presence of a moist filter than in the presence of a dry filter. Desorption in the presence of two dry or two moist filters was only slightly less than in the presence of only one dry or one moist filter for all PAHs (data not shown). No PAH was detected in the dry or moist filter that was not in direct contact with the soil, suggesting that PAHs were not sorbed by the filters.
NAP ACE FLU PHN ANT FLA PYR 0 20 40 60 80 100 P er ce n t d es o rb ed w/o filter
with dry filter
with moist filter
a a a
aa a a a a a b c a b c a b c a b c
Figure 3.2 Desorption of PAHs to C18 disks from source soil with or without a glass microfiber filter
The desorption of all PAHs to the C18 disk with a fixed soil loading well above monolayer coverage (50 mg/cm2) was substantially reduced at an SMC of 40%, which corresponded to approximate field capacity of the soil (Figure 3.3). Desorption of total PAHs from soil at an SMC of 40% was only one-third of that at an SMC of 2%. For NAP, ACE, FLU and PHN, there were no significant differences between desorption from soil at SMC from 2% to 20%. For ANT, FLA and PYR, there was no significant difference between desorption from soil at SMC of 2% and 8%; at an SMC of 20% there was a statistically significant, but modest, decrease in desorption.
NAP ACE FLU PHN ANT FLA PYR 0 20 40 60 80 100 P er ce n t d es o rb ed 2% 8% 20% 40%
a a a
b a a a b aa a
b a a a
b a ab
c a a
b
c a ab c
Figure 3.3 Effect of SMC on desorption of PAHs to C18 disks from source soil. Soil loading was 50
mg/cm2, temperature 20 °C, contact time 6 d. Desorption was less than 2% for BaA, CHR, BbF, BkF, BaP, DBA and BgP under all four conditions. Same letter is assigned to conditions where difference was not significant (p > 0.05).
bioreactor removed the fraction of each PAH that was capable of desorbing to the C18 disk. The percentage desorption of all PAHs from biologically treated soil to Tenax beads was much lower than that from the source soil, reinforcing that the most bioavailable fractions of the PAHs had been removed by biological treatment.
NAP ACE FLU PHN ANT FLA PYR BaA CHR BbF BkF BaP DBA BgP 0
20 40 60 80 100
P
er
ce
n
t
d
es
o
rb
ed
SS-Tenax SS-C18 TS-Tenax
BaA CHR BbF BkF BaP DBA BgP 0.1
1 10
Figure 3.4 Desorption of individual PAHs from source soil to Tenax beads (SS-Tenax) or to C18 disks
(SS-C18) or from biologically treated soil to Tenax beads (TS-Tenax). The inset enlarges the results for higher molecular weight PAHs. All measurements were at 20 ºC at a 16-d contact time. For desorption to C18 disks, soil moisture content was 2% and soil loading 50 mg/cm2. Desorption to C18 disks from biologically treated soil was not detectable.
Desorption kinetics of each individual PAH from source soil to both C18 disks and Tenax beads were described well by the commonly used two-compartment kinetic model (Equation 3.2), as illustrated in Figure A.3. Fitted parameter values are summarized in Table A.5. The rapidly desorbing fraction (fr) for desorption from the source soil to Tenax
beads was higher than that for desorption to the C18 disk. For desorption of PAHs from the biologically treated soil to Tenax beads, fr was not significantly different from 0 for
any PAH. The rate constant for the slowly desorbing fraction (ks) for biologically treated
soil was lower than that for source soil in the Tenax-bead system.
3.4. Discussion
The increasing mass of PAH desorbed at soil loadings beyond monolayer coverage demonstrated that not only the contaminants in a monolayer of soil particles in direct contact with the hydrophobic surface were desorbed. One explanation for this result is the depletion of PAHs in the soil, thus establishing concentration gradients away from the surface (Bunge and Parks 1998). Since the soil was unstirred, the concentration of a desorbable chemical in the soil will depend on the distance from the hydrophobic surface. As chemicals in soil layers closer to the hydrophobic surface become depleted, the concentration gradient provides a larger driving force for chemicals in upper soil layers to diffuse toward the hydrophobic surface. However, it is difficult to experimentally confirm concentration gradients through the soil depth.
from soil solids to the hydrophobic surface by direct contact. Transport by mechanisms other than direct contact was most significant for the lower-molecular weight PAHs (NAP, ACE, and FLU; Figure 3.2) that also have the highest vapor pressures (summarized in Table A.6). Although soil moisture contents below field capacity had a limited effect on PAH desorption from the soil, the significant reduction of PAH desorption to the C18 disk at SMC corresponding to field capacity (Figure 3.3) also suggests that PAH diffusion in pore air was a predominant mechanism of transport to the C18 disk.
Besides soil loading configuration, other site-specific properties may also influence desorption of PAHs from soil to a two-dimensional hydrophobic surface. Temperature is one of these factors, as diffusion coefficients are positively correlated with temperature (Schwarzenbach et al. 2003). We observed inconsistent effects of temperature on desorption to the C18 disks. For several compounds (ACE, FLU, and ANT), the effect of temperature was limited (Figure A.2). For the remaining compounds (NAP, PHN, FLA, and PYR), the effect of temperature on desorption was substantial (Figure A.2). Several other investigators have also observed a positive relation between temperatures and desorption of semi-volatile compounds from soil to air (Hippelein and McLachlan 2000; He et al. 2009). Overall, the effect of temperature in our work would not be easy to predict, as temperature affects not only the soil-air partitioning equilibrium and PAH diffusivity, but the PAH-C18 sorption equilibrium as well; these effects of temperature could be counter-acting for a given PAH.
seemed to eliminate the most readily desorbable fraction of all PAHs (Figure 3.4). Similar decreases in the rapidly desorbed fractions of PAHs after bioremediation have also been observed in previous research (Cornelissen et al. 1998; Hawthorne et al. 2001; Richardson and Aitken 2011). For the treated soil, no PAH desorption to C18 disks was observed, and there was no rapidly desorbing fraction in the slurry-based Tenax bead desorption system. It therefore appeared that biological treatment eliminated the PAHs that could desorb to a two-dimensional surface, and thus might substantially decrease the dermal bioavailability of PAHs in contaminated soil.
4. EVALUATING THE EFFECTS OF BIOREMEDIAITON ON GENOTOXICITY OF POLYCYCLIC AROMATIC
HYDROCARON-CONTAMINATED SOIL USING GENETICALLY ENGINEERED, HIGHER EUKARYOTIC CELL LINES2
4.1. Introduction
Polycyclic aromatic hydrocarbons (PAHs) are of human health concern due to their known or suspected genotoxic, mutagenic, or carcinogenic effects (White 2002; Xue and Warshawsky 2005), and they are a major pollutant class at thousands of contaminated sites in the U.S.A. (USEPA 2004a). Bioremediation is an established technology for cleanup of PAH-contaminated soils and sediments (USEPA 2007), but like most remedial technologies it is typically evaluated based on the removal of target pollutants. U.S.A. Environmental Protection Agency (USEPA) guidelines for risk assessments of PAH-contaminated soil generally focus only on 16 priority-pollutant PAHs (USEPA 2000). However, in most cases it remains unknown whether the removal of the regulated PAHs during bioremediation corresponds to a reduction in health risk (Lemieux et al. 2009). Significant amounts of other carcinogenic polyaromatic compounds, such as dibenzo[a,l]pyrene, are also found in PAH-contaminated soils (Lundstedt et al. 2003; Lemieux et al. 2008; Lemieux et al. 2009), and whether all hazardous compounds degrade concomitantly with the 16 priority PAHs monitored at contaminated sites is unknown (Lundstedt et al. 2003). Incomplete metabolism of PAHs in contaminated soil
2