Electrical Engineering Department
California Polytechnic State UniversityStability Analysis of Systems with Time Delay
Simulation Program
Senior Project Report
June 8, 2020Brandon Replogle
Matthew Carroll
Table of Contents
Abstract______________________________________________________________________4
Chapter 1. Introduction__________________________________________________________5
Chapter 2. Literature review______________________________________________________7
Chapter 3. Background_________________________________________________________12
Chapter 4. Approach and Simulation Results________________________________________14
Chapter 5. Conclusions and Future Work___________________________________________31
References___________________________________________________________________32
Appendix A - Analysis of Senior Project Design_____________________________________33
Appendix B - Scripts___________________________________________________________36
Appendix B.1 - Custom Simulink Blocks__________________________________________36
Appendix B.2 - Parameter Plane Calculations_______________________________________41
Appendix B.3 - Nonlinearity Plotting______________________________________________44
Appendix B.4 - Variable Expansion by Hand_______________________________________45
Appendix B.5 - Sigma/Omega Expansion__________________________________________46
Appendix B.6 - Multiple Delays__________________________________________________49
Appendix B.7 - Parameter Points of Interest ________________________________________54
Appendix B.8 - Parameter Plane Testing___________________________________________58
List of Tables
List of Figures
Abstract:
A small company wants to develop a CAD tool, ideally as part of the MATLAB suite of tools, for system stability analysis of nonlinear control systems with time-delay. The program must allow the designer to input the system block diagram graphically, then using symbolic expansion, automatically generate the Laplace domain stability boundary and disturbance settling time. The stable regions are then to be graphically plotted as a set of 2- or 3-dimensional parametric stability boundaries. The designer can then input performance constraints on the system through the MATLAB console and a Simulink environment will automatically be generated.
Chapter 1: Introduction
The Stability Analysis of Systems with Time Delay Simulation Program is a MATLAB Simulink extension CAD tool designed to simulate the stability of a system with time delays based on an algorithm designed by Jay Karmarkar. The project deals with delayed control system subject matter which is discussed in detail in Min, W., Yong, H. and Jin-Hua, S.’s book ”Stability Analysis and Robust Control of Time-Delay Systems”. This book discusses the stability of systems with time-varying delay just like the simulation program is meant to do. Examples of how to design a MATLAB Simulink program as the project intends can be found in Halicioglu’s journal article “Modelling and Simulation Based on Matlab/Simulink: A Press Mechanism”.
The intent of the simulation program is to promote Dr. Karmarkar’s algorithm over other methods of analysing systems with time delay. The intention of this project is to create an easy to use program that will appeal to system designers that shows the step by step process of Dr. Karmarkar’s algorithm and how they can be used to create graphical visualization of the 2D/3D stability boundaries. These 2D/3D boundaries would allow any designer to choose a point in the 2D/3D space based on not only stability but criteria such as settling time and peak overshoot then apply this point into simulink to verify the performance of the selected design point. The designer can then determine whether or not this point meets their specifications and if not they can re-evaluate the design volume.
Time delay adds a level of complexity to the understanding of control systems, especially when performing hand calculations. Time delays in control systems take the form of e -sT, any form of non-linearity in an equation can make it difficult to keep track of by hand. As a result, creating a program to automatically generate transient output waveforms and stability boundaries can save someone a significant amount of time from doing the calculations by hand.
This simulation program would be helpful when designing multi-input multi-output (MIMO) systems with time delay, particularly in systems with multiple feedback paths. Such systems exist in the realms of the aerospace industry to transmission lines, which currently are able to solve these problems, but not as efficiently as desired. With this program they could see their systems stability criterion and use it to enhance the performance of their system with minimal effort.
This program is able to generate a Simulink environment solely from user inputs to the MATLAB console. The user inputs system variables such as the number of blocks, number of delays, block parameters and block connections and the script automatically generates the corresponding Simulink workspace. There are several constraints to the functionality of this aspect of the project that will be discussed in greater length later in the paper. The addition of this to the project allows for a much easier user experience and removes the need for the user to understand MATLAB, they simply have to understand the control system they want to simulate.
The intent for the program is to allow for user access to the process that occurs to promote Dr. Karmarkar’s algorithm. This means that after the process is all done, there should be some way for the user to pull up the completed algorithm with their input parameters so they can see the process if they are interested. The process itself is made to plot parameter planes, so the displayed algorithm would show the steps taken but not all the results as they might be very large matrices that are almost impossible to read. MATLAB allows for variables to be declared and displayed as symbols in functions before being defined. Before being solved, the functions will be saved with symbols and allow them to be displayed later if the user wants to see how the algorithm works.
Chapter 2: Literature Review
Chapter 2 summarizes and analyzes key sources that were helpful during this project. Each of the sources below provided key insights into the various aspects of this project. As a result, these sources enabled the project to be finished within the time constraints of the senior project.
1. Non-Linear Modeling and PID Control of Twin Rotor MIMO Stability [1]
This paper focuses on PID control tuning for a nonlinear multi-input multi-output system. It puts no emphasis on the time delay aspect of our project, but it does serve as an effective resource for modelling in simulink. Furthermore, it discusses strategies and methods for reducing errors that arise when modelling control systems with simulink. Figure 2.1 below shows the simulink internal control structure of cross-coupled PID controller from the paper. This sample model and resulting plots generated has served as a good starting point for our model. The error reduction aspect of the paper can be seen in Figure 2.2 on the next page. Figure 2.2 shows two of the output plots generated from the simulink model in Figure 2.1. Adjusting the internal parameters of the simulink blocks and how the input parameters are handled allowed the designers to reduce noise in the sinusoid and more closely follow the base signal. This paper was helpful in assisting with generating clean parameter planes in the project.
Figure 2.2: Noisy vs. Error Corrected Sinusoids Generated Through Simulink Model[1]
2. Stability Analysis of Systems with Time Delay [2]
This source is one of the papers published by the project's sponsor, Dr. Karmamkar. In this paper Dr. Karmarkar discusses his model for measuring stability criterion for systems with time delay is given in the parameter plane. This paper is particularly applicable for us as it covers several key aspects of the project such as alpha-beta parameter plot planes (Figure 2.3) and constant-ω curves (Figure 2.4) for a given system model. The constant-ω curves are derived from a feedback system characterized by an alpha-beta parameter based feedback system. One of the first major tasks for this project was generating the alpha-beta parameter plane and this was an invaluable resource in that regard.
Figure 2.5: Alpha-Beta Region of Stability[2] Figure 2.6: Multiple-Delay System [2]
Additionally, this paper covers plotting the region of stability for a multiple-delay system (Figure 2.6). One of the goals Dr. Karmarkar set for us was to automatically generate and measure this region for a given input. The region of stability in relation to alpha-beta parameters can be seen in Figure 2.5 on the previous page. One area of this paper that will require further research outside of Dr. Karmarkar’s work is the underlying theory of Pontryagin's stability theory. Pontryagin's theorem serves as the basis for this paper and a deeper understanding of it will help. Having easy access to all of the papers written by Dr. Karmarkar that are relevant to our project allows us to gain a deeper understanding of the algorithm behind our project. Several of the figures above have been recreated later in this paper using our MATLAB program to verify the project is working.
3. The Analysis of Control Systems with Distributed Lag [3]
This source from S. K. Mukherjee is an expansion upon Dr. Karmarkar’s original time-delayed control system model. He references Dr. Karmarkar’s work several times throughout the paper. According to Dr. Mulherjee, the best way to represent system lag, defined mathematically as “-sqrt(sT)”, is through approximating the systems transfer function. This approximated transfer function can then be used to predict the stability of a system. One point that could be particularly interesting for our project is when he goes over the stability region of non-alpha-beta based systems. Particularly, when he discusses the stability plot derived from a transfer function with the form: [K - exp (-sTc)]. After some variable manipulation and analysis this results in the closed form expression: kT c = |cos(p)−1−j sin(p) . This equation when plotted as a function of
* |
p exp(* √(p/2)(T p/T c)
Figure 2.7: Stability Plot for Varying TP/TC [3]
4. Mathematical Methods in Nuclear Reactor Dynamics [4]
As mentioned in the second source reviewed in this report, it is critical to gain a better understanding of Pontryagin's stability criteria. Unfortunately, most of his works are in Russian and it was difficult to find a translation of such papers. This textbook from the 70’s covers the various criteria for meeting stability when the Routh-Hurwitz criteria fails to hold. The polynomials discussed in this section apply to nuclear reactor systems so they are not directly related to this project. However, the principle behind the mathematics would be useful in understanding Pontryagin's stability criteria. For the purpose of this analysis suppose there is a characteristic equation of the form h(z,e z) = 0 where h(x,y) is a polynomial in x,y. Additionally,
assume h(z,w) is an arbitrary polynomial in z,w for which h(z,e z) = ∑r z w . Before
m=0
∑s
n=0
amn m n
going into the theorems behind Ponytryagin’s stability criteria the idea of “principal term” should be explained. For the above polynomial, arszrwsis the principal term of the polynomial if a =rs / 0.
Pontryagin’s stability criteria can be broken down into three main theorems:
1. If the general form arbitrary polynomial h has no principal term, or to say that all zeros , then h(z, ez) = 0 has an unbounded number of zeros with arbitrarily large positive real part, and hence the system is unstable
2. Let the polynomial h have a principal term and define the real functions F(y) and G(y) by where y is a real number.
(jy, ) F(y) G(y)
h ejy ≡ +j
3. All the roots of the characteristic equation h(s, e s ) = 0 have negative real parts if h has a principal term, and if, in addition, one of the following conditions is satisfied:
a. All the zeros of the functions F(y) and G(y) are real, alternating, and the
b. All zeros y 0of F(y) are real and the inequality: holds for every zero y0.
c. All zeros y 0 of G(y) are real and the inequality: holds for every zero y0.
5. Building [Simulink] Models with MATLAB Code [5]
This source focuses on generating Simulink models directly from MATLAB code and scripts. It was one of the only resources available relating to this topic and was a good starting point in the transition to this aspect of the project. This post walks the user through a step-by-step process of creating a simple four block system in Simulink that integrates a sinusoid and displays the output on a scope. Figures 2.8 and 2.9 below show the final Simulink environment generated along with the simulated scope output it created.
Figure 2.8: Sample Simulink Environment Generated Through MATLAB Code [5]
Chapter 3: Background
Chapter 3 discusses the relevant background information to this project. This contains both an analysis of the theory behind Dr. Karmarkar’s control systems theory and an excerpt on the tools used to create the project.
This simulation is based on three papers by Dr. Karmarkar; Stability Analysis of Systems with Time Delay[2], Stability Analysis of Systems with Distributed Delays [7],andGraphical Stability Criterion for Linear Systems[8]. These papers describe Dr. Karmarkar's algorithm on how to interpret Polytryaign’s stability criterion for systems with time delay given the system’s parameter plane.
Pontryagin’s criterion states that a vector field is orbitally topologically stable if and only if; all singular points of the vector field are hyperbolic, all periodic orbits of the vector field are hyperbolic, and there exist no saddle connections. This criterion can then be extended to systems with distributed delay utilizing Brin’s criterion, where in order for a transfer function in the form E(z)/F(z) (where F(z) is a polynomial of the order of n) to be stable it is necessary and sufficient that as the real parameter ⍴ in the vector W = F(⍴e jπ/4) increases from zero to infinity that the vector completes n/8 revolutions around W = 0 in the counterclockwise direction.
Pontryagin’s criterion lacks the ability to be scaled into design problems as problems arise when it comes to analyzing stability of varying system parameters. If you were to split Pontryagin's characteristic equation into its real and imaginary parts and graph them separately while examining the intersection points of the parametric graphs, the properties of stability can be observed. Using Mitrovic’s class of characteristic polynomials, a parameter plane can be created on which Pontryagin’s results can be plotted and interpreted to determine a stability region for the system.
For systems with time delay modeled by a polynomial F(S) which can be represented as F(j⍵) = R(⍵) + jI(⍵), it is necessary and sufficient for F(j⍵) to revolve continually in the positive direction with positive velocity and all the zeros of both R(⍵) and I(⍵) to be both real and alternating. If this is met the system can be directly applied to the Mikhailov criterion to linear systems with time delay. This criterion allows us to create a parameter plane in which F(S) = F1(S) + 𝛼S + 𝛽 = 0. Substituting s = -σ + j⍵, F(j⍵) =R(⍵) + jI(⍵) + 𝛼j⍵ +𝛽= 0 can be solved for 𝛼 and 𝛽 to get 𝛼 = - I(⍵) and1 𝛽 = R(⍵) +𝛼σ. Once the plane is plotted, a region of stability can
⍵
The algorithm simulation program is run through MATLAB® and Simulink. MATLAB® is a programming environment with a language developed for iterative analysis and design processes using matrix and array mathematics. MATLAB includes a large function library and toolboxes that make the complex computing of the algorithm tolerable for the program such as the control systems toolbox, the system identification toolbox, and functions such as the fast fourier transform. MATLAB is also equipped with a graphics system which includes two-dimensional and three dimensional data visualization, image processing, animation and presentation graphics. This is extremely helpful in the case of this simulation program where it is desired to graph the stability boundaries in two-dimensional and three dimensional space. The simulation program also uses MATLAB’s graphics system for the graphical user interface with fully customizable graphics and ties easily into the code.
Chapter 4: Approach, Simulations, and Results
Chapter 4 documents the progress made on this project over the course of the year. It begins with basics, such as creating custom Simulink blocks and some initial failed attempts at recreating the plots from Dr. Karmarkar’s paper, but eventually shows each of the successful simulations and the parts of the program used.
Simulink:
The initial plan to implement the simulation program in Simulink was to have the program use a custom block that creates the transfer function of the Pontryagin’s criterion as seen in figure 4.1 below. The designer would input values for gamma and delta in the GUI and alpha and beta, the variable bounds of the parameter plane, would be auto generated.
Figure 4.1: Transfer Function Parameter Block
Plot Generation:
The project’s focus is on generating both 2-D and 3-D parameter planes. Early on it was unclear how to generate the alpha-beta parameter planes seen in Figure 2.3. The beginning attempts at this have mostly been proof of concept plots for overlapping stability planes. Figure 4.2 below shows one such attempt. A refined version of this code could be adapted to show the curves of constant-ω from Figure 2.4 in the literature review section.
Figure 4.2: Constant-ω Proof of Concept
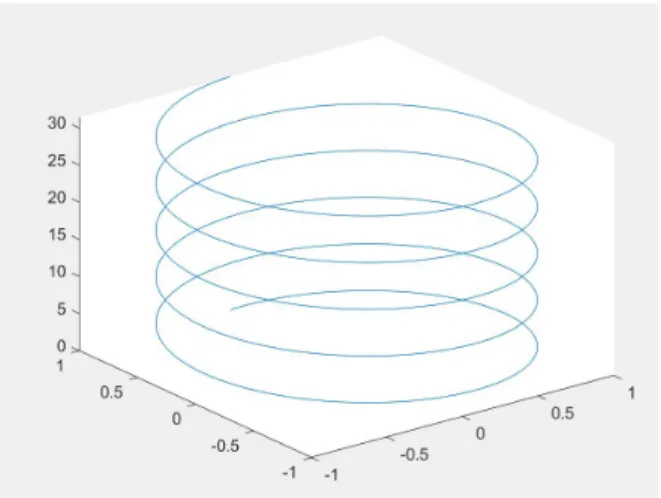
Furthermore, there was an issue that arose in the plot3() function where it would open a new plot window for each point plotted. This issue was fixed by limiting the number of points generated to a finite amount. If the window is closed before plotting is complete additional windows will open, but if the user waits until after the program is finished then it will not open additional windows. As a demo of its capability, a helix seen below was plotted using the plot3() function as it is a better demo of the capabilities of the function.
In the paper, Stability Analysis of Systems with Time Delay [2] by Dr.Karmarkar, investigation of the zeros of a transcendental characteristic polynomial is essential for stability analysis of the system. The paper considers a class of transcendental polynomials that can be represented in the form:
(s) (s) αs β 0
F ≡F1 + + =
Where F1(s) is the transcendental polynomial and and are variable parameters that thisα β program will be attempting to plot as the parameter plane. By substituting s= jωwe obtain:
(jω) (ω) + I (ω) αjω β 0
F ≡R1 1 + + =
Where: F1(s) = R1(ω) + I1(ω)
From this equation the project takes the transcendental polynomial and splits it into its real and imaginary parts to solve for and , they can be pulled from the original equation byα β
substituting s= σ − jω and splitting the equation into its real and imaginary parts and α β become :
,
I (ω) α = − 1
ω 1 β = R1(ω) + α σ
The stability of the system can be investigated directly as a function of these variable parameters, all the parameter values that result in system stability are obtained by observing intersections in the parameter plane.
In the early stages of this project, simulation of Dr. Karmarkar's algorithm was getting close, but still producing some errors. The problem was the program had no way of dealing with sigma, therefore plotted omega and sigma both as arrays from 0.01-100 in steps of 0.01, sigma matching omega. This incorrect way of dealing with sigma produced the plot seen below in figure 4.4.
Dr. Karmarkar’s example that was the program attempted to recreate here had used σ = 0 and as examples so when using this value of it was able to start to get a circular plot as .2
σ = 0 σ
desired, however, something was still off. As seen below in figures 4.5 and 4.6, when σ is 0, the plot is crossing zero multiple times and is not to be expected. There were also lots of oscillations around the origin that were unexpected and the zero crossings occur each time a new oscillation starts.
Figure 4.5: Sigma = 0, Algorithm not matched Figure 4.6: Enhanced view of figure 4.5
To check this answer, a worked example provided by Dr. Karmarkar was hardcoded into the command window and got the figures 4.7 and 4.8 shown below.
Figure 4.9: Example Reference plot for Sigma = 0 (same as figure 2.3) [2]
This example is the same one from Dr. Karmarkar’s paper which consists of the characteristic equation:
(s) (s 2s )e F1 = 3 + 2+s s
And when solving for the parameter plane takes on the form:
(s) 2s )e αs β 0
F ≡ (s3+ 2+s s + + =
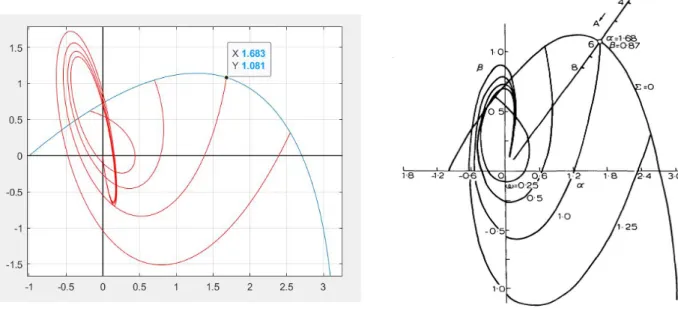
Figure 4.10: Simulation Replication of Example Figure 4.11: Contant-ω Curves of a System (Same as Figure 2.4) [2]
The only thing this plot is missing is the nonlinearity saturation describing function seen in Figure 4.11 as the line with a descending A parameter. This A is crucial in determining the parameters that are employed in stabilizing the system. MATLAB has a predefined call for producing describing functions, so the program will use this in a function with the gain saturation as a parameter to create the describing function. For the given example, the gain saturation was 4, so after calling the function with an input of 4 the program achieves figure 4.12 below, matching the describing function.
The describing function is correct for a saturation gain of 4, an amplitude of 6 would yield a value of 0.781 which when divided by alpha and beta at the omega equals one point gives alpha as 1.68/0.781 = 2.15 and beta 1.081/0.781 = 1.41. The values are verified in figures 4.13 and 4.14 on the next page. The saturation-nonlinearity hasn’t been implemented into the program however because there is a lack of understanding on how to implement the describing function across the parameter plane.
Now that the program was able to plot the parameter plane, the code outputs the points where the constant omega curves intersect. For the low values of omega, these intersections tend to lie in the stability region.
The program now viable for singular delay, the next step was to compute the stability region for multi-delay systems. The equation for multi-delay is similar in that the characteristic equation can be described as:
(s) (s) F (s) αs β 0
F ≡F1 + 2 + + =
The example from the paper shown simulated here has the characteristic equation of:
(s) e 2s e αjω β 0
F ≡s3 T s1 + 2 (T1−T2)s+ + =
Where T1 = 2 and T2 = 1.
Figure 4.13: Simulation Replication of Figure 2.5 Figure 4.14: Alpha-Beta Region of Stability with constant omega curves (Same as Figure 2.5) [2]
3-D Plot Generation:
There has been less of an emphasis put on the 3-D aspect of this project than the 2-D plotting as the goal was mainly to get the simpler plots correct before shifting focus to the extra parts Dr. Karmarkar has requested. Most of the work with 3-D plots has come from proof-of-concept plots such as those seen below.
Figure 4.15: Planar Slice of complex figure
Figure 4.16: 3D Plot with Z-Dep Color Map
Simulink Plot Generation:
Another key aspect of this project was proving the time domain plots of a system are “correct”. In Dr. Karmarkar’s papers he provides only one example of a time domain output waveform in his paper “Stability Analysis of Systems with Time Delay”. This sample and an attempt at recreating it graphically in SimuLink can be seen in Figures 4.17 and 4.18 below.
Figure 4.17: Plot From Stability Analysis Figure 4.18: SimuLink Replication of Figure 4.17 of Systems with Time Delay [2]
As can be seen from the plots the issues were accurately generating the initial condition of ~4. When attempting to apply an initial condition to this system it’s value is not stored past the first data point. Further work required was later done to resolve this issue. Despite missing this initial condition the stability of the system is still tentatively verified as it is bounded on similar rails as Dr. Karmarkar’s.
Figure 4.19: SimuLink Model and Paper Model [2]
Figure 4.20: Simulated Waveform of Figure 4.20
Simulink Generation from MATLAB Scripts:
Another key component of this project is the ability to generate Simulink blocks directly from a MATLAB script. This would remove the time consuming task of manually placing each block, adjusting the parameters and connecting the lines. The key components of each code block can be found in the Appendix. The waveform below in Figure 4.22 is an identical copy of figure 4.18, thus demonstrating that the script properly generates Simulink blocks.
Figure 4.21: Script Generated Version of Figure 4.19
Figure 4.22: Script Copy of Figure 4.19
The figures below show another script recreation of a previously manually generated Simulink block. The block diagram seen in Figure 4.19 before is recreated in Figure 4.23 below. Additionally, the output waveform in Figure 4.24 matches with the prior results from Figure 4.20. This along with the previous example illustrate that the scripts are generating the same environments as manually placed objects.
Figure 4.23: Script Generation of Figure 4.19
Figure 4.24: Script Recreation of Figure 4.20
User Defined Custom Simulink Environment Generation
With this adjustment to the program, the user no longer has to write any lines of code when generating the Simulink environment. The script is entirely generated through user inputs into the MATLAB console. The script will ask the user questions such as the number of blocks in the system, the number of delays, system parameters, and the individual connections between blocks. Figure 4.25 below shows the console log user to generate the block diagram seen in Figure 4.26 on the next page.
Figure 4.26: Simulink Blocks and Parameters Entered From Console
There are some limitations to this system, the total number of blocks is limited to 10. Additionally, there is a limit to the type of block that can be placed in the system as the Simulink library names do not always correspond to their respective blocks. Finally, there is no way to correct a user error when entering blocks and parameters. The user must terminate the script and restart the process.
The addition of this functionality to the project helps to streamline the user experience. They no longer have to have an understanding of writing MATLAB scripts or generating Simulink blocks.
To further demonstrate the functionality of this script, the block diagram from Figure 4.19 was generated. This system has 9 blocks, and multiple feedback paths leading to the summing junction. The recreation can be seen in Figure 4.27 below, with the console log from generating the block in Figure 4.28.
Custom MATLAB GUI:
To make the program a bit more user-friendly, the parameter plane process is controlled through a MATLAB .mlapp GUI. This GUI has two modes, one for single delay systems and one for multi-delay systems. The reworking of Dr. Karmarkar’s paper examples in the GUI are shown in figures 4.29 and 4.30 below. The GUI instructs the operator to specify the time delay and the characteristic equation in the typical MATLAB form [0, 0, 0] and displays the plot of the parameter plane and a table of the likely points of stability.
Chapter 5: Conclusions and Future Work
This project was a success in generating the parameter planes described in Dr. Karmarkar’s paper Stability analysis of systems with time delay [2] and has created a simple method for generating the simulink blocks for analysis of control systems with time delay. This has greatly increased the efficiency of analysis as an operator can, using only their control system’s characteristic polynomial, plot the parameter plane of stability and receive the most likely points of stability. Using these points they can input them into the block generation and receive a simulink model of their stabilized system.
From testing based on Stability analysis of systems with time delay [2], the program is able to generate the plots described by Dr. Karmarkar and receive the same points. The calculation of these points can be very tedious by hand and just the expansion can be difficult, as seen in the hand variable expansion in the appendix, can get extremely tedious even with just fourth order polynomials. This program will make it simpler for the future of stability analysis of control systems as the difficult math is now done behind the scenes and these plots can be calculated in minutes with the points of interest returned without needing to iterate the plot. The generation of system blocks is also done in the same process, this allows the operator to generate and test these points of stability immediately all within the same program.
The majority of this project went into attempting to understand the algorithm in question and then translate that into inputs and outputs of a program. Once there was a deeper understanding of the algorithm, simulating it was still a task, but able to be achieved through trial and error. There was a large learning curve to both aspects of this project, having to understand the MATLAB simulink models and how the software deals with transfer functions. Something like the characteristic equation of the system with time delay is difficult to work with in matlab because combining two transfer functions, one containing time delay, creates a state space and does not allow for the same functionality to be used as transfer functions. This was a problem when dealing with systems with multiple-delay, the two delayed polynomials cannot be combined without creating a state space and makes the code for creating the parameter plane unusable. This required a work around of computing the polynomials individually in the code and so on.
References:
[1] Ramalakshmi, A. (2020). Non-linear modeling and PID control of twin rotor MIMO system - IEEE Conference Publication. [online] Ieeexplore.ieee.org. Available at: https://ieeexplore.ieee.org/abstract/document/6320804 [Accessed 3 Feb. 2020].
[2] Karmarkar, J. (2020). Stability analysis of systems with time delay - IET Journals & Magazine. [online] Ieeexplore.ieee.org. Available at:
https://ieeexplore.ieee.org/document/5248665 [Accessed 4 Oct. 2019].
[3] Mukherjee, S. (2020). The Analysis of Control Systems with Distributed Lag - IEEE Journals & Magazine. [online] Ieeexplore.ieee.org. Available at:
https://ieeexplore.ieee.org/document/4159529 [Accessed 7 Feb. 2020].
[4] Akcasu, Z., Lellouche, G. and Shotkin, L. (1971). Mathematical methods in nuclear reactor dynamics. New York: Academic Press.
[5] “Building Models with MATLAB Code,” MathWorks, 21-Jan-2010. [Online]. Available:
https://blogs.mathworks.com/simulink/2010/01/21/building-models-with-matlab-code/. [Accessed: 06-Apr-2020].
[6] D. K. Anand, “Introduction to Control Systems,” Google Books. [Online]. Available: https://books.google.com/books?id=A93-BAAAQBAJ&pg=PA431&lpg=PA431&dq= Pastel+control+systems&source=bl&ots=SBvzwDi-wi&sig=ACfU3U0fCT1tnBSsTdL zH9j8cpZZe-ad7w&hl=en&sa=X&ved=2ahUKEwiZj9TFronpAhUOqJ4KHSr7D98Q6 AEwDnoECBgQAQ#v=onepage&q&f=false
[7] Karmarkar, Jay. (1970). Stability analysis of systems with distributed delay. Electrical Engineers, Proceedings of the Institution of. 117. 1425 - 1429. 10.1049/piee.1970.0271.
Appendix A — ANALYSIS OF SENIOR PROJECT DESIGN
Project Title: Stability Analysis of Systems with Time Delay Simulation Program
Student’s Name/Signature: Brandon Replogle: Brandon Replogle Matthew Carroll:MJCarroll
Advisor’s Name/Initials/Date:
• Summary of Functional Requirement
The simulation program for stability analysis of control systems with time delay takes an operator's input
characteristic equation polynomial for the time delayed control system of interest and plots the parameter
plane’s region of stability. This region of stability intersects with constant omega curves and displays
likely points of stability for the values of Omega = 0.5, 0.75, 1, and 1.25. These parameters displayed can
then be used for simulink block generation where the overall system can be analyzed for whether or not
stability has been achieved.
• Primary Constraints
One major constraint of this project was understanding how Dr. Karmarkar’s base algorithm worked.
Fortunately, we were able to email Dr. Karmarkar throughout the quarter for feedback and guidance.
For the simulink side of the project, the script to create the simulink environment from user inputs was a
challenge due to how customizable the simulink layouts can be. As a result, options were created for each
block to be placed in each of the ten block locations. This led to the script becoming fairly bloated.
Additionally, the connections between blocks can be completely customizable so the script has to account
for single connections, multiple connections, and port specific connections to summing junctions.
Another constraint comes from the lack of Simulink documentation. The name of certain blocks in
Simulink differs from the name that generates the block in MATLAB. This became an issue when trying
to generate the Simulink block “Saturation” that can only be called in MATLAB as “Saturate.” This fix
was discovered by sheer chance as there are few examples of generating Simulink blocks from MATLAB
commands. Furthermore, Simulink uses the return character, “ ” to indicate a space in the name of a
block. When calling the block the return character is ignored and the two words are joined together.
For generation of parameter planes, the main constraint was working with MATLAB transfer function
types, as adding delay limits how you can work with them. When attempting to create a characteristic
equation with transfer functions with time delay, adding two together creates a state space type which
cannot be used in most of the functions required for this project. The workaround was to never add
anything when they were in transfer function form, this requires multiple inputs for systems with multiple
delay as their individual polynomials cannot be added in transfer function form and had to be broken apart
• Economic
This project doesn’t pose a large economic impact. If the customer has MATLAB the simulation program
is essentially free. Being code, the project has no manufacturing cost and the only environmental
resources are used to produce the electricity necessary to power the computer running the program. The
only input the project requires is MATLAB, for students at Cal Poly this is included in tuition, for
non-students who want to use this simulation program they would be required to pay for a license. There
are no operation costs for this product and should continue to work through MATLAB updates. The
product doesn’t earn revenue for anyone, it is to be designed for the sole purpose of promoting the
algorithm.
Table 1: Cost Estimate - Stability Analysis of Systems with Time Delay Simulation Program
Expense Cost
MATLAB Perpetual License: $2,150
Annual License: $860
Student License: Included with tuition
Labor Estimated Completion Time: 120 hours
Minimum Wage: $4200 (estimated $35/hr) Student Labor: Free
Total Cost (fixed cost + n ×variable costunit ) Non-Student: $2,150 + 120*$35 = $6,350 Student: $0
• If manufactured on a commercial basis:
The product can’t truly be manufactured, but if taken into account that anyone who buys a
MATLAB license. This would make the annual cost of the product $860 and can currently be used in
5000 colleges and universities with over 3 million users that would have possible access.There would
only be profit for MATLAB and the cost for users is only the license they already pay for, so no
additional cost. • Environmental
The only environmental impact this product produces is the pollution created in the secondhand
generation of electricity to run the program. The project itself doesn’t directly use any natural resources or
ecosystem services and therefore doesn’t improve or harm them. The control systems that the user is
simulating would be in effect whether or not they used this simulation product so the environmental
impact they could possibly produce is not at the discretion of this project.
• Manufacturability
As the project is a simulation program, it cannot be manufactured. The only issue involved in this
section would be copyright and intellectual property involved in creating the program. The program is an
extension of MATLAB, so this is unlikely.
• Sustainability
Since this project is based in MATLAB the only issue with maintaining the project will come
from ensuring the models work as newer versions of the project are released. The main resource used in
this project comes in the form of the electricity required to power the computer running the simulation.
complete the sim in a reasonable timeframe. The main area we’ll be able to upgrade this project is by making our simulation and code more efficient.
• Ethical
As with most other categories here, some of the IEEE code of ethics do not easily apply to our
project. The second point in the IEEE code of ethics states, “to avoid real or perceived conflicts of
interest whenever possible, and to disclose them to affected parties when they do exist”. This could
potentially come into play if our model of the control system our client wants us to create is similar to the
Simulink model of another system. Since our project does not require any monetary claims, rather only
time based claims it should be reasonably easy to stay on track and deliver to our client on time. Point 6
states, “to maintain and improve our technical competence and to undertake technological tasks for others
only if qualified by training or experience, or after full disclosure of pertinent limitations.” Having taken
several classes with Professor McKell we are both proficient in MATLAB and Simulink that we will be
able to complete the project within the specified timeframe. The final point that directly applies to our
project is point 9, “avoid injuring others, their property, reputation, or employment by false or malicious
action.” Since we are creating a simulation model for someone else’s algorithm it is our responsibility to
have that model be as good a representation as possible. Basing this off of the ethical framework, “Is it
legal” our project does not have any ethical implications.
• Health and Safety
The two main health issues that could arise from the use of this project are both related to the use
of a computer when running simulations. It’s possible that someone could develop issues with their eyes
from prolonged time using a screen. The oth er issue could come from the health complications that can
arise from sitting in a chair for too long while they work with the tool.
• Social and Political
The main stakeholder of this project is our client. It benefits him since he will gain a means of
automatically simulating his control systems algorithm. Since there is no money going into this project
the stakeholder only benefits from it. Since this is a control system simulation model for a client it does
not have much social or political impact.
• Development
In order to properly proceed with the development and analysis of this project we will need to
further our understanding of control system theory and learn the proper development techniques for
Simulink. Without that foundation our project will not be able to meet the standards set by our client.
Additionally, We will need to work with our client to develop a criteria for evaluating the accuracy or our
Appendix B - Scripts
Appendix B.1 - Custom Simulink Blocks
Simulink Block Code first attempt: Abandoned as alpha and beta need to be solved for function y = fcn(u)
% Author: Brandon Replogle
% This function serves to take the blocks of the simulink diagram (u) % and plot them on the parameter plane alpha vs beta, where alpha and % beta are variable, gamma and delta are user defined simulink parameters % returns y = u* (alpha.*s + beta)/((s^2) + gamma.*s + delta)
% Create variables alpha and beta, an arbitrary range of 0-100 is given % with steps of 0.1
alpha = (0:0.1:100); beta = (0:0.1:100);
% Pull user defined parameters Gamma and Delta from block mask gamma = 'Gamma';
delta = 'Delta';
% Create the block transfer function
% (alpha.*s + beta)/((s^2) + gamma.*s + delta)
Simulink Block Code second attempt:
function[Alpha, Beta] = Plane_parameters(Polynomial) % Author: Brandon Replogle
% This function serves to create the alpha and beta parameters of the % parameter plane using the user input polynomial
% Define laplace domain special variable s s = tf('s');
% Find the order and coefficients of the polynomial to be used in expansion ord = order(Polynomial);
coefs = tfdata(Polynomial, 'v');
% Define symbolic omega and sigma as real-valued syms omega real;
syms sig real;
% Define an empty array for expanding the polynomial Exp_Poly = [];
% Symbolically expand the polynomial for p = (1:1:ord)
Exp_Poly = horzcat(Exp_Poly, (coefs(p).*Expand(p, sig, omega))); end
% Add in time delay still using s = -sigma + j*omega %Delay_Poly = Exp_Poly.*(exp(-sig+1i*omega));
Delay_Poly = Exp_Poly.*((cos(omega).*exp(-sig))+1i.*(sin(omega).*exp(-sig)));
% Split the polynomial into its real and imaginary parts Sym_Poly_real = real(Delay_Poly);
Sym_Poly_imag = imag(Delay_Poly);
% Solve for Alpha and Beta symbolically AlphaSym = (-1/omega).*Sym_Poly_imag; BetaSym = Sym_Poly_real + sig.*AlphaSym;
sig = 0;
%sig = sigma(omega,s);
% Substitute real values into symbolic Alpha and Beta Alpha = subs(AlphaSym);
Simulink Block Code third attempt (final):
function[Alpha, Beta] = Plane_parameters(Polynomial) % Author: Brandon Replogle
% This function serves to create the alpha and beta parameters of the % parameter plane using the user input polynomial
% test case polynomial
% Polynomial = tf([1 2 1 0],[1],'InputDelay',1)
% Find the order and coefficients of the polynomial to be used in expansion ord = order(Polynomial)-1;
coefs = tfdata(Polynomial, 'v');
% Define symbolic omega and sigma as real-valued syms omega real;
syms sig real;
% Define an empty array for expanding the polynomial syms Exp_Poly real;
Exp_Poly = 0;
% Symbolically expand the polynomial for p = (1:1:ord)
Exp_Poly = Exp_Poly + (coefs(ord-p+1).*Expand(p, sig, omega)); end
Exp_Poly = Exp_Poly + coefs(ord+1);
% Add in time delay still using s = -sigma + j*omega Delay = Polynomial.InputDelay;
Delay_Poly = Exp_Poly.*(exp(Delay*(-sig+1i*omega)));
% Split the polynomial into its real and imaginary parts Sym_Poly_real = real(Delay_Poly);
Sym_Poly_imag = imag(Delay_Poly);
% Give omega and sigma real values omega = (0.001:0.001:10);
sig = 0;
% Substitute real values into symbolic Alpha and Beta Alpha = double(subs(AlphaSym));
Beta =-double(subs(BetaSym));
Appendix B.2 - Parameter Plane Calculations
Alpha-Beta Parameter Plane Constant Omega Curve: function[Alpha, Beta] = Const_Omega(Polynomial, Omega) % Author: Brandon Replogle
% This function serves to create the constant omega curves of the % parameter plane
% Find the order and coefficients of the polynomial to be used in expansion ord = order(Polynomial)-1;
coefs = tfdata(Polynomial, 'v');
% Define symbolic omega and sigma as real-valued syms omega real;
syms sig real;
% Define an empty array for expanding the polynomial syms Exp_Poly real;
Exp_Poly = 0;
% Symbolically expand the polynomial for p = (1:1:ord)
Exp_Poly = Exp_Poly + (coefs(ord-p+1).*Expand(p, sig, omega)); end
Exp_Poly = Exp_Poly + coefs(ord+1);
% Add in time delay still using s = -sigma + j*omega Delay = Polynomial.InputDelay;
Delay_Poly = Exp_Poly.*(exp(Delay*(-sig+1i*omega)));
% Split the polynomial into its real and imaginary parts Sym_Poly_real = real(Delay_Poly);
Sym_Poly_imag = imag(Delay_Poly);
% Solve for Alpha and Beta symbolically AlphaSym = (-1/omega).*Sym_Poly_imag; BetaSym = Sym_Poly_real + sig.*AlphaSym;
omega = Omega; sig = (0:0.001:9.999);
% Substitute real values into symbolic Alpha and Beta Alpha = double(subs(AlphaSym));
Alpha-Beta Parameter Plane With Constant Omega Curves Plot: function[] = Plot_Parameter_Plane(Polynomial, Alpha, Beta)
% Author: Brandon Replogle
% This function serves to plot the alpha and beta parameters as a % parameter plane and superimpose the constant omega curves
figure(1)
plot(Alpha, Beta) xlim([-5 5]) ylim([-5 5]) grid on
line([0,0], ylim, 'Color', 'k', 'LineWidth', 1); % Draw line for Y axis. line(xlim, [0,0], 'Color', 'k', 'LineWidth', 1); % Draw line for X axis. hold on
[A5,B5] = Const_Omega(Polynomial, 0.5); plot(A5, B5, 'Color', 'r', 'LineWidth', 0.5) hold on
[A75,B75] = Const_Omega(Polynomial, 0.75); plot(A75, B75, 'Color', 'r', 'LineWidth', 0.5) hold on
[A1,B1] = Const_Omega(Polynomial, 1); plot(A1, B1, 'Color', 'r', 'LineWidth', 0.5) hold on
[A125,B125] = Const_Omega(Polynomial, 1.25); plot(A125, B125, 'Color', 'r', 'LineWidth', 0.5)
[Alpha5, Omega5] = parameter_points(Polynomial,0.5,0); [Alpha75, Omega75] = parameter_points(Polynomial,0.75,0); [Alpha1, Omega1] = parameter_points(Polynomial,1,0);
[Alpha125, Omega125] = parameter_points(Polynomial,1.25,0);
Point5=[Alpha5, Omega5] Point75=[Alpha75, Omega75] Point1=[Alpha1, Omega1]
Appendix B.3 - Nonlinearity Plotting Saturation Nonlinearity Plot
function[] = saturation_nonlinearity(Amplitude) % Author: Brandon Replogle
% This function creates the describing function for gain saturation- % nonlinearities where the input Amplitude is the saturation gain limits
% Create a range of amplitudes with 100 points between them A = linspace(Amplitude,Amplitude+6);
% Create the describing function N_A = saturationDF(Amplitude./A); % Plot the describing function plot(A, N_A);
Appendix B.4 - Variable Expansion by Hand Hand Variable Expansion:
Appendix B.5 - Sigma/Omega Expansion
S = -Sigma + jOmega Expansion lookup table code first attempt: (hand calculated, some values were wrong and matlab can do these evaluations on its own, making this a waste) function [Sp] = Expansion(exp, sig, W)
% Author: Brandon Replogle
% This function serves as a look-up table for expansion of % s = -sigma + j(omega) to the power (exp)
% Parameters are exp = order of expansion % sig = value(s) of sigma % W = value(s) of omega
% Returns Sp: the expansion of s = -sigma + j(omega) to the power (exp)
% For (-sigma + j(omega))^0, return 1 if (exp == 0)
Sp = 1;
% For (-sigma + j(omega))^1, return (-sigma + j(omega)) elseif (exp == 1)
Sp = (-sig + 1i*W);
% Return expansion of (-sigma + j(omega))^2 elseif (exp == 2)
Sp = ((sig^2) - 2i.*sig.*W - W^2);
% Return expansion of (-sigma + j(omega))^3 elseif (exp == 3)
Sp = ((-sig^3) + 3.*sig.*(W^2) + 3i.*(sig^2)*W - 1i.*(W^3));
% Return expansion of (-sigma + j(omega))^4 elseif (exp == 4)
Sp = ((sig^4) - 6.*(sig^2).*(W^2) - 4i.*(-sig^3).*W + (W^4));
% Return expansion of (-sigma + j(omega))^5 elseif (exp == 5)
Sp = ((-sig^5) + 10.*(sig^3).*(W^2) - 8.*sig.*(W^4) + 5i.*(sig^4).*W... -10i.*(sig^2).*(W^3) + 1i.*(W^5));
Sp = ((sig^6) - 15.*(sig^4).*(W^2) + 18.*(sig^2).*(W^4) - 6i.*(sig^5).*W... + 20i.*(sig^3).*(W^3) - 9i.*sig.*(W^5) - W^6);
% Return expansion of (-sigma + j(omega))^7 elseif (exp == 7)
Sp = (-(sig^7) + 21.*(sig^5).*(W^2) - 38.*(sig^3).*(W^4) + 10.*sig.*(W^6)... + 7i.*(sig^6).*W - 35i.*(sig^4).*(W^3) + 27i.*(sig^2).*(W^5) - 1i.*(W^7));
% Return expansion of (-sigma + j(omega))^8
% Return expansion of (-sigma + j(omega))^9
% Return expansion of (-sigma + j(omega))^10
S = -Sigma + jOmega Expansion code second attempt: function [Sp] = Expand(exp, sig, omega)
% Author: Brandon Replogle
% This function serves as a look-up table for expansion of % s = -sigma + j(omega) to the power (exp)
% Parameters are exp = order of expansion % sig = value(s) of sigma
% omega = value(s) of omega
% Returns Sp: the expansion of s = -sigma + j(omega) to the power (exp)
Appendix B.6 - Multiple Delays Code for Multiple-Delay generation
function[Alpha, Beta] = Mult_Delay_Plane_parameters(Polynomial1,Polynomial2) % Author: Brandon Replogle
% This function serves to create the alpha and beta parameters of the % parameter plane using two user input polynomials for systems with % multiple-delays
% test case polynomial
% Polynomial1 = tf([1 0 0 0],[1],'InputDelay',2) % Polynomial2 = tf([2 0 0],[1],'InputDelay',1)
% Test that T1 > T2
Delay1 = Polynomial1.InputDelay; Delay2 = Polynomial2.InputDelay; if Delay2 > Delay1
Alpha = 0; Beta = 0; else
% Find the order and coefficients of the polynomial to be used in expansion ord1 = order(Polynomial1)-1;
coefs1 = tfdata(Polynomial1, 'v'); ord2 = order(Polynomial2)-1; coefs2 = tfdata(Polynomial2, 'v');
% Define symbolic omega and sigma as real-valued syms omega real;
syms sig real;
% Define an empty array for expanding the polynomial syms Exp_Poly1 real;
Exp_Poly1 = 0; syms Exp_Poly2 real; Exp_Poly2 = 0;
% Symbolically expand the polynomial for p = (1:1:ord1)
Exp_Poly1 = Exp_Poly1 + (coefs1(ord1-p+1).*Expand(p, sig, omega)); end
Exp_Poly1 = Exp_Poly1 + (coefs1(ord1+1));
% Symbolically expand the polynomial for z = (1:1:ord2)
Exp_Poly2 = Exp_Poly2 + (coefs2(ord2-z+1).*Expand(z, sig, omega)); end
Exp_Poly2 = Exp_Poly2 + (coefs2(ord2+1));
% Add in time delay still using s = -sigma + j*omega
Delay_Poly1 = Exp_Poly1.*(exp(Delay1*(-sig+1i*omega)));
%Delay_Poly = (Delay_Poly1*Exp_Poly2).*(exp(Delay2*(-sig+1i*omega))) Delay_Poly2 = Exp_Poly2.*(exp((Delay1-Delay2)*(-sig+1i*omega)));
% Combine delayed polynomials
Delay_Poly = (Delay_Poly1 + Delay_Poly2);
% Split the polynomial into its real and imaginary parts Sym_Poly_real = real(Delay_Poly);
Sym_Poly_imag = imag(Delay_Poly);
% Solve for Alpha and Beta symbolically AlphaSym = (-1/omega).*Sym_Poly_imag; BetaSym = Sym_Poly_real + sig.*AlphaSym;
% Give omega and sigma real values omega = (0.001:0.001:10);
sig = 0;
% Substitute real values into symbolic Alpha and Beta Alpha = double(subs(AlphaSym));
Beta = -double(subs(BetaSym));
Multiple Delay Omega Curves
function[Alpha, Beta] = MD_Const_Omega(Polynomial1,Polynomial2 , Omega) % Author: Brandon Replogle
% This function serves to create the constant omega curves of the % parameter plane
Delay1 = Polynomial1.InputDelay; Delay2 = Polynomial2.InputDelay;
% Find the order and coefficients of the polynomial to be used in expansion ord1 = order(Polynomial1)-1;
coefs1 = tfdata(Polynomial1, 'v'); ord2 = order(Polynomial2)-1; coefs2 = tfdata(Polynomial2, 'v');
% Define symbolic omega and sigma as real-valued syms omega real;
syms sig real;
% Define an empty array for expanding the polynomial syms Exp_Poly1 real;
Exp_Poly1 = 0; syms Exp_Poly2 real; Exp_Poly2 = 0;
%Exp_Poly1 = (-sig + 1i.*omega)^3; %Exp_Poly2 = 2.*(-sig + 1i.*omega)^2;
% Symbolically expand the polynomial for p = (1:1:ord1)
Exp_Poly1 = Exp_Poly1 + (coefs1(ord1-p+1).*Expand(p, sig, omega)); end
% Symbolically expand the polynomial for z = (1:1:ord2)
Exp_Poly2 = Exp_Poly2 + (coefs2(ord2-z+1).*Expand(z, sig, omega)); end
Delay_Poly1 = Exp_Poly1.*(exp(Delay1*(-sig+1i*omega)));
%Delay_Poly = (Delay_Poly1*Exp_Poly2).*(exp(Delay2*(-sig+1i*omega))) Delay_Poly2 = Exp_Poly2.*(exp((Delay1-Delay2)*(-sig+1i*omega)));
% Combine delayed polynomials
Delay_Poly = (Delay_Poly1 + Delay_Poly2);
% Split the polynomial into its real and imaginary parts Sym_Poly_real = real(Delay_Poly);
Sym_Poly_imag = imag(Delay_Poly);
% Solve for Alpha and Beta symbolically AlphaSym = (-1/omega).*Sym_Poly_imag; BetaSym = Sym_Poly_real + sig.*AlphaSym;
% Give omega and sigma real values omega = Omega;
sig = (0:0.001:9.999);
% Substitute real values into symbolic Alpha and Beta Alpha = double(subs(AlphaSym));
Multiple Delay Plot with Omega Curves
function[] = Plot_MDParameter_Plane(Polynomial1,Polynomial2, Alpha, Beta) % Author: Brandon Replogle
% This function serves to plot the alpha and beta parameters as a % parameter plane and superimpose the constant omega curves
figure(1)
plot(Alpha, Beta) xlim([-5 5]) ylim([-5 5]) grid on
line([0,0], ylim, 'Color', 'k', 'LineWidth', 1); % Draw line for Y axis. line(xlim, [0,0], 'Color', 'k', 'LineWidth', 1); % Draw line for X axis. hold on
[A5,B5] = MD_Const_Omega(Polynomial1,Polynomial2, 0.5); plot(A5, B5, 'Color', 'r', 'LineWidth', 0.5)
hold on
[A75,B75] = MD_Const_Omega(Polynomial1,Polynomial2, 0.75); plot(A75, B75, 'Color', 'r', 'LineWidth', 0.5)
hold on
[A1,B1] = MD_Const_Omega(Polynomial1,Polynomial2, 1); plot(A1, B1, 'Color', 'r', 'LineWidth', 0.5)
hold on
[A125,B125] = MD_Const_Omega(Polynomial1,Polynomial2, 1.25); plot(A125, B125, 'Color', 'r', 'LineWidth', 0.5)
hold on
[Alpha5, Omega5] = MD_parameter_points(Polynomial1,Polynomial2,0.5,0); [Alpha75, Omega75] = MD_parameter_points(Polynomial1,Polynomial2,0.75,0); [Alpha1, Omega1] = MD_parameter_points(Polynomial1,Polynomial2,1,0);
[Alpha125, Omega125] = MD_parameter_points(Polynomial1,Polynomial2,1.25,0);
Point5=[Alpha5, Omega5] Point75=[Alpha75, Omega75] Point1=[Alpha1, Omega1]
Appendix B.7 - Parameter Points of Interest Finding the Parameter Points of Interest
function[Alpha, Beta] = parameter_points(Polynomial,Omeg,Sigm) % Author: Brandon Replogle
% This function serves to find precise points of Alpha and Beta
% test case polynomial
% Polynomial = tf([1 2 1 0],[1],'InputDelay',1)
% Find the order and coefficients of the polynomial to be used in expansion ord = order(Polynomial)-1;
coefs = tfdata(Polynomial, 'v');
% Define symbolic omega and sigma as real-valued syms omega real;
syms sig real;
% Define an empty array for expanding the polynomial syms Exp_Poly real;
Exp_Poly = 0;
% Symbolically expand the polynomial for p = (1:1:ord)
Exp_Poly = Exp_Poly + (coefs(ord-p+1).*Expand(p, sig, omega)); end
Exp_Poly = Exp_Poly + coefs(ord+1);
% Add in time delay still using s = -sigma + j*omega Delay = Polynomial.InputDelay;
Delay_Poly = Exp_Poly.*(exp(Delay*(-sig+1i*omega)));
% Split the polynomial into its real and imaginary parts Sym_Poly_real = real(Delay_Poly);
Sym_Poly_imag = imag(Delay_Poly);
% Give omega and sigma real values omega = Omeg;
sig = Sigm;
% Substitute real values into symbolic Alpha and Beta Alpha = double(subs(AlphaSym));
Finding the Parameter Points of Interest with Multiple Delay
function[Alpha, Beta] = MD_parameter_points(Polynomial1,Polynomial2,Omeg,Sigm) % Author: Brandon Replogle
% This function serves to find precise points of Alpha and Beta
% Test that T1 > T2
Delay1 = Polynomial1.InputDelay; Delay2 = Polynomial2.InputDelay;
% Find the order and coefficients of the polynomial to be used in expansion ord1 = order(Polynomial1)-1;
coefs1 = tfdata(Polynomial1, 'v'); ord2 = order(Polynomial2)-1; coefs2 = tfdata(Polynomial2, 'v');
% Define symbolic omega and sigma as real-valued syms omega real;
syms sig real;
% Define an empty array for expanding the polynomial syms Exp_Poly1 real;
Exp_Poly1 = 0; syms Exp_Poly2 real; Exp_Poly2 = 0;
%Exp_Poly1 = (-sig + 1i.*omega)^3; %Exp_Poly2 = 2.*(-sig + 1i.*omega)^2;
% Symbolically expand the polynomial for p = (1:1:ord1)
Exp_Poly1 = Exp_Poly1 + (coefs1(ord1-p+1).*Expand(p, sig, omega)); end
Exp_Poly1 = Exp_Poly1 + (coefs1(ord1+1));
% Symbolically expand the polynomial for z = (1:1:ord2)
Exp_Poly2 = Exp_Poly2 + (coefs2(ord2+1));
% Add in time delay still using s = -sigma + j*omega
Delay_Poly1 = Exp_Poly1.*(exp(Delay1*(-sig+1i*omega)));
%Delay_Poly = (Delay_Poly1*Exp_Poly2).*(exp(Delay2*(-sig+1i*omega))) Delay_Poly2 = Exp_Poly2.*(exp((Delay1-Delay2)*(-sig+1i*omega)));
% Combine delayed polynomials
Delay_Poly = (Delay_Poly1 + Delay_Poly2);
% Split the polynomial into its real and imaginary parts Sym_Poly_real = real(Delay_Poly);
Sym_Poly_imag = imag(Delay_Poly);
% Solve for Alpha and Beta symbolically AlphaSym = (-1/omega).*Sym_Poly_imag; BetaSym = Sym_Poly_real + sig.*AlphaSym;
% Give omega and sigma real values omega = Omeg;
sig = Sigm;
% Substitute real values into symbolic Alpha and Beta Alpha = double(subs(AlphaSym));
Appendix B.8 - Parameter Plane Testing
Alpha-Beta Parameter Plane Proof of Concept: function Sisotool_Generation()
Init = [1 1]; hold on
for test = 1:length(Init(:,1))
[v, X] = ode45(@circ_gen,[0 100],Init(test,:)); u = X(:,1);
w = X(:,2); plot(u,w,'b') end
xlabel('Alpha'); ylabel('Beta'); end
function deltax = circ_gen(~, x) deltax = zeros(2,1);
u = x(1); w = x(2); k = 3; m = 3; c=1;
Appendix B.9 Simulink Generation Script Simulink Generation:
%Generates the Simulink Environment %Author: Matthew Carroll
%Generates a Simulink environment and places blocks automatically
sys = 'Fig_5'; new_system(sys) open_system(sys)
%Define locations in Simulink Env. x = 30;
y = 30; w = 30; h = 30; offset = 60;
%Step Input
pos = [x y+h/2 x+w y+h*1.4];
add_block('built-in/Step',[sys '/Input'],'Position',pos,'Sampletime',num2str(0))
%Unused but this block creates a step with variable final value
%add_block('built-in/Step',[sys '/Input'],'Position',pos, 'After', num2str(5))
%Summing Block
pos = [x+offset y+h/2 (x+w)+offset y+h*1.2];
add_block('built-in/Sum',[sys '/Feedback'],'Position',pos,... 'IconShape','round','Inputs','|+-')
add_line(sys,'Input/1','Feedback/1','autorouting','on')
%Saturation block
pos = [x+offset*2 y+h/2 (x+w)+offset*2 y+h*1.5]; add_block('built-in/Saturate',[sys '/Sat'],'Position',pos,... 'UpperLimit',num2str(4),'LowerLimit',num2str(-4));
add_line(sys,'Feedback/1','Sat/1','autorouting','on')
pos = [x+offset*3 y+h/2 (x+w)+offset*3 y+h*1.5];
add_block('built-in/TransportDelay',[sys '/Delay'],'Position',pos)
add_line(sys,'Sat/1','Delay/1','autorouting','on')
%TransferFunction
pos = [x+offset*4 y+h/10 (x+w*4)+offset*4 y+h*2]; add_block('built-in/TransferFcn',[sys '/TF'],'Position',pos,... 'Numerator','[2.15 1.41]','Denominator','[1 2 1 0]')
add_line(sys,'Delay/1','TF/1','autorouting','on')
add_line(sys,'TF/1','Feedback/2','autorouting','on')
%Scope
pos = [x+offset*6.5 y+h/2 (x+w)+offset*6.5 y+h*1.5]; add_block('built-in/Scope',[sys '/Scope'],'Position',pos)
Script for Generating Simulink Environment From Console Commands:
![Figure 2.1: Sample Simulink Flow Diagram[1]](https://thumb-us.123doks.com/thumbv2/123dok_us/8219717.2179269/8.918.302.616.591.853/figure-sample-simulink-flow-diagram.webp)
![Figure 2.3: Alpha-Beta Parameter Plane[2] Figure 2.4: Contant-ω Curves of a System[2]](https://thumb-us.123doks.com/thumbv2/123dok_us/8219717.2179269/9.918.130.750.607.911/figure-alpha-parameter-plane-figure-contant-curves-system.webp)
![Figure 2.5: Alpha-Beta Region of Stability[2] Figure 2.6: Multiple-Delay System [2]](https://thumb-us.123doks.com/thumbv2/123dok_us/8219717.2179269/10.918.118.789.112.419/figure-alpha-region-stability-figure-multiple-delay-system.webp)
![Figure 2.7: Stability Plot for Varying T P /T C [3]](https://thumb-us.123doks.com/thumbv2/123dok_us/8219717.2179269/11.918.284.637.111.312/figure-stability-plot-varying-t-p-t-c.webp)
![Figure 2.9: Simulated Scope Output From Figure 2.8 [5]](https://thumb-us.123doks.com/thumbv2/123dok_us/8219717.2179269/12.918.239.678.805.988/figure-simulated-scope-output-from-figure.webp)

![Figure 4.9: Example Reference plot for Sigma = 0 (same as figure 2.3) [2]](https://thumb-us.123doks.com/thumbv2/123dok_us/8219717.2179269/19.918.282.654.133.476/figure-example-reference-plot-sigma-same-as-figure.webp)