Steeves (2014)_Life_Online_FullReport
60
0
0
Full text
(2) This report can be downloaded from: http://mediasmarts.ca/ycww Cite as: Steeves, Valerie. (2014.) Young Canadians in a Wired World, Phase III: Life Online. Ottawa: MediaSmarts.. Written for MediaSmarts by Valerie Steeves, Ph.D. Research Firm: Directions Evidence & Policy Research Group. 950 Gladstone Avenue, Suite 120 Ottawa, ON Canada K1Y 3E6 T: 613-224-7721 F: 613-761-9024 [email protected] mediasmarts.ca @mediasmarts. Young Canadians in a Wired World – Phase III: Life Online was made possible by financial contributions from Canadian Internet Registration Authority (CIRA), Office of the Privacy Commissioner of Canada and The Alberta Teachers’ Association. Young Canadians in a Wired World, Phase III: Life Online MediaSmarts © 2014.
(3) Table of Contents Introduction ................................................................................................................................... 1 Executive Summary – Key Findings ............................................................................................. 2 Online Access ......................................................................................................................... 2 Online Activities ...................................................................................................................... 3 Top 10 Favourite Websites ..................................................................................................... 4 Opinions about Online Safety ................................................................................................. 5 Parental Involvement .............................................................................................................. 5 Unplugging .............................................................................................................................. 6 Online Access ............................................................................................................................... 7 Online Activities .......................................................................................................................... 13 The Top 10 Favourite Websites .................................................................................................. 25 Opinions about Online Safety ..................................................................................................... 29 Parental Involvement .................................................................................................................. 31 Unplugging .................................................................................................................................. 43 Methodology ............................................................................................................................... 49 Demographics of Survey Participants ......................................................................................... 54. Young Canadians in a Wired World, Phase III: Life Online MediaSmarts © 2014.
(4) Young Canadians in a Wired World, Phase III:. LIFE ONLINE. Introduction Digital natives; tech savvy; narcissistic; innovative; mean. There are a lot of assumptions out there about kids online, but the labels we use are often misleading and out of step with what young people are actually doing with networked technologies. Take, for example, the adage that since young people post “everything” on social media, they don’t care about privacy. MediaSmarts’ Young Canadians in a Wired World studies have found the opposite has consistently been true, from the first time we went into the field in 2000. That’s why we do our research: to take a snapshot of what Canadian children and youth are doing and thinking to get a better understanding of how networked technologies affect their daily lives. In 2013, MediaSmarts conducted a national survey of 5,436 Canadian students, grades 4 through 11, in every province and territory, to explore the role of networked technologies in their lives. Life Online is the first of a series of reports which draw on the rich data that was collected. Life Online touches on some of the main themes relating to students’ online use which we will explore in more depth in subsequent reports, including privacy, digital permanence, bullying, commercialization, offensive content, online relationships and digital literacy in the classroom and in the home.. Young Canadians in a Wired World, Phase III: Life Online MediaSmarts © 2014. 1.
(5) Executive Summary – Key Findings. What does online life look like for the average young Canadian?. First and foremost, these are highly connected children and teens, most of who are accustomed to online access through devices that are portable and personal. This is a big shift from 2005, where the majority of students accessed the Internet through desktop computers at home. Today’s youth have multiple platforms to choose from to go online.. Online Access . . Almost every student we surveyed has access to the Internet outside of school. o Internet access is universal, with 99 percent of students able to access the Internet outside of school. o When asked to indicate how they connect to the Internet when they’re not in school (from a list that included a family desktop computer, their own desktop computer, a portable computer, a computer at a library or community centre, an MP3 player, cell/smart phone, game console or “I only go on the Internet when I’m at school) half of all students report using a shared family computer to go online; but these numbers drop from 64 percent in Grade 4, to 37 percent in Grade 11. o Six percent of students rely on computers at local libraries and community centres to connect. o Boys (27%) are more likely than girls (18%) to use their own desktop computer to go online, but the largest gender difference relating to how young people access the Internet is that 60 percent of boys access the Net through a gaming console compared to 27 percent of girls. Portable devices are used more than desktop computers to access the Internet. o Even in Grade 5, more students access the Internet through a tablet or laptop than through a desktop computer (62% compared to 59%). o Eighty percent of French language students in Quebec use a portable device to go online, compared to 67 percent of English language students in the rest of Canada. o Older students are more likely than younger students to go online using their own desktop computer, ranging from a low of 17 percent in Grade 4 to 27 percent in Grade 11. o MP3 players are commonly used to go online – especially for students in grades 4-8 – but decline in use throughout high school. o Access to the Internet through laptops and cell phones rises in grades 9-11.. Young Canadians in a Wired World, Phase III: Life Online MediaSmarts © 2014. 2.
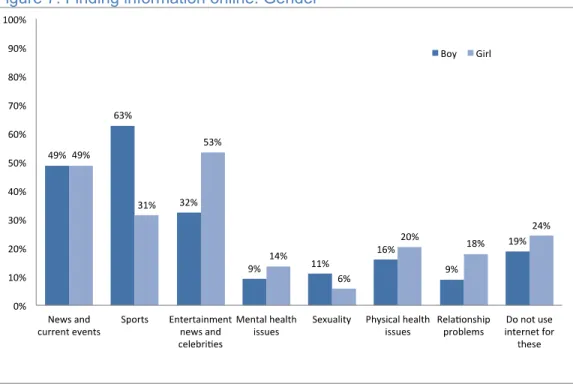
(6) . Cell phones and smart phones are primary devices for students to go online. o Close to half (49%) of students in Grade 4 have access to their own phone or someone else’s phone on a regular basis. o There’s little difference between girls and boys when it comes to accessing or owning a cell phone. o One-quarter (24%) of students in Grade 4, half (52%) of students in Grade 7, and 85 percent of students in Grade 11 have their own cell phone.. Online Activities Students in 2013 are confident and enthusiastic users of networked technology, although they may not always be using networked devices to their fullest potential. Online life has become increasingly social, with social networking now an integral component of many online activities. Young Canadians are also turning to the Internet as an important source of information – from sports and news to more sensitive topics such as mental and physical health. . . . Creative uses of digital media, such as posting homemade videos or mash-ups are still relatively uncommon. o Approximately one-quarter to a third of students have used networked tools to post their own stories or artwork (38%), videos or audio clips (33%) or mash-ups (22%), but only a small number do any of these on a regular basis. Participatory civic uses of digital media are also relatively low. o Less than a third of students have posted comments on news sites, 50 percent have passed on links to people on news stories or current events and just over a third have joined or supported activist groups online. Digital media are a source of information on a variety of issues, with 78 percent of students using the Internet to find information about news, health issues or relationships. o Overall, 49 percent of students use the Internet to follow news and current events: this climbs steadily from 28 percent in Grade 4 to 65 percent in Grade 11. o The biggest gender differences can be seen in finding information about sports (63% of boys report this compared to 31% of girls) and looking for news relating to entertainment and celebrities (53% of girls compared to 32% of boys). o Girls are also more likely to seek out information about mental health issues (14% compared to 9% of boys), physical health issues (20% compared to 16% of boys) and relationship problems (18% compared to 9% of boys). o Close to a third of students have gone online to ask an expert or other kids for advice about personal problems. o Compared to students in younger grades, a higher percentage of students in grades 7-11 report looking for information on more sensitive topics such as mental health issues, sexuality, physical health issues and relationship problems.. Young Canadians in a Wired World, Phase III: Life Online MediaSmarts © 2014. 3.
(7) . . Online media are primarily used for entertainment and communicating with friends and family. o The most frequent online activities reported by students are: playing online games (59%) downloading or streaming music, TV shows or movies (51%) reading or posting on someone else’s social network site (52%) posting on the student’s own social networking site (41%) posting on the student’s own Twitter site (21%) following friends and family on Twitter (21%) following celebrities on Twitter (20%) pranking or trolling someone (20%). o French language students in Quebec are much less likely than English language students in the rest of Canada to use Twitter. o Although more boys than girls play online games, especially in the earlier grades, by Grade 9, following other people on social networking sites and downloading/streaming mainstream media content online are the most frequent activities for both genders. Canadian youth like socializing online, even in younger grades. o Almost one-third of students in grades 4-6 have a Facebook account, in spite of its terms of use agreement that bars children under the age of 13 from using the site. o Sixteen percent of students in grades 4-6 also have Twitter accounts, which have similar age restrictions. o For grades 4-6, boys (36%) are slightly more likely to have Facebook accounts than girls (30%) but there is no gender difference for Twitter accounts. o Overall, the number of Facebook accounts rises substantially after Grade 6, from 67 percent in Grade 7 to 95 percent in Grade 11. o About half of students in grades 7-11 (47%) have Twitter accounts.. Top 10 Favourite Websites When asked to name their favourite websites, predominant themes are online videos, gaming and social networking. All students enjoy watching, and sometimes posting, videos on YouTube. Generally, younger students prefer to visit game sites, while older students prefer social media sites. In younger grades, both girls and boys list numerous gaming sites and virtual worlds amongst their favourites, with social networking an integral part of much of the online play on the sites preferred by girls. . Overall, students in 2013 listed more than 3,000 different favourite websites. YouTube, at 75 percent, is the top site among all students. Next on the list overall is Facebook (57%) followed by Google (31%).. Young Canadians in a Wired World, Phase III: Life Online MediaSmarts © 2014. 4.
(8) . . There is a fair degree of consensus about the Top 10 most popular sites: YouTube, Facebook, Google and Twitter appear in the Top 10 list for both boys and girls across all grades. For older students, Facebook is the second most popular choice for both girls and boys. Seven of the Top 10 favourite sites allow users to post and share information and content (YouTube, Facebook, Twitter, Tumblr, Instagram, Minecraft and Hotmail), illustrating the need to teach young people digital literacy skills so they understand privacy, digital permanence, ethical decision-making and protecting personal information.. Opinions about Online Safety When asked whether they agree or disagree with statements relating to online safety, students appear both aware of the potential risks of going online and confident in their ability to handle online risk. Feelings of safety grow with age, from a low of 50 percent in grades 4 and 7 to a high of 66 percent in Grade 11. . The majority of students, especially girls, are aware of the risks of talking to strangers online. However, almost all students are confident in their ability to protect themselves online and a majority feel that the Internet is a safe place for them. o Girls are both more likely than boys to agree with the statement that they could be hurt by online strangers (82% compared to 63% of boys) and less likely to see the Internet as a safe place (51% compared to 61% of boys). o Comparing grades, feelings of safety rise from a low of 50 percent in grades 4 and 7 to a high of 66 percent in Grade 11. o But despite concerns about safety, high percentages of boys (90%) and girls (89%) agree with the statement that “I know how to protect myself online”. o Even the youngest students are confident in their ability to protect themselves online, with 77 percent of Grade 4 students indicating this.. Parental Involvement Many of the students participating in the 2013 survey paint a picture of parents who are actively engaged in their online lives. This ranges from setting online rules (over 84% of students indicate having at least one rule), to going online with their children, to teaching their children about online issues. . Overall, the percentage of household rules about online activities has declined dramatically from 2005 to 2013, most notably in rules relating to meeting online acquaintances in person (30% fewer students have rules on this) and sites you are not supposed to visit (28% fewer students have rules on this).. Young Canadians in a Wired World, Phase III: Life Online MediaSmarts © 2014. 5.
(9) . . . . Girls are more likely than boys to have household rules in place regarding online activities. This suggests that girls are more regulated than boys and may carry additional burdens with respect to their own online safety and the tone of their online interactions. At the same time, students with household rules are less likely to engage in activities that adults consider risky, such as posting their contact information, visiting gambling sites, seeking out online pornography or talking to strangers online. Overall, the percentage of students who are “usually” online at home with a parent or other adult increased from 2005 to 2013, and the percentage that are “never” online at home with a parent or adult decreased from 2005 to 2013. o Although parental supervision is much higher for younger students than for older students, a substantial percentage of students in grades 4-6, nearly one-third, never sit with an adult or parents when online. The good news is that along with teachers, young people report learning about a wide range of online issues from their parents. o Almost half (45%) of students of all ages report that they’ve learned about online issues from their parents and 41 percent report learning this from teachers.. Unplugging A few questions were asked to gauge just how connected young Canadians are – and how they feel about this. . . . Thirty-nine percent of students who have cell phones sleep with them in case they get calls or messages during the night. o This peaks at just over half of students by Grade 11, but one-fifth of Grade 4 students also report sleeping with their phones. Although one-third of students worry that they spend too much time online, only half say they would be upset or unhappy if they had to unplug for anything other than school work for a week. Ninety-four percent of students choose to go offline to do other things like spending more time with friends or family, enjoying some quiet time by themselves or going outside.. Young Canadians in a Wired World, Phase III: Life Online MediaSmarts © 2014. 6.
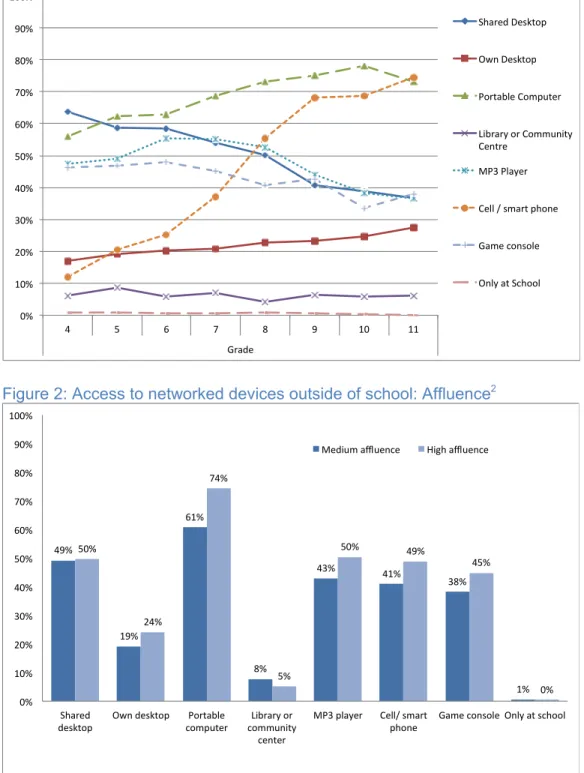
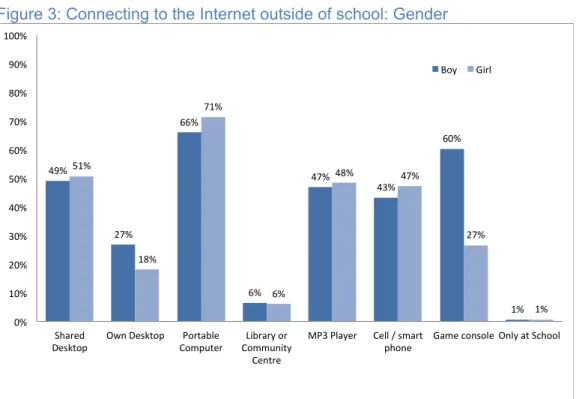
(10) Online Access. Almost every student we surveyed (99%) has access to the Internet outside of school, from a variety of (mostly portable) platforms and devices. When we talked to parents in 2000 and 2004, a number of them told us that they put the family computer in the family room or kitchen so they could keep a benevolent eye on their kids as they surfed. Those days of single, supervised access points have been replaced with multiple – and portable – points of entry, especially for teenagers. Although half of all students tell us that they use a shared family computer to go online (Table 1), the numbers drop from a high of 64 percent in Grade 4 to a low of 37 percent in Grade 11 (Figure 1). Access through a personal desktop, on the other hand, increases from 17 percent in Grade 4 to 27 percent in Grade 11. This trend is most marked for French language students in Quebec. Thirty-one percent of them access the Internet through a personal desktop, compared to 24 percent of English language students in the rest of Canada. Portable devices are used more to access the Internet than desktop computers. Even in Grade 5, access through a tablet or laptop is higher than access through a desktop computer. Portable devices, especially laptops, tablets and cell phones, are the most common way to connect for all students. Again, this trend is more pronounced in Quebec, where 80 percent of French language students use a laptop or a tablet to go online, compared to 67 percent of English language students in the rest of Canada. Even in Grade 5, access through a laptop or tablet (62%) for all students (both French language and English language students) is higher than access using a shared family desktop computer (59%), and almost half of the students (47%) surf on a portable MP3 player. MP3 player access remains fairly constant for younger students in grades 4 through 8, but drops off as access over a laptop or cell phone rises in grades 9, 10 and 11. This suggests that, although a significant percentage of students in the early grades gain access using portable devices like cell phones (12% in Grade 4), MP3 players (47% in Grade 4) and laptops (56% in Grade 4), older students in particular are likely to be using the Internet with more independence and less adult supervision than younger students. However, affluence plays a role in access. Higher numbers of high affluence students compared to medium affluence students have access to portable computers (74% compared to 61% of medium affluence students), MP3 players (50% compared to 43% of medium affluence students), cell phones (49% compared to 41% of medium affluence students) and game consoles (45% compared to 38% of medium affluence students) (Figure 2).. Young Canadians in a Wired World, Phase III: Life Online MediaSmarts © 2014. 7.
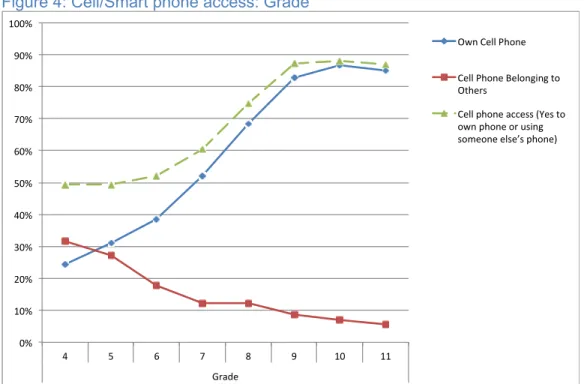
(11) There are also interesting gender differences in how young people access the Internet outside of school (Figure 3). A larger percentage of boys (27%) than girls (18%) access the Internet over their own desktop, and slightly more girls (71%) than boys (66%) go online using a laptop. But the largest difference involves gaming: 60 percent of boys access the Internet through a gaming console compared to 27 percent of girls. This suggests that boys are more likely to be using the Internet from a fixed location, whereas girls are more likely to be using a portable device. There is also a small but significant number of students (6%) who access the Internet at a library or community centre. This is fairly constant across the grades, suggesting that continued government support for community access points may be an important way to ensure that all Canadian youth have access to online resources. Table 1: Connecting to the Internet outside of school1 How do you connect to the Internet when you are NOT at school?. Percentage. A desktop computer I share with my family (for example, in the kitchen or family room) Grade. 50%. My own desktop computer ♂♀. 22%. A portable computer (for example, laptop, netbook, iPad) ♂♀ Grade. 68%. A computer at the library or a community centre (for example, Boys and Girls Club) MP3 player (for example, iPod Touch) Grade Cell phone / smart phone. 47%. Grade. Game console (for example, Wii, Xbox, PlayStation) ♂♀ I only go on the Internet when I’m at school. 6%. 45% Grade. 42% 1%. 1. In the results presented in tables in this report, statistically significant differences by gender are indicated next to the question by ♂♀ and statistically significant differences by grade are indicated next to the question by Grade Young Canadians in a Wired World, Phase III: Life Online MediaSmarts © 2014. 8.
(12) Figure 1: Connecting to the Internet outside of school: Grade 100% Shared Desktop. 90% 80%. Own Desktop. 70%. Portable Computer. 60%. Library or Community Centre. 50%. MP3 Player 40% Cell / smart phone 30% Game console. 20%. Only at School. 10% 0% 4. 5. 6. 7. 8. 9. 10. 11. Grade. Figure 2: Access to networked devices outside of school: Affluence2 100% 90%. Medium affluence. 80%. High affluence. 74%. 70% 61% 60% 50%. 50%. 49% 50% 43%. 49% 45% 41%. 40% 30%. 38%. 24% 19%. 20%. 8%. 10%. 5% 1%. 0%. 0% Shared desktop. Own desktop. Portable computer. Library or community center. MP3 player. Cell/ smart phone. Game console Only at school. 2. A modified version of the Family Affluence Scale was used to measure students’ socioeconomic status. More information can be found under Comparing High Affluence Students and Medium Affluence Students in the Methodology section of this report.. Young Canadians in a Wired World, Phase III: Life Online MediaSmarts © 2014. 9.
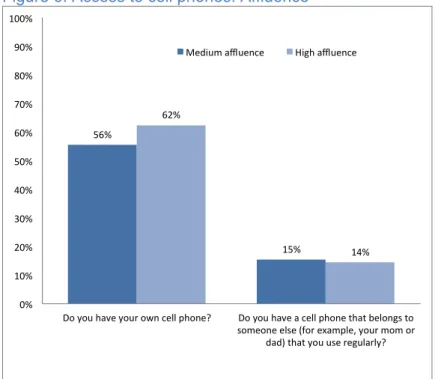
(13) Figure 3: Connecting to the Internet outside of school: Gender 100% 90%. Boy. Girl. 80% 71% 70%. 66% 60%. 60% 50%. 49% 51%. 47% 48%. 47% 43%. 40% 27%. 30%. 27% 18%. 20%. 6%. 10%. 6% 1%. 1%. 0% Shared Desktop. Own Desktop. Portable Computer. Library or Community Centre. MP3 Player. Cell / smart Game console Only at School phone. One-quarter (24%) of students in Grade 4, half (52%) of students in Grade 7, and 85 percent of students in Grade 11 have their own cell phone. The trend towards portable communications is perhaps best illustrated by the rise in children’s cell phone use over the past eight years. In our 2005 survey, only 6 percent of students in Grade 4 and 46 percent of students in Grade 11 had their own phone. In the current survey, almost one-quarter (24%) of students in Grade 4 have their own phone and a third (31%) regularly use a phone belonging to someone else. Combined, just under half (49%) have access to their own phone or to someone else’s phone on a regular basis. By Grade 11, personal cell phones largely replace sharing a phone with someone else and a large majority of students (85%) have their own phone. There are no differences between boys and girls in this regard. However, affluence again plays a role. Sixty-two percent of high affluence students report that they have their own cell phone, compared to 56 percent of medium affluence students, but there is no difference between the two groups when it comes to using a cell phone that belongs to someone else (Figure 6).. Young Canadians in a Wired World, Phase III: Life Online MediaSmarts © 2014. 10.
(14) Table 2: Cell/Smart phone access Percentage Yes Do you have your own cell phone? Grade. 59%. Do you have a cell phone that belongs to someone else (for example, your mom or dad) that you use regularly? Grade Cell phone access (Yes to own phone or using someone else’s phone). Grade. 15% 69%. Figure 4: Cell/Smart phone access: Grade 100% Own Cell Phone 90% Cell Phone Belonging to Others. 80%. Cell phone access (Yes to own phone or using someone else’s phone). 70% 60% 50% 40% 30% 20% 10% 0% 4. 5. 6. 7. 8. 9. 10. 11. Grade. Young Canadians in a Wired World, Phase III: Life Online MediaSmarts © 2014. 11.
(15) Figure 5: Cell/Smart phone access: Gender 100% 90%. Boy. Girl. 80% 71% 66%. 70% 60%. 58%. 60%. 50% 40% 30% 20%. 17%. 13%. 10% 0% Own Cell Phone. Cell Phone Belonging to Others. Cell phone access (Yes to own phone or using someone else’s phone). Figure 6: Access to cell phones: Affluence 100% 90%. Medium affluence. High affluence. 80% 70% 60%. 62% 56%. 50% 40% 30% 20%. 15%. 14%. 10% 0% Do you have your own cell phone?. Do you have a cell phone that belongs to someone else (for example, your mom or dad) that you use regularly?. Young Canadians in a Wired World, Phase III: Life Online MediaSmarts © 2014. 12.
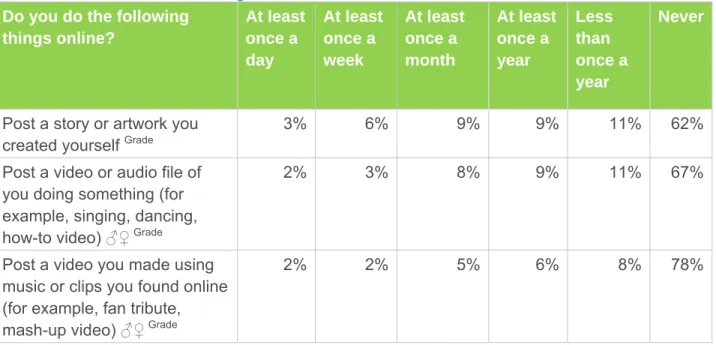
(16) Online Activities. The survey results around access suggest that we have made significant progress in engaging young Canadians in networked communications. But access to computers and cell phones is the relatively easy part: it is much harder to ensure that young people acquire all the skills they need not only to use networked technologies, but to use them well. Experts suggest that digital literacy rests on three pillars: the technical skills to operate digital devices, the critical thinking skills to understand how those devices affect our behaviour and perceptions and the ability to create digital content in order to actively participate in digital society3. Creative uses of digital media, such as posting a homemade video or mash-up are still relatively uncommon. Approximately one-quarter to a third of students have used networked tools to post a story or artwork they created themselves (38%), a video or audio clip of themselves (33%) or a mash-up file such as a fan tribute (22%) at some point in time (Table 3). However, the percentage who do so frequently, i.e. at least once a day or once a week, is much lower (story/artwork 9%, video/audio of themselves 5%, mash-up 4%). The numbers around civic engagement are more encouraging. For example, 49 percent of students in all grades have gone online to find information about news and current events (Table 5) and half of students in grades 7-11 have sent links to news stories or current events to others (Table 4)4. But most have never participated in online debate, either by posting comments in a news site (71% of grades 7-11 have never done so) or joining an activist group (65% of all grades have never done so). Like creative uses, frequent engagement in these two activities is much lower (sending links, 14% of grades 7-11; posting comments, 7% of grades 711; activism, 7% of all grades), suggesting that there is continued work to be done in helping young Canadians develop skills and competencies for becoming more civically engaged online.. 3. See MediaSmarts’ Digital Literacy Fundamentals at: http://mediasmarts.ca/digital-media-literacyfundamentals/digital-literacy-fundamentals#what 4 French language students in Quebec were more likely to use the Internet to find information about current affairs/news (58% compared to 49% of English language students in the rest of Canada). Young Canadians in a Wired World, Phase III: Life Online MediaSmarts © 2014. 13.
(17) Table 3: What are students doing online? Do you do the following At least things online? once a day. At least once a week. At least once a month. At least once a year. Less than once a year. Never. Post a story or artwork you created yourself Grade. 3%. 6%. 9%. 9%. 11%. 62%. Post a video or audio file of you doing something (for example, singing, dancing, how-to video) ♂♀ Grade. 2%. 3%. 8%. 9%. 11%. 67%. Post a video you made using music or clips you found online (for example, fan tribute, mash-up video) ♂♀ Grade. 2%. 2%. 5%. 6%. 8%. 78%. Table 4: What are students doing online? Do you do the following At least things online? once a day. At least once a week. At least once a month. At least once a year. Less than once a year. Never. Post comments on news sites (grade 7-11 only). 3%. 4%. 6%. 6%. 9%. 71%. Send people links to news stories or information about current events (grade 7-11 only) Grade. 4%. 10%. 14%. 11%. 12%. 50%. Join or support an activist group (for example, Greenpeace, Students Against Bullying, Free the Children) Grade. 3%. 4%. 7%. 10%. 11%. 65%. Digital media are a source of information on a variety of issues. Seventy-eight percent of students use the Internet to find information about news, health issues or relationships (Table 5). Girls are primarily looking for entertainment news and information about celebrities (53% compared to 32% of boys), whereas boys tend to look for information about sports (63% compared to 31% of girls). Girls are also slightly more likely than boys to seek out information about mental health issues (14% compared to 9% of boys), physical health Young Canadians in a Wired World, Phase III: Life Online MediaSmarts © 2014. 14.
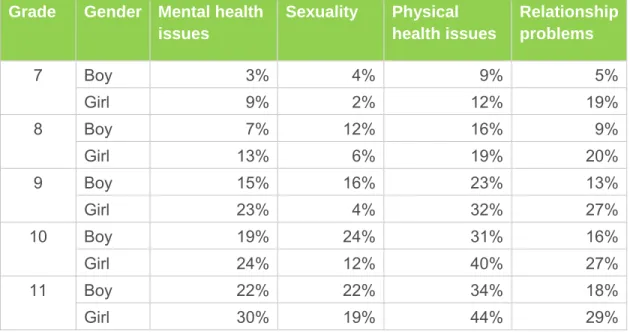
(18) issues (20% compared to 16% of boys) and relationship problems (18% compared to 9% of boys). The percentage of students who use the Internet as an information source increases from Grade 4 through to Grade 11, with the exception of looking for information about sports which remains fairly constant across the grades. Table 5: Finding information online Do you use the Internet to find information about these?. Percentage. News and current events Grade. 49%. Sports ♂♀. 47%. Entertainment news and celebrities ♂♀ Grade. 43%. Mental health issues ♂♀ Grade. 11%. Sexuality ♂♀. Grade. 8%. Physical health issues ♂♀ Grade. 18%. Relationship problems (for example, advice on dating, getting along with family or friends, dealing with bullies) ♂♀ Grade. 14%. I do not use the Internet to find information about any of these ♂♀ Grade. 22%. Figure 7: Finding information online: Gender. Young Canadians in a Wired World, Phase III: Life Online MediaSmarts © 2014. 15.
(19) Figure 8: Finding information online: Grade 100%. News and current events. 90%. Sports. 80%. Entertainment news and celebri es. 70%. Mental health issues. 60%. Sexuality. 50%. Physical health issues. 40%. Rela onship problems. 30%. Do not use internet for these. 20% 10% 0% 4. 5. 6. 7. 8. 9. 10. 11. Grade. Compared to students in younger grades, a higher percentage of students in grades 7-11 report looking for information on more sensitive topics such as mental health issues, sexuality, physical health issues and relationship problems. Table 6: Finding information online: Sensitive issues Grade Gender Mental health Sexuality Physical issues health issues 7 8 9 10 11. Relationship problems. Boy. 3%. 4%. 9%. 5%. Girl. 9%. 2%. 12%. 19%. Boy. 7%. 12%. 16%. 9%. Girl. 13%. 6%. 19%. 20%. Boy. 15%. 16%. 23%. 13%. Girl. 23%. 4%. 32%. 27%. Boy. 19%. 24%. 31%. 16%. Girl. 24%. 12%. 40%. 27%. Boy. 22%. 22%. 34%. 18%. Girl. 30%. 19%. 44%. 29%. Young Canadians in a Wired World, Phase III: Life Online MediaSmarts © 2014. 16.
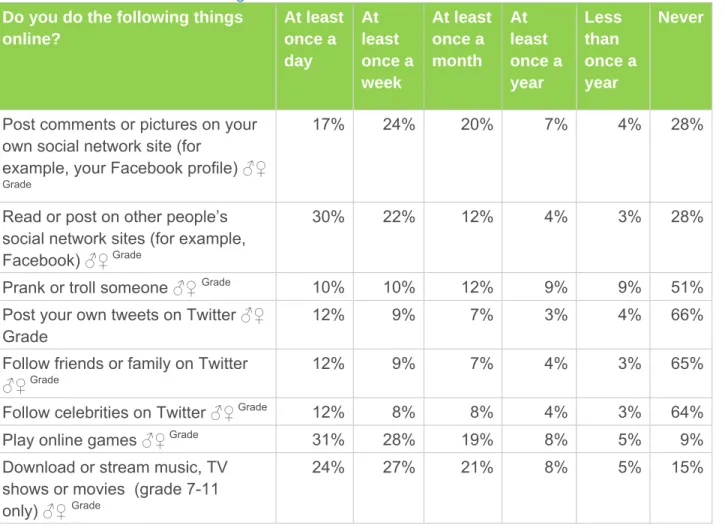
(20) Close to a third of students have gone online to ask an expert (30%) or other kids (33%) for advice about a personal problem, although only a small percentage do so frequently (Table 7). Table 7: What are students doing online? Advice-seeking Do you do the following things At At online? least least once a once a day week. At least once a month. At least once a year. Less than once a year. Never. Ask an expert for advice about a personal problem Grade. 2%. 4%. 7%. 7%. 10%. 70%. Ask kids for advice about a personal problem Grade. 2%. 6%. 9%. 7%. 9%. 67%. Online media are primarily used for entertainment and communicating with friends and family. When asked to indicate, from a list of 20 choices, how often students participate in various online activities the most frequent activities5 reported by students are: . playing online games (59%) downloading or streaming music, TV shows or movies (51%) reading or posting on someone else’s social network site (52%) posting on the student’s own social networking site (41%) posting on the student’s own Twitter site (21%) following friends and family on Twitter (21%) following celebrities on Twitter (20%) pranking or trolling someone6 (20%) (Table 8).. All of these activities increase across the grades with the exception of playing online games, which drops from a high of 77 percent in Grade 5 to a low of 42 percent in Grade 10 (Figure 9). Interestingly, the increase from Grade 4 to Grade 11 with respect to downloading/streaming is relatively small (17%), and downloading/streaming remains one of the most common activities for all grades (e.g. 50% in Grade 4). This contrasts with participating in social media-related 5. For the purposes of analysis, Directions defined the most frequent online activities as those activities that 20 percent or more of students reported as doing at least once a day or once a week. 6 Youth participants in the focus groups we held prior to this survey used the terms pranking or trolling to describe playing tricks or jokes on people online or using a cell phone. Examples included getting someone to click on a link to a joke site, sending someone a message that captures his or her device in a loop that he or she can only exit by restarting the device, and anonymously posting something online to get a rise out of the recipient (Steeves, V. (2012). Young Canadians in a Wired World, Phase III: Talking to Youth and Parents about Life Online. Ottawa: MediaSmarts). Young Canadians in a Wired World, Phase III: Life Online MediaSmarts © 2014. 17.
(21) activities, which is low in Grade 4 (ranging from 5% to 18%) but increases substantially by Grade 11, as follows: . reading others’ sites increases by 54% tweeting increases by 39% following friends/family on Twitter increases by 33% posting on one’s own site increases by 32% following celebrities on Twitter increases by 28%. This is consistent with developmental literature that suggests that social connection becomes more important as young people move from childhood to their teen years. French language students in Quebec are less likely than English language students in the rest of Canada to use Twitter to post their own tweets (8% compared to 22% of English language students), or follow friends or family on a daily or weekly basis (14% compared to 22% of English language students).7 Perhaps not surprisingly, more boys (71%) than girls (47%) report frequently playing online games (Figure 10), but participation for boys drops off substantially in the higher grades (Figure 9). Boys are also more likely than girls to prank or troll someone (31% compared to 9% of girls) and download or stream mainstream media content (55% compared to 49% of girls). Girls, on the other hand, are more likely than boys to use social media to communicate with family and friends (e.g. 45% posted on their own social networking site compared to 36% of boys) and to follow celebrities (26% compared to 14% of boys). Although more boys than girls play online games, especially in the earlier grades, by Grade 8, following other people on social networking sites and downloading/streaming mainstream media content online are the most frequent activities for both genders. The popularity of both activities (following others on social networking sites and downloading/streaming) continues to rise in grades 9, 10 and 11.. 7. However, there was no significant difference between the groups with respect to having a Twitter account (40% of French language students, compared to 44% of English language students). Young Canadians in a Wired World, Phase III: Life Online MediaSmarts © 2014. 18.
(22) Table 8: What are students doing online? Do you do the following things At least online? once a day. At least once a week. At least once a month. 17%. 24%. 20%. 7%. 4%. 28%. Read or post on other people’s social network sites (for example, Facebook) ♂♀ Grade. 30%. 22%. 12%. 4%. 3%. 28%. Prank or troll someone ♂♀ Grade. 10%. 10%. 12%. 9%. 9%. 51%. Post your own tweets on Twitter ♂♀ Grade. 12%. 9%. 7%. 3%. 4%. 66%. Follow friends or family on Twitter ♂♀ Grade. 12%. 9%. 7%. 4%. 3%. 65%. Follow celebrities on Twitter ♂♀ Grade. 12%. 8%. 8%. 4%. 3%. 64%. 31%. 28%. 19%. 8%. 5%. 9%. 24%. 27%. 21%. 8%. 5%. 15%. Post comments or pictures on your own social network site (for example, your Facebook profile) ♂♀. At least once a year. Less than once a year. Never. Grade. Play online games ♂♀. Grade. Download or stream music, TV shows or movies (grade 7-11 only) ♂♀ Grade. Young Canadians in a Wired World, Phase III: Life Online MediaSmarts © 2014. 19.
(23) Figure 9: What are students doing online? Grade 100%. Post comments or pictures on your own social network site Read or post on other people’s social network sites Prank or troll someone. 90% 80% 70%. Post your own tweets on Twi er. 60% 50%. Follow friends or family on Twi er. 40%. Follow celebri es on Twi er. 30% Play online games 20% Download or stream music, TV shows or movies. 10% 0% 4. 5. 6. 7. 8. 9. 10. 11. Grade. Figure 10: What are students doing online? Gender. Young Canadians in a Wired World, Phase III: Life Online MediaSmarts © 2014. 20.
(24) Almost one-third of students in grades 4-6 have a Facebook account in spite of its terms of use agreement that bars children under the age of 13 from using the site. Thirty-two percent of students in grades 4-6 have a Facebook account and 16 percent have a Twitter account (Table 9), in spite of terms of use agreements that bar children under the age of 13 from using these sites. Boys are slightly more likely than girls to have a Facebook account (36% compared to 30% of girls), but there is no gender difference regarding Twitter (17% for both boys and girls) (Figure 12). About one-third of students in grades 4-6 also indicate that they have accounts on a variety of websites that are listed in the survey (Table 9). The most popular of the sites queried are Club Penguin (38%), Webkinz (35%), Moshi Monsters (33%) and PopTropica (28%), although no French language students in Quebec have an account on Club Penguin and only five percent have an account on Webkinz8. With the exception of Club Penguin, girls are more likely than boys to have accounts on these sites, especially Webkinz (difference of 26%) and Moshi Monsters (difference of 22%). Nonetheless, interest wanes in Grade 6, as fewer students in this grade have an account on these sites than students in Grade 4. The exception is StarDoll, which is almost twice as popular with students in grades 5 and 6 (9%) than it is for students in Grade 4 (5%) (Figure 13). StarDoll is a play site where girls dress “dolls” who resemble stylized pictures of popular actors and musicians. The number of Facebook accounts rises substantially after Grade 6, from 67 percent in Grade 7 to 95 percent in Grade 11. About half of students in grades 7-11 also have accounts on Twitter (47%), rising from about one-third (31%) in Grade 7 to almost two-thirds (63%) by Grade 11. The number of Instagram accounts stays fairly level at about 42 percent, and a smaller percent have accounts on Tumblr (27%) and Pinterest (13%) (Figure 13). Although equal numbers of boys and girls have Facebook accounts, there are fairly large gender differences in the other websites that were listed. Girls outnumber boys by 12 percent on Twitter, by 18 percent on Pinterest, by 23 percent on Instagram and by 25 percent on Tumblr (Figure 11).. 8. There were no differences between French language students in Quebec and English language students in the rest of Canada with respect to the other queried sites, even though they were English sites, with the exception of Facebook. Ninety-one percent of French language students had a Facebook account, compared to 75% of English language students. Facebook enables users to change the default language, so francophone users may choose to use it in French.. Young Canadians in a Wired World, Phase III: Life Online MediaSmarts © 2014. 21.
(25) Table 9: Do you have an account on the following sites? Do you have an account on the following sites? Grades 4-6 Facebook ♂♀ Grade. 32%. Twitter ♂♀ Grade. 16%. Club Penguin. 38%. Fantage ♂♀. 13%. Moshi Monsters ♂♀ Grade. 33%. PopTropica. 28%. StarDoll ♂. 8%. Webkinz ♂♀. 35% Grades 7-11. Facebook ♂♀ Grade. 82%. Twitter ♂♀ Grade. 47%. Instagram ♂♀. 42%. Pinterest ♂♀. 13%. Tumblr ♂♀ Grade. 27%. Young Canadians in a Wired World, Phase III: Life Online MediaSmarts © 2014. 22.
(26) Figure 11: Grades 7-11: Do you have an account on the following sites? Gender. Figure 12: Grades 4-6: Do you have an account on the following sites? Gender. Young Canadians in a Wired World, Phase III: Life Online MediaSmarts © 2014. 23.
(27) Figure 13: Do you have an account on the following sites? Grade 100%. Facebook Twi er. 90%. Club Penguin (Gr. 4‐6). 80%. Fantage (Gr. 4‐6) 70% MoshiMonsters (Gr. 4‐6) 60%. PopTropica (Gr. 4‐6). 50%. StarDoll (Gr. 4‐6). 40%. Webkinz (Gr. 4‐6) Instagram (Gr. 7‐11). 30%. Pinterest (Gr. 7‐11) 20% Tumblr (Gr. 7‐11) 10% 0% 4. 5. 6. 7. 8. 9. 10. 11. Grade. Young Canadians in a Wired World, Phase III: Life Online MediaSmarts © 2014. 24.
(28) The Top 10 Favourite Websites. Young people’s favourite websites are primarily places where students can chat with friends and share photos and videos. In order to get a sense of where young people go online, we asked students to list their five favourite websites. As in our 2005 survey, the variety of favourites is impressive: students in 2013 listed more than 3,000 sites. However, there is also a fair degree of consensus about the Top 10 most popular sites (Table 10). The significant change from 2005 is the emergence of social networking platforms. Facebook – which wasn’t widely available in 2005 – is the second most popular site (57%). Twitter is number four (24%), followed by Tumblr (12%) and Instagram (10%). All of the top 10 sites, with the exception of Wikipedia (number 10), are commercial sites. Because the majority of the top 10 sites are places where students can create and share information and content, this underscores the importance of teaching young people critical thinking skills regarding online sharing, digital permanence and the protection of personal privacy. Table 10: Top 10 favourite websites: All respondents9 What are your five favourite websites? Site. Content. Percent of respondents. YouTube.com. Video sharing. 75%. Facebook.com. Social networking. 57%. Google.ca. Search engine. 31%. Twitter.com. Microblogging / Social networking. 24%. Tumblr.com. Blogging / Social networking. 12%. Instagram.com. Media sharing / Social networking. 10%. Minecraft.com. Gaming. 8%. Miniclip.com. Gaming. 7%. Hotmail.com. Email. 6%. Wikipedia.org. Reference. 5%. 9. Note: Because the question “What are your five favourite websites?” was open-ended, numbers in Tables 10, 11 and 12 will add up to more than 100% percent.. Young Canadians in a Wired World, Phase III: Life Online MediaSmarts © 2014. 25.
(29) YouTube is the favourite site among all age groups and genders. Although there are interesting gender differences in Top 10 preferences, YouTube is the number one site for boys and girls across all grades (Tables 11 and 12). YouTube holds first place among students in grades 4-6 by a significant margin. Seventy percent of boys and 61 percent of girls in those grades selected YouTube; Minecraft, an online game in which players build virtual environments, came in second for boys in this age group at 31 percent while Facebook came in second for girls this age at 22 percent. Among students in grades 4-6, Google and Facebook took up the third and fourth spot with boys and the second and third with girls. Nearly all of the remaining top ten sites for boys this age are sites such as Miniclip (19%),Y8 (9%), Andkon (8%) and Friv (7%) which house collections of short games. Roblox (9%), a multiplayer game similar to Minecraft, is also popular among boys this age at nine percent, while Twitter took the number ten spot with seven percent. While girls also like gaming sites, aside from Friv (9%) their favourite destinations are more likely to be virtual worlds: Webkinz (11%), Moshi Monsters (10%) and Poptropica (9%) are all multiplayer sites where players create a consistent avatar and interact with each other in a playful environment. However, these sites also enable players to chat and share content, suggesting that the line between play/game sites and social media is becoming blurred. Twitter is somewhat more popular among girls at nine percent, while the tenth spot is held by Family.ca, the only site connected to a media outlet and the only Canadian site on the list. Students in later grades tend to prefer video sharing and social media sites over game sites, although Miniclip (number 6) and Minecraft (number 9) remain favourite sites for boys in grades 7-11. The preference for Facebook rises from 22 percent for boys and girls in grades 4-6 to 72 percent of boys and 77 percent of girls in grades 7-11. Twitter, likewise, rises from last place for boys in grades 4-6 (at 7%) and sixth place for girls in grades 4-6 (at 9%), to fourth place for boys in grades 7-11 (at 24%) and third place for girls in grades 7-11 (at 43%). Girls in grades 711 have a particular interest in social media, as Tumblr (number 5), Instagram (number 6) and Pinterest (number 7) appear on their Top 10. Of these sites, only Tumblr (number 7) appear on the boys’ Top 10.. Young Canadians in a Wired World, Phase III: Life Online MediaSmarts © 2014. 26.
(30) Table 11: Top 10 favourite websites grades 4-6: Gender What are your five favourite websites: Grades 4-6 Boys (Grades 4-6) Site. Content. Girls (Grades 4-6) Percent of respondents. Site. Content. Percent of respondents. YouTube.com. Video sharing. 70%. YouTube.com. Video sharing. 61%. Minecraft.net. Gaming. 31%. Facebook.com. Social networking. 22%. Google.ca. Search engine. 27%. Google.ca. Search engine. 20%. Facebook.com. Social networking. 22%. Webkinz.com. Gaming / Virtual pets. 11%. Miniclip.com. Gaming. 19%. MoshiMonsters.com. Gaming / Social networking / Virtual pets. 10%. Y8.com. Gaming. 9%. Friv.com. Gaming. 9%. Roblox.com. Gaming. 9%. Twitter.com. Microblogging / Social networking. 9%. Andkon.com. Gaming. 8%. Poptropica.com. Gaming. 9%. Friv.com. Gaming. 7%. Y8.com. Gaming. 8%. Twitter.com. Microblogging / Social networking. 7%. Family.ca. TV / Entertainment news / Gaming. 8%. Young Canadians in a Wired World, Phase III: Life Online MediaSmarts © 2014. 27.
(31) Table 12: Top 10 favourite websites grades 7-11: Gender What are your five favourite websites: Grades 7-11 Boys (Grades 7-11) Site. Content. Girls (Grades 7-11) Percent of respondents. Site. Content. Percent of respondents. YouTube.com. Video sharing. 83%. YouTube.com. Video sharing. 77%. Facebook.com. Social networking. 72%. Facebook.com. Social networking. 77%. Google.ca. Search engine. 40%. Twitter.com. Microblogging / Social networking. 43%. Twitter.com. Microblogging / Social networking. 24%. Google.ca. Search engine. 36%. Wikipedia.org. Reference. 9%. Tumblr.com. Blogging / Social networking. 31%. Miniclip.com. Gaming. 7%. Instagram.com. Photo / Video sharing / Social networking. 21%. Tumblr.com. Blogging / Social networking. 7%. Pinterest.com. Photo-oriented discovery and collection. 10%. Reddit.com. Social news and entertainment. 6%. Hotmail.com. Email. 8%. Minecraft.net. Gaming. 5%. Netflix.com. Media streaming. 5%. Hotmail.com. Email. 5%. Wikipedia.org. Reference. 5%. Young Canadians in a Wired World, Phase III: Life Online MediaSmarts © 2014. 28.
(32) Opinions about Online Safety. The majority of students, especially girls, are aware of the dangers of talking to strangers online. However, almost all students are confident in their ability to protect themselves online and a majority feel that the Internet is a safe place for them. Almost three-quarters (73%) of students in all grades agree with the statement that “I could be hurt if I talk to someone I don’t know on the Internet” (Table 13); with girls more likely than boys to feel that they could be hurt by online strangers (82% compared to 63% of boys) (Figure 15). However, in general, concerns about talking to strangers are lower in the later grades, peaking at 80 percent in Grade 8 and dropping to a low of 63 percent in Grade 11 (Figure 14). Regardless, a majority of students (56%) agree with the statement that “The Internet is a safe place for me.” Again, gender and grade play a role. Girls are less likely to see the Internet as a safe place (51% compared to 61% of boys), although feelings of safety rise from a low of 50 percent in grades 4 and 7 to a high of 66 percent in Grade 11. Nonetheless, almost all boys (90%) and girls (89%) agree with the statement that “I know how to protect myself online.” Table 13: Opinions: Online safety Do you agree or disagree with the following statements?. Agree Percentage. My parent(s) are worried that I can get hurt online. ♂♀ Grade. 48%. The Internet is a safe place for me. ♂♀ Grade. 56%. I know how to protect myself online. Grade I could be hurt if I talk to someone I don’t know online. ♂♀. Young Canadians in a Wired World, Phase III: Life Online MediaSmarts © 2014. 89% Grade. 73%. 29.
(33) Figure 14: Opinions: Online safety: Grade 100% My parent(s) are worried that I can get hurt online.. 90% 80%. The Internet is a safe place for me.. 70% I know how to protect myself online.. 60% 50%. I could be hurt if I talk to someone I don’t know online.. 40% 30% 20% 10% 0% 4. 5. 6. 7. 8. 9. 10. 11. 90%. 89%. Grade. Figure 15: Opinions: Online safety: Gender 100% 90%. Boy. Girl 82%. 80% 70%. 63%. 61% 60% 52% 50%. 51%. 44%. 40% 30% 20% 10% 0% My parent(s) are worried that I can get hurt online.. The Internet is a safe place for me.. I know how to protect myself online.. Young Canadians in a Wired World, Phase III: Life Online MediaSmarts © 2014. I could be hurt if I talk to someone I don’t know online.. 30.
(34) Parental Involvement. Eighty-four percent of students report that they have household rules about their online activity (Table 14). The most common rules are about posting contact information online (55%), talking to strangers online or on a cell phone (52%), avoiding certain sites (48%), treating people online with respect (47%) and getting together with online acquaintances (44%). High affluence students are more likely than medium affluence students to have a household rule about getting together with online acquaintances (46% compared to 39% of medium affluence students), but there are no differences between the two groups regarding the other rules. Girls are more likely than boys to have household rules in place. This is especially true regarding talking to strangers (21% difference), posting contact information (19% difference), getting together with someone they’ve met online (17% difference), telling parents about anything that makes them uncomfortable online (16% difference) and treating people online with respect (14% difference) (Figure 16). This suggests that girls are more regulated than boys, and may carry additional burdens with respect to their own online safety and the tone of their online interactions. In general, the average number of household rules drops off across the grades (Figures 17 and 18). In particular, fewer students in Grade 11, compared to Grade 4, report having a household rule for telling parents about anything that makes them uncomfortable (45% difference), avoiding certain sites (40% difference) and downloading music, videos, TV shows, movies or software (35% difference). Rules regarding talking to strangers, getting together with online acquaintances and treating people online with respect all peak in grades 7 and 8 (Figure 18). These are the same grades in which students report a growing interest in social media, as opposed to games.. Young Canadians in a Wired World, Phase III: Life Online MediaSmarts © 2014. 31.
(35) Table 14: Household rules about online activity Are there rules in your house about any of these?. Percentage Yes. Downloading music, videos, TV shows, movies, or software Grade. 32%. Posting contact information on the Internet (for example, home address, email) ♂♀ Grade. 55%. Sites you are not supposed to visit ♂♀. Grade. 48%. Telling your parent(s) about anything that makes you uncomfortable online ♂♀ Grade. 38%. Talking to strangers online or on your cell phone ♂♀ Grade. 52%. How much time you are allowed to spend online or on your cell Grade. 31%. Getting together with someone you met online ♂♀ Treating people online with respect ♂♀. Grade. Grade. There are no rules in my house about these things ♂♀ Grade. 44% 47% 16%. Figure 16: Household rules about online activity: Gender. Young Canadians in a Wired World, Phase III: Life Online MediaSmarts © 2014. 32.
(36) Figure 17: Average number of household rules: Grade 5 Average number of household rules. 4.5 4 3.5 3 2.5 2 1.5 1 0.5 0 4. 5. 6. 7. 8. 9. 10. 11. Grade. Figure 18: Household rules about online activity: Grade 100%. Downloading. 90% 80%. Pos ng contact informa on. 70%. Sites not supposed to visit. 60%. Telling parent(s) about anything uncomfortable. 50%. Talking to strangers. 40% Time spent online on your cell phone. 30% 20%. Ge ng together with someone met online. 10%. Trea ng people online with respect. 0% 4. 5. 6. 7. 8. 9. 10. Grade. Young Canadians in a Wired World, Phase III: Life Online MediaSmarts © 2014. 11. There are no rules in my house about these things. 33.
(37) The percentage of household rules about online activities has declined from 2005 to 2013. In our 2005 survey, we also asked students about household rules. With the exception of the rule about treating people with respect, which was only asked in 2013, the percentage of students who report having a household rule (of the rules queried in both surveys) in 2013 is lower than the percentage of students who reported having a rule in 2005 (Table 15). Table 15: Household rules about online activity in 2005 and 2013 Are there rules about any of these in your house? Percentage in 2005. Percentage in 2013. Meeting someone in person whom you got to know online (2005) / Getting together with someone you met online (2013). 74%. 44%. Girls: 85% Boys: 65%. Girls: 52% Boys: 35%. Sites that you are not supposed to visit (2005) / Sites you are not supposed to visit (2013). 70%. 48%. Girls: 74% Boys: 67%. Girls: 51% Boys: 44%. 69%. 52%. Girls: 78% Boys: 61%. Girls: 61% Boys: 40%. 69%. 55%. Girls: 79% Boys: 62%. Girls: 63% Boys: 44%. Telling your parents if you find something that makes you feel uncomfortable (2005) / Telling your parent(s) about anything that makes you uncomfortable online (2013). 49%. 38%. Girls: 55% Boys: 44%. Girls: 46% Boys: 30%. How much time you are allowed to spend on the Internet (2005) / How much time you are allowed to spend online or on your cell (2013). 36%. 31%. Girls: 39% Boys: 32%. Girls: 33% Boys: 30%. Downloading music, videos or software that you are supposed to pay for (2005) / Downloading music, videos, TV shows, movies or software (2013). 46%. 32%. Girls: 51% Boys: 41%. Girls: 35% Boys: 29%. Talking to strangers on the Internet (2005) / Talking to strangers online or on your cell phone (2013). Giving personal information on the Net (2005) / Posting contact information on the Internet (2013). Young Canadians in a Wired World, Phase III: Life Online MediaSmarts © 2014. 34.
(38) Students with household rules are less likely to post their contact information, visit gambling sites, seek out online pornography or talk to strangers online. Some students report that they take part in online activities that many adults consider to be risky, including posting contact information, visiting gambling sites, seeking out online pornography and talking to people they have met online but have never met in person (Table 16). Although the majority of students do not participate in any of the four activities, a fairly large number talk to online acquaintances (43%) or post their contact information (29%). Boys are more likely to do so than girls and both behaviours are more common in the later grades. Because these activities increase as more students report feeling safe online, and the vast majority of students in all grades feel that they know how to protect themselves online, this suggests that students may have different ideas from adults of what is and is not risky online behaviour. It is also possible that some students engage in activities they consider risky because they enjoy risk-taking behaviour. Table 16: What are students doing online? Do you do the following things At online? least once a day. At least once a week. At least once a month. At least once a year. Less than once a year. Never. Talk to people you have met online but have never met in person ♂♀ Grade. 9%. 8%. 9%. 7%. 9%. 57%. Play online games that involve betting with real money (for example, slot machine, poker) ♂♀ Grade. 2%. 2%. 2%. 2%. 3%. 89%. Look for pornography (Grade 7-11 only) ♂♀ Grade. 8%. 7%. 4%. 2%. 2%. 77%. Post your contact information (for example, your home address, email). 2%. 3%. 6%. 7%. 12%. 71%. Grade. However, as we found in 2005, the presence of household rules in 2013 correlates with less risky online behaviour on the part of students. More students with rules about not posting contact information on the Internet report that they never post contact information (78% compared to 64% without this rule) (Figure 19); more students with rules about sites they are not supposed to go to never visit online gambling sites (94% compared to 88% without this rule) (Figure 20) or look for pornography online (86% compared to 72% without this rule) (Figure 21); and more students with rules about talking to strangers online never do this (68% compared to 48% without this rule) (Figure 22).. Young Canadians in a Wired World, Phase III: Life Online MediaSmarts © 2014. 35.
(39) Figure 19: Posting rule and frequency of posting information online. Figure 20: Site rules and visiting online gambling sites 100%. 94%. 90%. Site rules. 88%. No site rules. 80% 70% 60% 50% 40% 30% 20% 10% 1%. 1%. 1%. 2%. 1%. 3%. 1%. 2%. 2%. 3%. 0% At least once a day. At least once a week. At least once a month. At least once a year Less than once a year. Young Canadians in a Wired World, Phase III: Life Online MediaSmarts © 2014. Never. 36.
(40) Figure 21: Site rules and looking for pornography online 100% 90%. Site rules. 86%. No site rules. 80% 72% 70% 60% 50% 40% 30% 20% 10%. 9%. 9% 4%. 3%. 3%. 5% 1%. 2%. 2%. 3%. 0% At least once a day. At least once a week. At least once a month. At least once a year Less than once a year. Never. Figure 22: Talking to strangers online rule and actual behaviour 100% 90%. Talking to stranger rule. No talking to stranger rule. 80% 68%. 70% 60%. 48%. 50% 40% 30% 20% 10%. 14% 5%. 11% 5%. 8%. 11% 6%. 7%. 8%. 9%. 0% At least once a day. At least once a week. At least once a month. At least once a year Less than once a year. Young Canadians in a Wired World, Phase III: Life Online MediaSmarts © 2014. Never. 37.
(41) The percentage of students who are “usually” online at home with a parent or other adult increased from 2005 to 2013, and the percentage who are “never” online at home with a parent or adult decreased from 2005 to 2013. While rules about Internet use have decreased in Canadian homes, the percentage of kids spending time online with a parent or other adult has actually increased slightly since 2005. Overall, 18 percent of students say they are “usually” with a parent or other adult when they surf at home. Forty percent say they are “rarely” and 40 percent are “never” with a parent (Table 17). This contrasts with the findings of our 2001 and 2005 surveys. On average across 2001 and 2005, 10 percent were “mostly” with a parent, 38 percent were “sometimes” with a parent, and 52 percent were “never” with a parent when they were online at home. This suggests that many students seem to be sharing their online activities with their parents. Table 17: Sharing online activities with parents/adults at home When you use the Internet at home, are you with a parent or other adult? Grade. Percentage in 2013. Usually. 18%. Rarely. 40%. Never. 40%. I don’t use the Internet at home. 2%. Figure 23: Sharing online activities with parents/adults at home: Gender 100% 90%. Boy. Girl. 80% 70% 60% 50% 41%. 39%. 40%. 43% 38%. 30% 20% 20%. 16%. 10% 2%. 2%. 0% Usually. Rarely. Never. Young Canadians in a Wired World, Phase III: Life Online MediaSmarts © 2014. I don’t use the Internet at home. 38.
(42) Not surprisingly, co-presence with a parent or other adult is much higher for younger students than for older students: 31 percent (“usually”) and 44 percent (“rarely”) for Grade 4, dropping to 9 percent (“usually”) and 29 percent (“rarely”) by Grade 11 (Figure 24). However, it is concerning that a substantial percentage of younger students “never” sit with an adult or parents when online – almost one third of students in grades 4-6. This reinforces the need for education interventions to teach children digital literacy skills so they can make wise and healthy decisions about their online activities. Figure 24: Sharing of online activities with parents/adults: Grade 100% Usually 90% Rarely 80% Never 70% I don’t use the Internet at home. 60% 50% 40% 30% 20% 10% 0% 4. 5. 6. 7. 8. 9. 10. 11. Grade. Sharing at-home online activities with parents is linked to the number of household rules (Figure 25). Students who report a lower number of household rules are more often surfing alone. Conversely, students reporting more household rules are more often surfing (either usually or rarely) with a parent present.. Young Canadians in a Wired World, Phase III: Life Online MediaSmarts © 2014. 39.
(43) Figure 25: Relationship between number of household rules and percentage of students who are supervised while online at home 100% Usually 90% Rarely 80% Never 70% 60% 50% 40% 30% 20% 10% 0% 0. 1. 2. 3. 4. 5. 6. 7. 8. Number of rules. The good news is that along with teachers, parents are teaching young people about online issues. Almost half (45%) of students of all ages report that they have learned about online issues (including authentication of online information, privacy, offensive content, cyberbullying, online safety and online legality) from their parents, compared to 41 percent who have learned this from teachers, 18 percent who have learned from friends and 19 percent who have learned from reading about the issues online (Table 18)10.. 10. French language students in Quebec were more likely to respond that they had never learned how to search for information online (18% compared to 6% of English language students), how companies collect and use personal information online (51% compared to 33% of English language students) or how to use privacy settings (42% compared to 17% of English language students) than English language students in the rest of Canada. Young Canadians in a Wired World, Phase III: Life Online MediaSmarts © 2014. 40.
(44) Table 18: Learning about online activities I have learned about the following From my activities parent(s). Grade. How to search for information online How to tell if online information is true How to use privacy settings. From From teachers friends. 47%. ♂♀ Grade 45%. Grade. Grade. 37%. ♂♀ 45%. Grade. Grade. Grade. From reading about it online. I have never learned about this. 28%. ♂♀ Grade 21%. 8%. Grade. Grade. Grade. 15%. ♂♀ 17%. 20%. Grade. Grade. Grade. 24%. 18%. Grade. ♂♀ Grade 34%. ♂♀ 41%. 15%. ♂♀ 27%. Grade. Grade. Grade. 35%. 24%. 10%. ♂♀ 20%. Grade. 21%. ♂♀ Grade 17%. 24%. How companies collect and use personal information online How to deal with hateful, racist or sexist online information (grades 711 only). ♂♀ 39%. ♂♀ 39%. How to deal with cyberbullying. ♂♀ Grade 43%. ♂♀ Grade 62%. Grade. Grade. Grade. 15%. 13%. 14%. Grade. ♂♀ 64%. Grade. ♂♀ 53%. Grade. Grade. 14%. ♂♀ 16%. ♂♀ 9%. Grade. Grade. Grade. 17% 18%. How to be safe online How to know what is legal and illegal to do online. ♂♀ 58%. ♂♀ 42%. 15%. ♂♀ Grade 20%. 45%. 41%. 18%. 19%. Average. Parents and teachers play a primary role in helping children and teens develop digital literacy skills. Students in grades 4-6 are on average more likely to learn from parents than from teachers with respect to all issues, with the exception of cyberbullying (Table 19). This stresses the importance of providing parents as well as teachers with resources and tools to address various online issues.. Young Canadians in a Wired World, Phase III: Life Online MediaSmarts © 2014. 41.
(45) Table 19: Learning about online issues from parents and teachers (Grades 4-6) I learned about the following activities From my parent(s) From my teachers How to search for information online. 61%. 40%. How to tell if online information is true. 48%. 40%. How to use privacy settings. 50%. 14%. How companies collect and use personal information online. 39%. 16%. How to deal with hateful, racist or sexist online information. 44%. 40%. How to deal with cyberbullying. 51%. 58%. How to be safe online. 75%. 50%. How to know what is legal and illegal to do online. 70%. 38%. Young Canadians in a Wired World, Phase III: Life Online MediaSmarts © 2014. 42.
(46) Unplugging. There are a number of indications that young Canadians are more plugged into online media than ever before: a virtually universal rate of access; the high penetration of social media, especially in high school; and the proliferation of portable networked devices like cell phones and tablets. The extent to which many young people feel the need to be connected at all times is perhaps best reflected in the finding that 39 percent of students who have cell phones (37% of boys and 39% of girls) sleep with their cell phone in case they get calls or messages in the night (Table 20). The trend increases across grades to a peak at just over half (51%) of Grade 11 students, but one-fifth of all students in Grade 4 also report that they do the same thing (Figure 27). Table 20: Sleeping with cell phone Percentage Yes Do you sleep with your cell phone in case you get calls or messages in the night? Grade. 39%. Figure 26: Sleeping with cell phone: Gender 100% 90%. Boy. Girl. 80% 70% 60% 50% 40%. 37%. 39%. 30% 20% 10% 0% Do you sleep with the cell phone in case you get calls or messages in the night? Yes. Young Canadians in a Wired World, Phase III: Life Online MediaSmarts © 2014. 43.
(47) Figure 27: Sleeping with cell phone: Grade 100% Do you sleep with the cell phone in case you get calls or messages in the night? Yes. 90% 80% 70% 60% 50% 40% 30% 20% 10% 0% 4. 5. 6. 7. 8. 9. 10. 11. Grade. At the same time, there are some interesting counterpoints, suggesting that young people may be less plugged in than many adults assume. For example, just over one-third (35%) of students worry that they spend too much time online (Table 21). Although girls are more likely than boys to worry about this (40% compared to 31% of boys) (Figure 28), the percentage of students as a whole is fairly consistent across the grades (Figure 29). Table 21: Concerns over time online Do you ever worry that you spend too much time online? ♂♀. Percentage Yes. Yes. 35%. No. 65%. Young Canadians in a Wired World, Phase III: Life Online MediaSmarts © 2014. 44.
(48) Figure 28: Concerns over time online: Gender 100% 90%. Boy. Girl. 80% 70% 60% 50% 40% 40% 31% 30% 20% 10% 0% Yes. Figure 29: Concerns over time online: Grade 100% Yes 90% 80% 70% 60% 50% 40% 30% 20% 10% 0% 4. 5. 6. 7. 8. 9. 10. 11. Grade. In addition, when asked how they would feel if they could not go online for anything other than school work for a week, just under half (49%) say they would be upset or unhappy (Table 22). English language students outside of Quebec are more likely to be upset than French language students in Quebec (51% compared to 40% of French language students). However, 46 percent Young Canadians in a Wired World, Phase III: Life Online MediaSmarts © 2014. 45.
(49) of all students indicate they would not care one way or the other and five percent report that they would be relieved or happy to go offline. Responses are practically identical between genders and students in grades 9-12 are more likely to feel upset/unhappy than students in grades 4-6 (Figure 30). Table 22: Being offline for a week How would you feel if you could not go online FOR ANYTHING OTHER THAN SCHOOL WORK for a week? Grade. Percentage. I would be upset/unhappy. 49%. I would be relieved/happy. 5%. I would not care one way or the other. 46%. Figure 30: Being offline for a week: Grade 100% 90%. I would be upset/ unhappy. 80%. I would be relieved/ happy. 70%. I would not care one way or the other. 60% 50% 40% 30% 20% 10% 0% 4. 5. 6. 7. 8. 9. 10. 11. Grade. Ninety-four percent of students choose to go offline to do other things, like spend more time with friends or family, enjoy some quiet time by themselves or go outside. Almost all (94%) students report that they have chosen to unplug in order to enjoy other aspects of their lives, including spending more time with friends or people in their family (77%), going outside or playing a game or sport (71%) or to avoid online conflict (17%) (Table 23). More girls than boys report that they have chosen to go offline, with the exception of going offline to go outside or play a game or sport (69% compared to 73% of boys). Although students in the early. Young Canadians in a Wired World, Phase III: Life Online MediaSmarts © 2014. 46.
(50) grades are more likely to go outside or read a book, students in grades 8-11 are more likely to go offline to enjoy some quiet time by themselves.11 Table 23: Going offline voluntarily Do you ever choose to go offline so you will have more time to do any of these things?. Percentage. Spend more time with friends or people in your family ♂♀. 77%. Avoid someone who is harassing you ♂♀. 17%. Enjoy some quiet time by yourself ♂♀ Grade. 45%. Read a book ♂♀. Grade. Go outside or play a game or sport. 44% Grade. Other I never choose to go offline to do any of these things ♂♀. 71% 35% 4%. Figure 31: Going offline voluntarily: Gender. 11. English language students outside Quebec report in larger numbers than French language students in Quebec that they chose to go offline to enjoy quiet time by themselves (48% compared to 20% of French language students). Young Canadians in a Wired World, Phase III: Life Online MediaSmarts © 2014. 47.
(51) Figure 32: Going offline voluntarily: Grade 100% Spend more me with friends or people in your family Avoid someone who is harassing you. 90% 80%. Enjoy some quiet me by yourself. 70% 60%. Read a book. 50% Go outside or play a game or sport. 40%. Other 30% I never choose to go offline to do any of these things. 20% 10% 0% 4. 5. 6. 7. 8. 9. 10. 11. Grade. Young Canadians in a Wired World, Phase III: Life Online MediaSmarts © 2014. 48.
(52) Methodology. This report is based on the findings of a survey that was administered in 2013 to 5,436 Canadian students in grades 4 through 11. The purpose of the survey was to explore the benefits and challenges children experience when they use networked devices such as computers, tablets, cell phones and iPods. The survey explored the social codes young people develop with respect to their online social interactions and their attitudes about online issues such as privacy, cyberbullying, sexting and offensive and hateful content. It also explored the ways young people use online media to support their learning (both in and out of school) and to create new content. The survey instrument, consent documents, recruitment text, instructions and method of analysis were approved by the University of Ottawa Research Ethics Board. Recruitment Students were recruited through school boards and schools in all 10 provinces and three territories. MediaSmarts contacted school boards that had participated in its 2005 survey. Additional school boards were also contacted. In total, 51 school boards (44 English and 7 French) agreed to assist in recruitment and all requisite board approvals were then obtained. In Nunavut and the Northwest Territories approval was also obtained from territorial research institutes and the school boards’ district education councils. MediaSmarts then contacted principals of schools within participating school boards. The principals of schools that had participated in the 2005 survey were asked to provide access to the same number of classes and grade levels for the 2013 survey. Principals of new schools were asked to provide access to classes with teachers who were willing and able to assist with recruitment. In total, 140 schools (126 English and 14 French) agreed to assist with recruitment. The schools included a representative selection of urban and rural and public and Catholic schools. Principals then approached teachers and asked them to assist with student recruitment. Teachers who agreed to do so received the survey documents from Directions Evidence and Policy Research Group (Directions). Survey documents included: student information letters; detailed parental consent forms; instructions for teachers; and (where applicable) paper copies of the survey. Teachers distributed the student information letters and parental consent forms to students in specific classes approved by the principal. Students interested in participating were asked to take the information home to their parents. Parental consent forms for all participating students were signed and returned to the teacher by the students. Young Canadians in a Wired World, Phase III: Life Online MediaSmarts © 2014. 49.
Figure
+7


Related documents
If you feel that you should not answer the question (you shouldn't have to, after all) or that you are not interested in working for the company, you may state, "I don't
There has been long standing concern about young people with mental health problems getting lost to care in their move (transition) from child and adolescent
Unused digital input pins must always be tied to an appropriate logic voltage level (e.g., either GND or V CC ).. Unused Analog I/O pins may be left open
The Junos Space application portfolio currently includes Ethernet Design (rapid endpoint and switch port configuration in campus/data center environments), Security Design
Oscillation theory for second order linear, half-linear, superlinear and sublinear
Even if this note is not the first one to deal with this convexity adjustment problem, it improves existing results by taking care of all the relevant dates, including the
• Language Requirements for International Students: International students, whose native language is not English, must demonstrate proficiency in the English language by submitting
