Voter Beliefs and Strategic Voting in Two-Round
Elections
Luke Plutowski
∗Rebecca Weitz-Shapiro
†Matthew S. Winters
‡November 2019
Abstract
How widespread is strategic voting in two-round electoral systems, and which types of voters are most likely to engage in such behavior? While runoff elections are common in presidential systems around the world, there is limited research on strategic voting in these settings. This paper explores the different types of strategic behavior that are possible in two-round systems, including some forms of strategic behavior, such as “strong-to-weak” strategic voting, which are not possible in single-round elections. We use a nationwide survey to assess the incidence and correlates of strategic voting in Brazil’s 2018 presidential election, where 13 candidates competed in the first round. We find evidence of “weak-to-strong” strategic voting at a similar rate to that documented in single-round elections in other countries. We find little evidence of other types of strategic voting. The strongest predictors of strategic voting are voters’ confidence in their predictions of the likely electoral outcome and their opinions of the Worker’s Party (PT). These results point to the importance of using voter beliefs and attitudes rather than objective voter characteristics to explain strategic voting.
∗Corresponding author. Ph.D. Candidate, Department of Political Science, University of Illinois
Urbana-Champaign
†Associate Professor of Political Science, Brown University
Introduction
As far back as Downs (1957), scholars have acknowledged that rational voters “may at times vote for a party other than the one [s]he most prefers” (47). This behavior, casting a ballot for a candidate or party who is not the voter’s first choice in order to maximize her influence over the election result (and therefore her own utility) is commonly referred to as “strategic voting.” Historically, scholarship on strategic voting has focused mainly on single-round plurality elections, like those in the U.S., U.K., and Canada (Alvarez and Nagler 2000; Cain 1978; Blais and Nadeau 1996; Cox 1997; Myatt 2007). A small but growing empirical literature has examined how strategic considerations affect voting decisions in two-round (runoff) systems (Blais 2004; Blais et al. 2011; Fujiwara 2011; Weitz-Shapiro and Winters 2019).
This study makes three contributions to the literature on strategic voting in two-round systems. First, while previous work has documented the existence of strategic voting in some runoff elections, the existing literature does not articulate clear expectations about the
kinds of strategic voting that are most likely. The addition of a second round creates the possibility of multiple types of strategic voting which are not possible under simple plurality rules; for instance, voters who sincerely support leading candidates may vote strategically if the candidate has poor polling numbers in runoff scenarios (Van der Staeten, Laslier, and Blais 2016). In settings where multiple varieties of strategic voting are possible, this paper contributes to our understanding of which, if any, of these types actually occur.
Third, studies of strategic voting in two-round elections, and studies of strategic voting in general, overwhelmingly focus on developed, stable democracies. Some researchers have argued that strategic voting is uncommon where democratic institutions are new or weak (Moser and Scheiner 2009), while others have found rates of strategic voting in developing democracies comparable to those found in Western Europe (Weitz-Shapiro and Winters 2019). This study contributes new information to this debate by estimating the prevalance of strategic voting in a large, middle-income democracy with relatively low levels of mass partisanship.
Empirically, we conducted a survey with a nationwide sample of around 2,200 Brazilian voters in the lead up to the country’s 2018 presidential election. Brazil has a two-round system in which the top two candidates in the first round advance to a runoff if no candidate achieves more than 50% of the valid votes.1 Pre-election press and polling suggested that multiple types of strategic voting were likely to occur in this election.
Results from our survey suggest that only one type of strategic voting occurred to any meaningful degree: what we call “weak-to-strong” strategic voting, wherein supporters of several nonviable candidates switched their vote choice toward the most popular candidate, Jair Bolsonaro (PSL). We estimate that around 6.4% of the Brazilian electorate voted this way, a figure comparable to estimates of strategic voting from elections in long-standing wealthy democracies. The lack of empirical evidence for other types of strategic voting – for example, supporters of a strong candidate voting strategically to advance a weak second-round candidate – suggests that although two-second-round systems produce incentives for a variety of types of strategic voting, some of these types may be too complex or uncertain for voters to employ them.
This proposition is supported by evidence from the second part of the study. We show that voters’ level of confidence in their belief about the outcome of the first-round election is the strongest predictor of whether those who could vote strategically actually do so. That
is, those who are highly uncertain about the results of the election do not switch their vote away from their sincere preference. Once we account for voter certainty in their election predictions, we find null effects for commonly used predictors of strategic voting, such as education, political knowledge, and income. In addition, we find the likelihood of strategic voting increases when voters have an ideological preference between the top candidates. These results suggest that voters’perceptions that a strategic vote would be beneficial explain strategic voting better than objective demographic or political characteristics.
Defining and Measuring Strategic Voting
A vote is considered strategic if it is used to maximize influence over the electoral outcome rather than to express a true preference among all choices. In other words, a strategic voter has a favorite among all candidates in the field, but she chooses not to vote for that candidate out of the belief that she can advance her interests more effectively by voting for another candidate. This implies that strategic voting depends critically on two factors: the voter’s preferences about the field of candidates and her perception that her ballot may make a greater impact if she deviates from her first choice. The exact form that these conditions must take for a vote to be considered strategic depend on the electoral dynamics at hand.
Electoral Institutions and Strategic Voting
The term strategic voting is most commonly employed in the context of single-member district plurality (SMDP) systems to describe the phenomenon in which voters who support third parties abandon their first choice and vote for one of the top two parties/candidates (Alvarez and Nagler 2000; Blais 2002; Blais et al. 2001; Cain 1978; Myatt 2007). The logic is that strategic voters cast their ballot for one of the top candidates out of a desire to not “waste” their vote (Blais et al. 2001).
(Cox and Shugart 1996; Lago 2008; Shikano, Herrmann, and Thurner 2009), multimember districts (Cox 1984; Cox 1994), multivote elections (Aldrich, Blais, and Stephenson 2018), and mixed systems (Karp et al. 2002; Gschwend 2007), voters have strategic incentives sim-ilar to those present under SMDP, namely, that voters avoid wasting their vote on nonviable parties. Each of these electoral systems also presents the possibility of different, unique types of strategic behavior. Under the single nontransferable vote (SNTV),2 for example, voters who sincerely support the strongest candidate may use their votes strategically to help elect another candidate who is on the edge of the vote threshold (Cox 1994).
The literature offers differing theoretical perspectives on whether runoff elections generate incentives for strategic behavior. On the one hand, some observers express the view that two-round systems should, by design, discourage strategic voting. As Payne summarizes, “Voters are more free to express their true preferences in the first round, since they will have a second opportunity to choose among the two most viable candidates” (Payne et al. 2002, 69; see also Duverger 1951, P´erez-Li˜n´an 2006, and Piketty 2000). Niou (2001) finds that strategic voting occurs less often in runoff systems than under plurality rules and that the addition of a second round guarantees the election of the Condorcet winner if one exists.
On the other hand, some voters under two-round systems retain an incentive to vote strategically. Even though voters have the opportunity to express a preference among the top candidates in the second round, supporters of nonviable candidates are still “wasting” their votes in the first round if they vote according to their true preference (Cox 1997). Bouton’s (2013) theoretical work shows the existence of multiple equilibria in which only two candidates win votes, and Bouton and Gratton (2015) find that no equilibrium exists in which all voters vote sincerely.
To the extent that incentives to vote strategically do exist in runoff systems, the nature of that strategic voting may vary. As in plurality systems, voters who support weak candidates may instead vote for one of the leading candidates to help them win a majority in the
first round. Those same voters might also vote for a strong candidate in order to help them advance to the second round. This type of strategic voting does not exist in plurality systems, although the logic is familiar. We call these two types of behavior “weak-to-strong” strategic voting. In addition, two-round systems open the possibility for strategic voting of a completely different kind. In “strong-to-weak” strategic voting, also known as “pushover”, sincere supporters of leading candidates vote for an electorally weaker candidate in the first round. The goal may be to ensure that a strongly disliked candidate does not reach the second round or to maximize the most-preferred candidate’s chance of winning in the runoff by supporting a weaker rival. The exact type(s) of strategic voting that emerge(s), whether weak-to-strong or strong-to-weak, will depend on specific features of a given election, such as the number of competitors, their ideological positions, and the relative strength of each of the candidates.
Empirically, no clear patterns of strategic voting in two-round systems have emerged. Cox (1997) argues that, in spite of his theoretical findings, it is unlikely that many people actually vote strategically in two-round systems given the informational complexity involved (137). In this vein, Blais (2004) examines data from the 2002 French presidential elections and finds little evidence of voters abandoning nonviable candidates to support more popular ones. However, other research finds evidence of strategic voting in runoff elections. In an experimental setting, Blais et al. (2011) find that participants do indeed weigh candidate viability in their vote choices under two-round rules, although to a lesser extent than in a one-round system. Evidence from Hungary (Kiss 2015) and Argentina (Weitz-Shapiro and Winters 2019) also suggests strategic voting does take place in runoff systems.
Correlates of Strategic Voting
Vivyan 2017; Fisher 2004) or mixed electoral systems (see Karp et al. 2002; Gschwend 2007). Few studies have examined runoff systems. This is an important omission because the individual-level factors which drive strategic voting in one system may not hold in another. For example, complex electoral environments may require greater political knowledge on the part of voters to maximize the effect of their ballot, where more simple systems may allow for strategic behavior among relatively less sophisticated voters.
We examine several individual-level factors that commonly predict strategic voting to see whether results from previous studies hold in the case of a two-round election. Current literature suggests that five key variables may help explain an individual’s propensity to cast a strategic vote.
First, political sophistication may increase the likelihood of voting strategically. Those with high levels of general political knowledge have been found to be more averse to “wasting” their vote and more likely to understand and use complex electoral rules to their advantage (Karp et al. 2002; Gschwend 2007). Greater familiarity with the “rules of the game” should lead citizens to make voting decisions with an eye towards maximizing the impact of their votes.
Next, we predict that those with a stronger preference among the top candidates will be more likely to vote strategically (Blais and Nadeau 1996; Fisher 2004; Karp et al. 2002; Weitz-Shapiro and Winters 2019). Those who do not care which of the top vote-getting candidates will advance to the second round or win the presidency have no incentive to vote strategically. In contrast, those who have strong feelings, positive or negative, toward the leading candidates will be more motivated to use their vote to influence who advances to the second round.
We also identify two standard demographic variables which may predict strategic voting: socioeconomic status (SES) and level of formal education. Eggers and Vivyan (2017) find that high-income voters were much more likely to vote strategically in British elections. Several studies have found education is correlated with strategic voting (Black 1978; Merolla and Stephenson 2007; Niemi, Whitten, and Franklin 1992). These results could be driven by class-based differences in policy preferences, political interest, participation, or knowledge.
The Brazil Case
We conduct our research in Brazil, a country whose presidential elections feature a two-candidate runoff if no two-candidate wins a simple majority of valid votes in the first round. Two-round systems are common in Latin America (P´erez-Li˜n´an 2006), where, additionally, many political systems are marked by large numbers of parties and relatively weak party environments (Coppedge 2018; Kitschelt et al. 2010; Mainwaring and Scully 1995). As noted above, this creates the possibility of complex forms of strategic voting, and yet to date, few authors have examined the dynamics of strategic voting in the region.
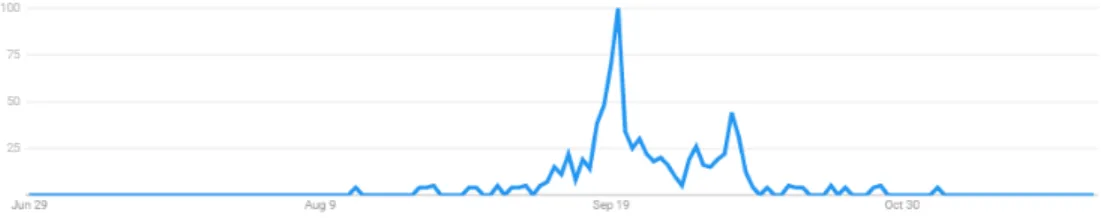
most preferred to help prevent the victory of another they disfavored.3 As shown in Figure 1, Google searches for the term “voto ´util” (literally, “useful vote”, the Portuguese term for strategic voting) spiked around three weeks before the election, with another uptick occurring just days before the date of the first-round election (October 7).4
Figure 1: Google Search Interest for “Useful Vote” During 2018 Campaign
Two main factors made strategic voting particularly likely in 2018. First, the candidate field was crowded. Over a dozen candidates entered the presidential race. There was no in-cumbent or clear favorite; until late September, opinion polls showed the leading candidate with only around 30% of the likely vote. Since many candidates were non-viable, there was a large pool of voters who could weigh strategic considerations. Second, the political environ-ment in Brazil was very polarized during this campaign. The top two candidates, Bolsonaro and Lula/Haddad, also had the highest rejection rates (i.e., were candidates for whom re-spondents said they would never vote), which could lead more voters to act strategically (Weitz-Shapiro and Winters 2019).
Strategic Voting Possibilities in the 2018 Presidential Election
Amid an economic crisis, an enormous corruption scandal, high and rising crime rates, and subsequent nationwide protests, Brazil’s 2018 presidential elections took place in a turbulent political environment. The powerful leftist Worker’s Party (PT) was expected to make a
3Survey question (author translation): “Would you vote for a candidate that is not your preference
to prevent another you do not like from winning?” From: Grillo, Marco, Jeferson Ribeiro and Fernanda Krakovics. “Ibope: um ter¸co do eleitorado est´a propenso a dar voto ´util para evitar vit´oria de candidato que rejeita.”O Globo. September 19, 2018.
4The reason for the September 20 peak is not immediately clear, but the IBOPE poll had been released
strong showing in 2018 with the return of hugely popular former president Luiz In´acio Lula da Silva (“Lula”) as a candidate. Lula, however, was found guilty on bribery charges and replaced as the PT candidate by former S˜ao Paulo mayor Fernando Haddad, who did not command the same level of name recognition or personal popularity as Lula. Divisive member of Congress Jair Bolsonaro (PSL) steadily gained popularity as a presidential candidate via a law-and-order and anti-establishment brand. Ultimately, Bolsonaro went on to win handily, receiving 46% of valid votes in the first round and 55% in the second round against Haddad. Table 1 displays the profiles of the largest vote-getting presidential candidates in the 2018 race. For each candidate, we list their party, approximate ideological position, and the percentage of valid votes that they received in the first round. In addition, the table shows the candidates’ polling numbers according to a Datafolha survey conducted two days before the October 7 election. We report the candidates’ share of vote intentions as a percentage of both total votes and valid votes.
Table 1: Brazil’s Presidential Candidates, 2018
Party Ideology Polling (Total)
Polling (Valid)
Results (Valid)
Jair Bolsonaro PSL Right 36% 40% 46.0%
Fernando Haddad PT Left 22% 25% 29.3%
Ciro Gomes PDT Center-left 13% 15% 12.5%
Geraldo Alckmin PSDB Center-right 7% 8% 4.8%
Jo˜ao Amoˆedo NOVO Center-right 3% 3% 2.5%
Cabo Daciolo PATRI Right 1% 1% 1.3%
Henrique Meirelles MDB Center-right 2% 2% 1.2%
Marina Silva REDE Center-left 3% 3% 1.0%
Alvaro Dias PODE Center-right 2% 2% 1.0%
Guilherme Boulos PSOL Left 1% 1% 0.6%
Notes: Ideology ratings were drawn from field research and media accounts. (See Alves, Jorge Antonio. “Brazilian voters wanted change - and they got it. Now what happens?”
Washington Post Money Cage Blog, October 10 2018.) It is notoriously difficult to define the ideology of Brazilian politicians, but Bolsonaro was firmly to the right and Haddad to the left. “Valid” excludes abstentions, null and blank ballots, and “don’t know” responses.
type possible in SMDP elections, as well as “strong-to-weak” strategic choices, which are possible in other electoral systems. We focus on three main strategic voting scenarios that received the most attention in the Brazilian press and from candidates. These particular scenarios were likely due to the ideological and polling positions of the candidates competing in this election.
First, true supporters of trailing candidates might vote strategically for the leading can-didate, Bolsonaro, to help him reach the 50% threshold needed to avoid a runoff election; this is an example of weak-to-strong strategic voting. Polling indicated that a runoff between Bolsonaro and Haddad would be very close. Supporters of trailing center-right candidates who disliked Haddad might have decided to abandon their first-choice candidates in hopes of avoiding a return to a PT government. One Amoˆedo sympathizer stated that she would be voting for Bolsonaro because “I do not vote for the left in any form... Haddad is unprepared, a lapdog of a convict...”5 Weeks before the first round, Jair Bolsonaro’s son and current Sen-ator Fl´avio Bolsonaro stated on Twitter that “Bolsonaro might be an Amoedo or an Alvaro Dias from winning in the first round.”67
A second strategic voting scenario was the possibility that supporters of the leftist candi-dates would vote for the third-place candidate (Ciro Gomes, PDT) to have a better chance of defeating the first-place candidate (Bolsonaro, PSL) in the second round. Various polls suggested that Ciro had the highest rate of second-vote intention (i.e. the candidate the respondent most prefers after their first choice), a very low rejection rate, and a very high chance of defeating Bolsonaro (and any other candidate) in a runoff election.8 For voters on the left who feared a Bolsonaro presidency, it might have made strategic sense to vote for the center-left Ciro in the first round, even if he was not their most preferred candidate. This attitude was expressed by one voter, who stated: “I am only going to decide whom I will
5Estˆenio Brasilino, Carlos. “Conhe¸ca o voto ´util, fiel da balan¸ca nas elei¸c˜oes polarizadas de 2018.”
Metr´opoles. September 23, 2018
6Borges, Rodolfo. “Contra Bolsonaro ou PT, o voto ´util promete definir os rumos para o segundo turno.”
El Pa´ıs. September 17, 2018
7All translations by authors
vote for in the final weekend, taking into account the criteria that is most important which is that the candidate that goes to the second round will have the best chance of defeating Bolsonaro.”9 This scenario is a mix of weak-to-strong and strong-to-weak strategic voting, as Ciro may have picked up votes from the second-place candidate (Haddad) and weaker leftist candidates (Marina, Boulos).
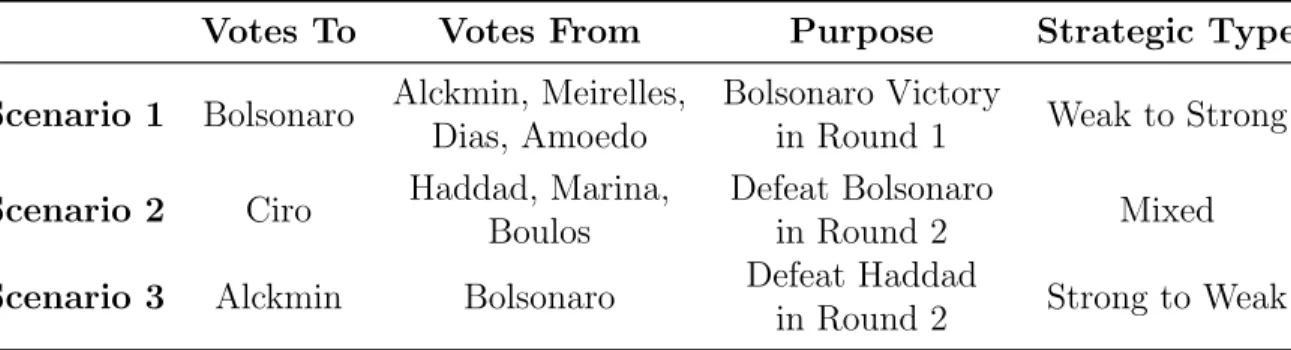
A third possibility, a strong-to-weak scenario, is that true supporters of the leading candidate (Bolsonaro) may have abandoned their preferred right-wing candidate to vote for the center-right fourth-placed candidate (Alckmin, PSDB) in order to have a better chance of defeating the leftist Haddad in the second round. Alckmin frequently claimed that his poll numbers in a potential second-round match against Haddad were much more favorable than those of Bolsonaro. “I see that Bolsonaro is a passport for returning to the PT. That is a fact. Just look at the second round... you vote for one and elect the other,” he stated.10 Table 2 summarizes these three possible situations. For each potential strategic voting situation, we list which candidate is likely to benefit from strategic voting (“Votes To”), which candidate(s) will be hurt by strategic voting (“Votes From”), the goal motivating the strategic voting (“Purpose”), and whether the scenario is strong-to-weak or weak-to-strong (“Strategic Type”).
Table 2: Strategic Voting Possibilities
Votes To Votes From Purpose Strategic Type
Scenario 1 Bolsonaro Alckmin, Meirelles, Dias, Amoedo
Bolsonaro Victory
in Round 1 Weak to Strong Scenario 2 Ciro Haddad, Marina,
Boulos
Defeat Bolsonaro
in Round 2 Mixed
Scenario 3 Alckmin Bolsonaro Defeat Haddad
in Round 2 Strong to Weak
Note that these represent only the three empirically most likely strategic voting choices
9Estˆenio Brasilino, Carlos. “Conhe¸ca o voto ´util, fiel da balan¸ca nas elei¸c˜oes polarizadas de 2018.”
Metr´opoles . September 23, 2018.
10Borges, Rodolfo. “Contra Bolsonaro ou PT, o voto ´util promete definir os rumos para o segundo turno.”
in the 2018 elections. Two-round multi-candidate elections create many possible strategic voting scenarios, and so we focus on those that were strategically sound, received press attention, and involved the leading candidates.11
Research Design & Data
Empirically, this paper has two goals: First, to assess the extent to which the three strategic voting scenarios outlined in the previous section actually occurred; and second, to examine which types of voters were most likely to vote strategically. To this end, we conducted an original survey with Brazilian voters in the three days prior to the first round of the 2018 general elections. The survey was conducted online with a convenience sample recruited by the market research firm Offerwise (see appendix for details about recruitment and sampling procedures). In total, 2,226 people were interviewed.
To increase representativeness, we created post-stratification weights to achieve distribu-tions on gender, region, and socioeconomic status that are more reflective of the population of Brazil (see the appendix for sample and population distributions of these variables). Our survey, as with many online convenience samples, oversamples wealthy respondents; only 13.3% of our sample is from the lowest socioeconomic classes (D & E), whereas those classes make up 28.0% of the Brazilian population. Our sample contains more respondents who are female and who are from the South than would be expected in a true random sample.
Measuring Strategic Voting
Scholars have generally taken three approaches to measuring strategic voting (Alvarez and Nagler 2000). First, some infer strategic voting using aggregate-level results such as cross-constituency differences (Cain 1978), shifts in vote shares across elections (Spafford 1972), or differences between actual vote shares and those expected by theory (Cox 1994). This
11Because we define strategic voting based on voters’ beliefs about the benefit of switching their vote,
type of measurement risks the possibility of ecological fallacy: researchers may incorrectly infer that individuals behave strategically from aggregate-level data.
A second approach uses self-reported strategic behavior: respondents are asked to choose their main reason for supporting a candidate/party and choose among answer choices such as “I supported a party that had no chance of winning” (Heath 1991; Niemi, Whitten, and Franklin 1992; Evans and Heath 1993). As Alvarez and Nagler (2000) show, this method is flawed due to respondents’ propensity to misremember, misstate, or lie about their vote choice and the reasons underlying it.
A third approach, which our study uses, is to infer strategic voting from differences in respondent attitudes toward parties or candidates and their stated vote intention. Those who vote for someone who is not their genuinely most-preferred candidate likely do so for strategic reasons. True preferences have been measured via feeling thermometers (Blais and Nadeau 1996), congruence between issue positions held by the respondent and each party (Alvarez and Nagler 2000), or behavioral measures like reported vote choice in primaries (Weitz-Shapiro and Winters 2019).
As Meffert and Gschwend (2011) note, however, not all insincere voters (those whose vote choice deviates from their top preference) can be classified as strategic. Switching one’s vote is a necessary but not sufficient condition for strategic voting; some may abandon their top choice for symbolic reasons, because of a vote buying offer, or due to purely random, idiosyncratic factors. Thus, it is crucial to make a distinction between “vote switching” and “strategic voting.” Vote switchers – those who cast their vote for a candidate other than their most sincerely preferred choice – may be considered strategic only if they make that switch with the intent of increasing their influence over election outcomes.
vote according to the scenarios laid out in Table 2, no further analysis is warranted.
To measure sincere preferences in our study, we asked respondents to name the candidate they thought would make the best president, regardless of their actual vote choice. We next asked them to name the candidate for whom they intended to vote on election day. Those whose vote intention differs from their sincere preference are considered vote switchers.
Table 3 displays the distribution of valid responses to the question about respondents’ vote intention for the first round of the presidential election according to our unweighted sample, the post-weight sample, the last pre-election poll from Datafolha, and actual elec-toral returns. We also show the share of respondents who selected each candidate as their true first preference among the field according to the weighted and unweighted samples. Our sample appears to lean center-right compared to the general population. Even when weighted, our sample includes a greater than expected number of supporters of small, right-party candidates and fewer than expected Haddad and Ciro voters. Our estimate of the proportion of Bolsonaro voters was low compared to actual results but higher (and therefore more accurate) than most pre-election polls. Importantly, in our survey, the distribution of first choice preferences is different than the distribution of voting intentions, indicating the possibility of strategic voting. A higher proportion of respondents expressed an intention to vote for one of the leading candidates, Bolsonaro and Haddad, than described them as their first preferences. Some less viable candidates, like Ciro, Alckmin, Marina, and Amoˆedo, received a much higher share of first preference selections than vote intentions. This suggests that many people, despite believing that these candidates were the best fit for the presidency, ultimately cast their ballots for other, more popular candidates.
Types of Vote Switching
This is a conservative estimate of the number of vote switchers, as we do not consider those who express a top choice but then respond “don’t know” to or refuse to answer the vote choice question. We exclude four candidates from the columns in the table, as we have no expectations about them, and none received more than ten switch votes.
Recalling the possible types of strategic voting that may have occurred in this election (Table 2), Scenario 1 encompasses switches from supporters of weak right-wing candidates (Alckmin, Meirelles, Dias, Amoˆedo) to Bolsonaro, Scenario 2 encompasses switches from both strong and weak leftist candidates (Haddad, Marina, Boulos) to center-left Ciro, and Scenario 3 involves switches from Bolsonaro to the weaker center-right Alckmin. Table 4 provides initial evidence that some voters behaved in the manner anticipated by Scenario 1. Of the 760 respondents who said they intended to vote for Bolsonaro, 98 (13%) believed that another candidate would make the best president. These vote switchers primarily named center-right candidates as the best candidate.
There is little evidence suggesting the existence of the “strong-to-weak” strategic voting described in Scenarios 2 and 3. Among the 414 voters who expressed a sincere preference for Haddad, Marina, and Boulos, only 10 (2.4%) reported an intention to vote for Ciro. On the contrary, Haddad received 21 votes from sincere Ciro supporters and 15 from sincere Alckmin supporters. Alckmin picked up only 6 votes from Bolsonaro supporters. Very few Bolsonaro supporters switched their vote at all.
Overall, this table suggests that, to the extent that strategic voting occurred in this election, votes flowed from weak to strong candidates, much as they do in SMDP systems. Strikingly, only 57.1% of those who supported fifth-placed Amoˆedo in our sample indicated they were planning to vote for him. This is preliminary evidence that Brazilian voters were worried about “wasting” their votes.
weak-to-strong vote switchers. We assess whether these voters switch for strategic reasons by examining their beliefs about the relative position of the candidates in the field, which is the second condition necessary for strategic voting.
Weak-to-Strong Strategic Voting
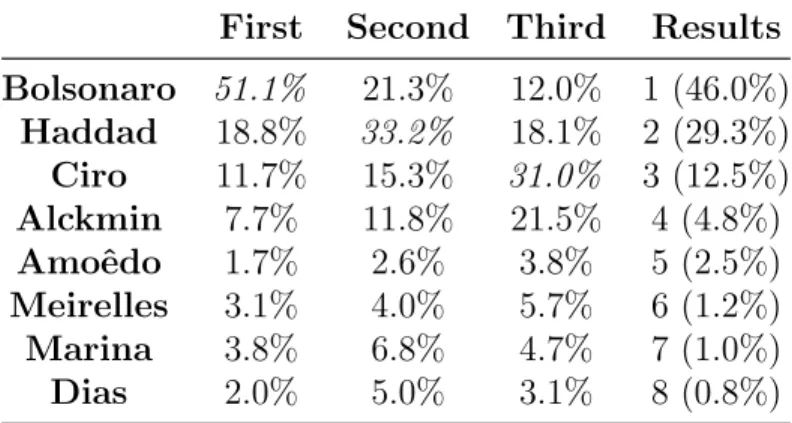
To more accurately gauge whether vote switchers are indeed making strategic voting deci-sions, we asked respondents to predict who would place in first, second, and third in the first round. This allows us to directly assess whether the voter believes she is switching from a weak candidate to a strong candidate. This is an empirical innovation over previous studies which use actual election returns to classify voters as strategic (e.g. Abramson et al. 1992; Black 1978; Eggers and Vivyan 2017; Weitz-Shapiro and Winters 2019). Those studies may be committing Type I errors by assuming that voters who abandon their first choice candidate know or believe that they are voting for someone with a better chance of winning. While pre-election polling showed Bolsonaro, Haddad, and Ciro clearly in first, second, and third place respectively, our survey indicates that a substantial proportion of respondents misidentified the position of the candidates. Table 5 shows the proportion of respondents who estimated that each candidate would finish in first, second, and third place. Almost half of the respondents did not correctly identify Bolsonaro as the leading candidate, and only around one-third believed Haddad and Ciro were the next two leading candidates. Only 18% of respondents correctly identified Bolsonaro, Haddad, and Ciro as the eventual first, second, and third place finishers, respectively.
How Many Weak-to-Strong Strategic Voters?
Table 5: Share of Respondents Who Predict Candidate Will Finish in First, Second, and Third Place (Weighted)
First Second Third Results Bolsonaro 51.1% 21.3% 12.0% 1 (46.0%)
Haddad 18.8% 33.2% 18.1% 2 (29.3%)
Ciro 11.7% 15.3% 31.0% 3 (12.5%)
Alckmin 7.7% 11.8% 21.5% 4 (4.8%)
Amoˆedo 1.7% 2.6% 3.8% 5 (2.5%)
Meirelles 3.1% 4.0% 5.7% 6 (1.2%)
Marina 3.8% 6.8% 4.7% 7 (1.0%)
Dias 2.0% 5.0% 3.1% 8 (0.8%)
Note: Italicsindicate the “correct” response – Bolsonaro fin-ished first, Haddad second, and Ciro third.
support a candidate whom they believe has little chance of advancing to the second round; they could thus heighten their impact on the eventual outcome by casting their ballots for another candidate. We placed the cutoff after the third-placed candidate because, for those who support a top-three candidate, strategic voting is risky and offers little benefit. First, the voter’s preferred candidate is already close to or currently in a winning position, so the voter must be very certain about the benefits of strategic voting to risk jeopardizing the candidate’s current position by deviating from their sincere preference. Second, there are no strategic reasons for third-place candidate supporters to switch to the second-place candidate, as switching from one losing candidate to another will not prevent the leading candidate from winning outright in the first round.12
The rest of our analysis is limited to potential strategic voters, so thendrops significantly; we identify 250 respondents (13.9% of our total sample) as potential strategic voters. Next, we label respondents who both sincerely support a losing candidate and who intend to vote
12This operationalization does prevent us from accurately capturing the scenario in which supporters of
for another candidate as “strategic voters.”13We remove from the analysis those who refused to answer either question about vote intention or presidential preference. Among the pool of potential strategic voters, a little under half actually switched their votes. Thus, we estimate that around 6.4% of voters engaged in weak-to-strong strategic voting in this election.14
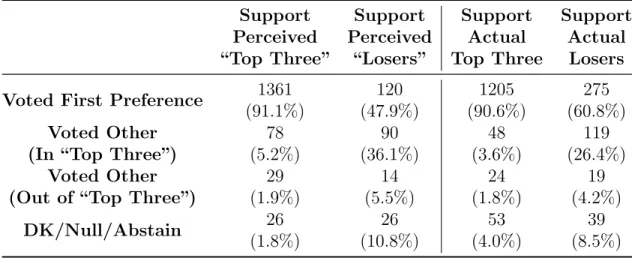
Table 6 shows a breakdown of vote intention by true preference across presidential can-didates. The rows show the number and percentage of respondents who voted for their first preference, who voted for a different candidate (separated by whether they think the candidate for whom they intended to vote would finish in the top three), or who chose to abstain, voted null, or responded “don’t know.” The columns separate respondents into dif-ferent groups based on their first preference. The first column includes only respondents who support a candidate they think will finish in the top three, while the second is limited to respondents who have a preference for a candidate they think will finish outside the top three (i.e., potential strategic voters). For comparison, the third and fourth column split the sample by an objective measure of candidate performance: supporters of Bolsonaro, Haddad, or Ciro are placed in the third column, and supporters of other candidates are in the fourth. The table provides further evidence that this election featured weak-to-strong strategic voting. Over 90% of those who supported a candidate that they thought would finish in the top three voted sincerely, while only 47.9% of those who genuinely supported someone who they thought of as finishing outside the top three actually expressed intention to vote for their top choice. Only 7.1% of those who truly supported someone that they perceived as a “top three” candidate switched their vote. Facing the fact that their candidate was headed for defeat, 36.1% of those who supported “losers” chose to vote for someone in the top three. Results from the third and fourth columns indicate that beliefs about candidate’s polling positions matter more than candidate’s actual poll standings at the time of the survey.
13The assumption is that if someone switches to support a viable candidate, i.e. one in third place or
above, they are doing so to increase the impact of their ballot, the second condition for strategic voting.
14If we were to treat anyone who switches their vote to someone besides their first preference as a strategic
Among supporters of truly losing candidates (i.e., those that are not Bolsonaro, Haddad, or Ciro), only 26.4% chose to instead vote for someone they thought would finish in the top three, a rate of defection about 10 percentage points lower than that found among those who recognize or believe their candidate is losing. This suggests that some respondents do not know that their favorite candidate has no chance of winning, and therefore they should not be considered potential strategic voters. Relying on actual returns, rather than respondent perceptions, would incorrectly characterize these respondents as potential strategic voters.
Table 6: Voting Decisions by Presidential Preference (Weighted) Support
Perceived “Top Three”
Support Perceived
“Losers”
Support Actual Top Three
Support Actual
Losers
Voted First Preference 1361 (91.1%)
120 (47.9%)
1205 (90.6%)
275 (60.8%) Voted Other
(In “Top Three”)
78 (5.2%)
90 (36.1%)
48 (3.6%)
119 (26.4%) Voted Other
(Out of “Top Three”)
29 (1.9%)
14 (5.5%)
24 (1.8%)
19 (4.2%)
DK/Null/Abstain 26
(1.8%)
26 (10.8%)
53 (4.0%)
39 (8.5%)
Note: Columns sum to 100%. First column includes only respondents whose first preference is candidate they think will finish in the top three, while the second is only respondents who have a first preference for a candidate who they think willnot finish in the top three. The third column is limited to Bolsonaro, Haddad, or Ciro supporters (the true top three), while the fourth is for supporters of other candidates. Cell numbers use the weighted sample but are rounded to the nearest whole number.
Who Votes Strategically?
We explore five variables that could predict the likelihood of strategic voting: political knowledge, certainty about election outcomes, ideological preference among the top candi-dates, education, and SES. To measure knowledge, we asked respondents a nine question battery of matters related to Brazilian and international politics. The questions were a mix of free-response (“How many federal deputies are elected in your state?”), multiple choice (“What level of government is responsible for high school education: federal, state, or mu-nicipal?”) and true/false (“Beneficiaries ofBolsa Familia have to possess a magnetic card.”). We create an additive index ranging from 0 to 9 questions correctly answered. The mean number of correct responses was 3.39 with a standard deviation of 1.67.
To measure certainty about election outcomes, we asked respondents to assess their con-fidence, on a four-point scale, in their prediction of the top three finishers. We expect that those who are more certain that their preferred candidate will fall outside of the top three are more likely to abandon that candidate and use their ballot to express a preference among the (perceived) likely winners. Thus, potential strategic voters who are more confident in their forecast should be more likely to vote strategically.
place, so there was little incentive to vote strategically for him.
We measure SES on a six-point scale according to the ABCDE classification, which is based on household monthly income. To more evenly represent the actual distribution of wealth in Brazil, we use the A, B1, B2, C1, C2, and D-E categories. We asked respondents to report the highest level of formal education they had attained on a 10-point scale, ranging from “illiterate/no formal education” to “completed graduate degree”.
Before turning to the analysis, we report differences on these variables across potential strategic voters (the restricted sample we use for analysis) and other respondents in our sample. Figure 2 shows the differences between the two groups on education level, SES, political knowledge, and confidence in prediction. In each of the four plots we show the mean value of each variable for both potential strategic voters and other respondents with standard errors. The figures also display the p-value of a two-sample difference-in-means t-test between the two groups. Potential strategic voters are more highly educated, wealthier, and more politically knowledgeable than non-potential strategic voters. These differences may be driven in part by the fact that many of the candidates polling in fourth place and below were ideologically right-of-center, a position that aligns with the preferences of wealthier and more educated voters.
p < 0.01
Others (1751) Potentials (244)
6.25 6.50 6.75 7.00 7.25
Education Level
p < 0.01
Others (1928) Potentials (251)
2.6 2.8 3.0 3.2
SES
p < 0.01
Others (1928) Potentials (251)
3.2 3.4 3.6 3.8
Political Knowledge
p = 0.52
Others (1928) Potentials (251)
3.1 3.2 3.3 3.4
Confidence in Prediction
Results
Figure 3 plots the estimated average level of education, socioeconomic status, political knowl-edge, and prediction confidence among potential strategic voters who then did or did not actually vote strategically.15 95% confidence intervals are plotted around the means of these variables. Again we display the p-value from a difference-in-means t-test between the average value of each variable for the categories of potential and actual strategic voters.
p = 0.10
Potential (244) Actual (101)
6.8 7.0 7.2
Education Level
p = 0.85
Potential (251) Actual (104)
2.9 3.0 3.1 3.2 3.3 3.4
SES
p = 0.96
Potential (251) Actual (104)
3.4 3.6 3.8 4.0
Political Knowledge
p < 0.01
Potential (251) Actual (104)
2.75 3.00 3.25 3.50 3.75
Confidence in Prediction
Figure 3: Differences between Potential and Actual Strategic Voters by Explanatory Vari-ables
Among potential weak-to-strong strategic voters, actual strategic voters do not seem to be significantly more or less educated, knowledgeable, or wealthy than those who forego strategic voting. However, the two groups are quite different in their level of confidence
15The categories are mutually exclusive. Although all respondents included in the analysis here are
in their prediction of the outcome of the election. In line with expectations, those who actually decide to vote strategically are more confident in their prediction that their preferred candidate will lose (p <0.01).
We next test the effect of each of these variables simultaneously, along with the categorical PT opinion variable. To do so, we use logistic regression with a binary outcome that takes the value of 1 if a potential strategic voter actually intended to vote strategically.
Table 7: Logit Models of Strategic Voting in 2018 Presidential Election
DV: Strategic Voting
SES −0.014 (0.111)
Education 0.061 (0.107)
Political Knowledge −0.081 (0.081) Prediction Confidence 0.583∗∗ (0.164) PT – Opponents 0.753∗ (0.382)
PT – Supporters 0.660 (0.411)
Constant −2.661∗∗ (0.820)
Observations 313
Logit coefficients with (standard errors), ∗p<0.05; ∗∗p<0.01
The table clearly demonstrates that respondents’ confidence in their prediction of the outcome of the first round election is positively related to casting a strategic vote. The more confident one is in her prediction that her preferred candidate will fall outside of the top three, the more likely she is to vote strategically (p < 0.01). Only around 10% of those that said they were “not at all” confident voted strategically, while around 55% in the “very confident” category did so. When all other variables are held at their means (and PT opinion held at “neutral”) and prediction confidence is changed from “not at all” to “very” confident, the predicted probability of voting strategically increases from 12% to 44%. Individual perceptions of the positions of candidates strongly predict whether or not someone choose to vote strategically.
of strategic voting. The analysis offers some support for our hypothesis regarding opinion of the top candidates, as measured by the PT opinion variable: respondents are more likely to vote strategically if they oppose the PT. This result is in line with the pro-Bolsonaro strategic voting scenario, which we have so far found to be most plausible: Potential strategic voters who dislike the PT switch their vote to help prevent a return to a PT administration.
Conclusion
Previous research on strategic voting has focused mostly on single-member district plurality elections in advanced industrial countries. Although it is acknowledged that runoff electoral systems also present incentives for strategic voting, the forms this may take and the incidence of strategic behavior has received limited attention to date. This paper examines strategic voting in a two-round system, Brazil’s 2018 presidential election, in which multiple types of strategic voting were expected to occur. This paper examines the extent to which three types of strategic voting occurred. Further, we assess which individual-level factors correlate with a higher likelihood of voting strategically, which few studies have done in the case of a runoff election.
Through an original survey conducted shortly before the first round of the election, we find that strategic voting did occur, with votes flowing from supporters of weak candidates to the strongest candidates. We estimate that 6.4% of votes cast were strategic, a rate broadly similar to estimates from elections in other countries including Great Britain (7.2%, Alvarez and Nagler 2000), Canada (6.0%, Blais and Nadeau 1996), and Argentina (10%, Weitz-Shapiro and Winters 2019). These strategic votes primarily benefited the leading candidate, Jair Bolsonaro (PSL). These results are in contrast with the findings of authors like Moser and Scheiner (2009), who argue that strategic voting is uncommon in new democracies, where party systems are poorly institutionalized.
insti-tutions and strategic voting. The finding that the strongest candidate(s) benefited from strategic voting suggests that voters fear “wasting” their votes in the first round, just as they do under SMDP rules, even when they have the opportunity to express a preference among the top candidates in the runoff. Two-round systems also allow the possibility of other, unique strategic voting possibilities, including the scenario in which strong candidate sup-porters defect to a weaker first-round candidate who is believed to have stronger prospects in the second round. However, we do not find evidence of substantial strong-to-weak strategic voting in this election. Though there was much speculation that this might occur, the lack of empirical evidence suggests that these scenarios may be too complex or uncertain for voters to commit to them.
References
Abramson, Paul R., John H. Aldrich, Phil Paolino, and David W. Rohde. “‘Sophisticated’ Voting
in the 1988 Presidential Primaries.”American Political Science Review 86, no. 1 (1992): 55-69.
Black, Jerome H. “The Multicandidate Calculus of Voting: Application to Canadian Federal
Elections.”American Journal of Political Science 20, no. 3 (1978): 609-638.
Blais, Andr´e and Richard Nadeau. “Measuring Strategic Voting: A Two-Step Procedure.”Electoral
Studies 15, no. 1 (1996): 39-52.
Blais, Andr´e. “Why is There so Little Strategic Voting in Canadian Plurality Rule Elections?”
Political Studies 50, no. 3 (2002): 445-454.
Blais, Andr´e. “Strategic Voting in the 2002 French Presidential Election.” In The French Voter,
ed. Michael Lewis-Beck, p. 93-109. London: Palgrave Macmillan, 2004.
Blais, Andr´e, Richard Nadeau, Elisabeth Gidengil, and Neil Nevitte. “Measuring Strategic Voting
in Multiparty Plurality Elections.”Electoral Studies 20, no. 3 (2001): 343-352.
Blais, Andr´e, Simon Labb´e-St-Vincent, Laslier Jean-Fran¸cois, Nicolas Sauger, and Karine Van
der Straeten. “Strategic Vote Choice in One-Round and Two-Round Elections: An Experimental
Study.”Political Research Quarterly 64, no. 3 (2011): 637-645.
Bouton, Laurent. “A Theory of Strategic Voting in Runoff Elections.”American Economic Review
103, no. 4 (2013): 1248-88.
Bouton, Laurent, and Gabriele Gratton. “Majority Runoff Elections: Strategic Voting and
Du-verger’s Hypothesis.”Theoretical Economics 10, no. 2 (2015): 283-314.
Cain, Bruce E. “Strategic Voting in Britain.”American Journal of Political Science22 no. 3 (1978):
639-655.
G. W. Cox, “Strategic Electoral Choice in Multi-Member Districts: Approval Voting in Practice?”
Cox, Gary W. “Strategic Voting Equilibria Under the Single Non-Transferable Vote.”American
Political Science Review 88 no. 3 (1994): 608-21.
Cox, Gary W. Making Votes Count: Strategic Coordination in the World’s Electoral Systems.
Cambridge: Cambridge University Press, 1997.
Cox, Gary W., and Matthew Soberg Shugart. “Strategic Voting Under Proportional
Representa-tion.”Journal of Law, Economics, and Organization 12, no. 2 (1996): 299-324.
Coppedge, Michael. “The Evolution of Latin American Party Systems.” InPolitics, Society, And
Democracy Latin America, ed. Scott Mainwaring, pp. 171-206. Routledge, 2018.
Downs, Anthony. “An Economic Theory of Political Action in a Democracy.”Journal of Political
Economy 65, no. 2 (1957): 135-150.
Duverger, Maurice. Political Parties. New York: Wiley, 1954.
Eggers, Andrew C. and Nick Vivyan. “Who Votes More Strategically?” Working Paper. December
1, 2017.
Evans, G. and A. Heath, “A Tactical Error in the Analysis of Tactical Voting: A Response to
Niemi, Whitten and Franklin.”British Journal of Political Science, 23, no. 1 (1993): 131-137.
Fisher, Stephen D. “Definition and Measurement of Tactical Voting: The Role of Rational Choice.”
British Journal of Political Science 34, no. 1 (2004): 152-166.
Gschwend, Thomas. “Ticket-Splitting and Strategic Voting under Mixed Electoral Rules: Evidence
from Germany.”European Journal of Political Research 46, no. 1 (2007): 1-23.
Heath, Anthony. Understanding Political Change: The British Voter 1964-1987. Oxford:
Perga-mon Press, 1991.
Karp, Jeffrey A., Jack Vowles, Susan A. Banducci, and Todd Donovan. “Strategic Voting, Party
Activity, and Candidate Effects: Testing Explanations for Split Voting in New Zealand’s New
Kiss, Aron. “Identifying Strategic Voting in Two-Round Elections.”Electoral Studies 40 (2015):
127-135.
Kitschelt, Herbert, Kirk A. Hawkins, Juan Pablo Luna, Guillermo Rosas, and Elizabeth J.
Zech-meister. Latin American Party Systems. Cambridge: Cambridge University Press, 2010.
Lago, Ignacio. “Rational Expectations or Heuristics? Strategic Voting in Proportional
Represen-tation Systems.”Party Politics 14, no. 1 (2008): 31-49.
Mainwaring, Scott, and Timothy Scully, eds. Building Democratic Institutions: Party Systems in
Latin America.Stanford: Stanford University Press, 1995.
Moser, Robert G., and Ethan Scheiner. “Strategic Voting in Established and New Democracies:
Ticket Splitting in Mixed-Member Electoral Systems.”Electoral Studies 28, no. 1 (2009): 51-61.
Myatt, David P. “On the Theory of Strategic Voting.”The Review of Economic Studies 74, no. 1
(2007): 255-281.
Meffert, Michael F., and Thomas Gschwend. “Polls, Coalition Signals and Strategic Voting: An
Experimental Investigation of Perceptions and Effects.”European Journal of Political Research
50, no. 5 (2011): 636-667.
Merolla, Jennifer L. and Laura B. Stephenson. “Strategic Voting in Canada: A Cross Time
Anal-ysis.”Electoral Studies 26 no. 2 (2007): 235-246.
Niemi, R.G., G. Whitten and M.N. Franklin. “Constituency Characteristics, Individual
Charac-teristics and Tactical Voting in the 1987 British General Election.”British Journal of Political
Science 22 no. 2 (1992): 229-240.
Niou, Emerson MS. “Strategic Voting under Plurality and Runoff Rules.”Journal of Theoretical
Politics 13, no. 2 (2001): 209-227.
Payne, J. Mark, Fernando Carrillo Florez, and Andres Allamand Zavala. “Democracies in
De-velopment: Politics and Reform in Latin America.” Vol. 1. Inter-American Development Bank,
P´erez-Li˜n´an, An´ıbal. “Evaluating Presidential Runoff Elections.”Electoral Studies 25, no. 1 (2006):
129-146.
Piketty, Thomas. “Voting as Communicating.”The Review of Economic Studies 67, no. 1 (2000):
169-191.
Shikano, Susumu, Michael Herrmann, and Paul W. Thurner. “Strategic Voting Under Proportional
Representation: Threshold Insurance in German Elections.”West European Politics 32, no. 3
(2009): 634-656.
Spafford, Duff. “Electoral Systems and Voter’s Behavior: Comment and a Further Test.”
Compar-ative Politics, 5 no. 1 (1972): 129-134.
Van der Straeten, Karine, Jean-Fran¸cois Laslier, and Andre Blais. “Patterns of Strategic Voting in
Run-Off Elections.” In Voting Experiments, eds. Andr´e Blais, Jean-Fran¸cois Laslier, Karine Van
der Straeten, p. 215-236. Basel: Springer International, 2016.
Weitz-Shapiro, Rebecca and Matthew Winters. “Strategic Voting in a Two-Round,
Multi-Candidate Election.” in Campaigns and Voters in Developing Democracies Argentina in
Com-parative Perspective, eds. Noam Lupu, Virginia Oliveros, and Luis Schiumerini, 187-212. Ann
Appendix
Survey Design
For recruitment, the survey firm Offerwise sent emails to a random selection of several thousand people in a database that consists of Brazilian citizens who sign up to receive offers to participate in research studies in exchange for various rewards. The survey included one attention check question; if a respondent failed to answer this question correctly, the questionnaire immediately ended and their responses were not recorded. The firm closed the survey after collecting 2,226 complete questionnaires. These were all collected October 4-6, 2018.
The following table provides statistics about the sample for the variables for which we applied poststratification weights. The weights were bounded, with a maximum weight of 3. As one might expect from an online convenience sample, we oversample the wealthy and those that come from more wealthy regions of Brazil. As the next table shows, we also have a highly educated sample.
Sample Statistics and Population Parameters for Weighting Variables
Survey
(Unweighted) Census
Female 55.9% 51.0%
Center-West 9.8% 7.4%
Northeast 24.5% 27.8%
North 5.1% 8.4%
Southeast 41.3% 42.1%
South 19.2% 14.3%
SES – A 8.2% 5.0%
SES – B1 11.7% 8.9%
SES – B2 25.7% 15.7%
SES – C1 22.7% 20.7%
SES – C2 18.3% 21.8%
Other Statistics
Survey
(Unweighted) Census
HS Diploma or Higher 81.8% 48.0%
Mean Age 32.0 31.8
Median Income $1.800-$3.399 BRL $2298 BRL
0.0 0.2 0.4
Neutral Opponents Supporters
PT Opinion
Propor
tion
Proportion Among:
Potential SVers Other Respondents
0.0 0.2 0.4
Not at all A little Somewhat Very
Confidence in Election Prediction
Propor
tion
Proportion Among:
Potential SVers Other Respondents