D
D
D
R
R
R
M
M
M
SS
S
C
C
C
oo
o
rr
r
d
d
d
ll
l
ee
e
ss
s
ss
s
V
VV
ee
e
rr
r
ss
s
ii
i
oo
o
n
n
n
55
5
O
O
O
PP
P
EE
E
R
R
R
A
A
A
TT
T
II
I
N
N
N
G
G
G
A
A
A
N
N
N
D
D
D
M
M
M
A
A
A
II
I
N
N
N
TT
T
EE
E
N
N
N
A
A
A
N
N
N
CC
C
EE
E
M
M
M
A
A
A
N
N
N
U
U
U
A
A
A
LL
L
Page 2 of 27
TABLE OF CONTENTS
1.INTRODUCTION ... 3
2.PRELIMINARY OPERATIONS ... 4
3.STARTING THE PROGRAM AND DESCRIPTION OF THE TEST CONTROL FUNCTIONS ... 6
4.DESCRIPTION OF OPERATING PROCEDURES ... 8
4.1 Test Configuration ... 8
4.2 Signal monitor ... 12
4.3 Start drilling test ... 13
4.4 Demo mode ... 16
4.5 Set zero reference ... 17
4.6 Abort/Exit acquisition mode ... 17
4.7 Exit program ... 17
5.DESCRIPTION OF DATA PROCESSING FUNCTIONS ... 17
5.1 Test elaboration ... 17
6.TYPICAL TEST PARAMETERS AND USE OF REFERENCE MATERIAL FOR CHECKING BIT WEAR ... 24
6.1 Typical parameters and recommendations ... .24
6.2 Checking bit wear ... 25
7.OPERATING AND SAFETY PRECAUTIONS... 26
Page 3 of 27
1.
INTRODUCTION
This manual describes the main functions of the software program for operating the Drilling Resistance Measurement System, DRMS Cordless, and for management and processing of the data acquired by the system.
A section of the manual focuses on the procedure for installing the software.
The program was developed by SINT Technology using National Instruments’ Labview environment. SINT Technology also designed and constructed the mechanical part and the electrical and electronic parts of the system.
Read this manual carefully before performing any operation on the measurement system. The manufacturer shall not be held liable for any damages arising from improper use of the system or failure to follow these operating instructions.
This manual should be kept in a safe place where it may be consulted at all times. For extra copies, revisions or further information, please contact:
SINT Technology s.r.l.
Via Giusti, 229, 50041 Calenzano (FI) - ITALY Tel. 0039 055 8826302, fax 0039 055 8826303
e-mail: [email protected]
Internet: www.sintechnology.com
The manufacturer reserves the right to change the system and manual, without any obligation to update previously produced systems or manuals. The photographs contained in this manual are purely for illustrative purposes.
Page 4 of 27
2.
PRELIMINARY OPERATIONS
The procedure listed below must be followed for the measurement system to operate correctly and each operation must be carried out in the correct order to ensure that it may actually be used.
1. Remove the mechanical instrument and a battery from the protective case. Make
sure that the ON/OFF switch (Figure 2) is on OFF
2. Check the charge of a battery by putting it into the battery charger and checking
the charge LED, following the instructions provided on the battery charger
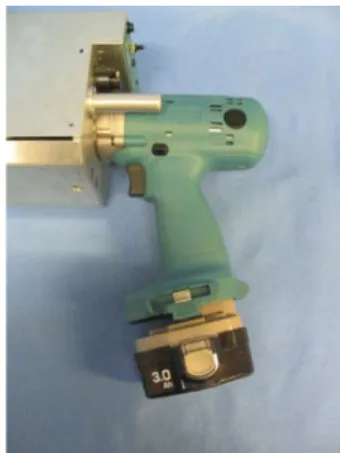
3. Insert the battery into the heel of the handle (Figure 1)
4. Start the PC and take out the USB connection lead
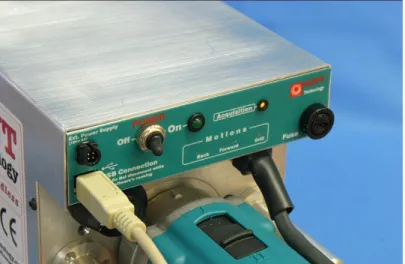
5. After the PC is started, connect the USB lead to the ports on the PC and
mechanical instrument (Figure 3)
6. The Acquisition LED flashes at first and then stays alight without flashing (Figure
3)
7. Put the ON/OFF switch on ON, and the green LED lights up (Figure 4)
8. Turn to the next section on how to start the program.
IMPORTANT: If you haven’t bought the PC with pre-installed software, before point 5 you have to install the software by inserting in your PC the CD you find in the case of the system, launching “setup” and following the instructions.
Moreover, you have to install the USB-to-serial-converter driver by clicking on the setup file.
Page 5 of 27
Figure 2 – Main panel on the mechanical instrument
Figure 3 - USB lead connecting the PC and mechanical instrument
Page 6 of 27
3.
STARTING THE PROGRAM AND DESCRIPTION OF THE TEST CONTROL
FUNCTIONS
Go to the menu “Start-Programs-Drms_Cordless” and double click on the program “Drms_Cordless” (Figure 5).
Figure 5 – Starting the program
Creating a link on the desktop simplifies the starting procedure and saves time (Figure 6).
Figure 6 – Desktop link
Once established, double click on the desktop icon.
IMPORTANT: Some operating systems (e.g. Windows 7) require that you run the DRMS Cordless software as administrator (see beside), by right-clicking your mouse and selecting the command “run as administrator”.
Page 7 of 27
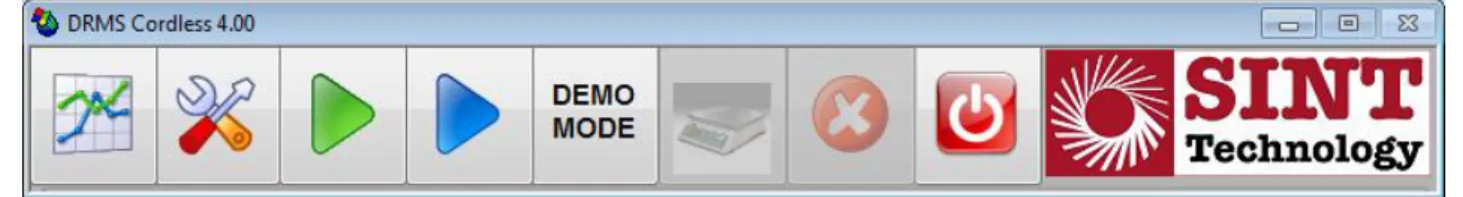
The main control panel will open up (Figure 7) presenting eight buttons that access the following features (from left):
1. Test elaboration: allows you to process and analyze data acquired during previous tests
2. Test configuration: allows you to set all test parameters, from speeds to the operator’s name, etc
3. Signal monitor: enables real-time monitoring of all parameters (cell reading, penetration speed and speed of rotation) without any data being saved on file 4. Start drilling test: enables the procedure for acquisition and recording of test
data. Once clicked, when the main control button on the handle of the instrument is next pressed, the test sequence starts as set on the “Test configuration”. Everything is saved in a file on the hard disk
5. Enable demo mode: When you click on this button and then on “Start drilling test”, a video demonstration of a sample hole starts. The mechanical system is not activated. You must hit the “Abort/Exit acquisition mode” button to disenable this mode
6. Set zero reference: sets all readings to zero enabling the “Signal monitor” function
7. Abort/Exit acquisition mode: allows you to get out of the “Signal monitor”, “Start drilling test” and “Enable demo mode” procedures
8. Exit Program: allows you to leave the program.
Figure 7 – Main control panel
Page 8 of 27
Figure 8 – System ready for testing
4.
DESCRIPTION OF OPERATING PROCEDURES
4.1
Test Configuration
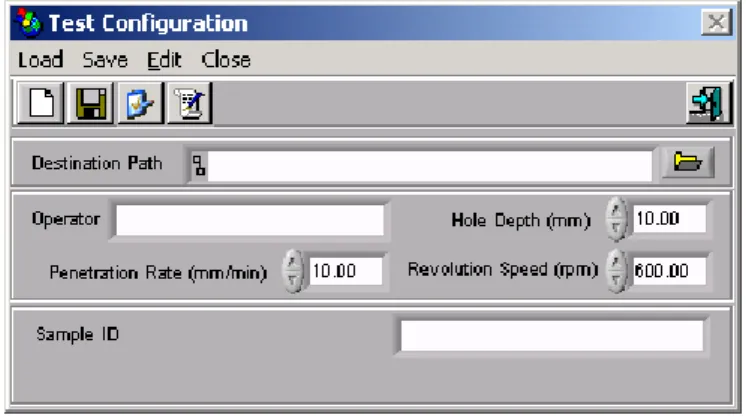
Clicking on this button opens the panel where all the data can be entered for the drilling test you are about to carry out. The panel opens in the simplified configuration and the Automatic Name function (Figure 9) is enabled by default.
Figure 9 - Simplified "Test configuration" panel with Automatic Name enabled
This allows information to be entered in the following fields:
1. Destination Path: allows you to select the directory where acquired files are to be
saved. This is a required field. If the “Start drilling test” procedure is enabled without having filled this field, an error message appears
Page 9 of 27
2. Operator: the name of the operator carrying out the tests can be entered in this
field
3. Hole Depth (mm): the depth of the hole is set here in millimeters
4. Penetration Rate (mm/min): the penetration rate of the bit is set in millimeters
per minute
5. Revolution Speed (rpm): the speed of rotation of the bit is set in revolutions per
minute
6. Sample ID: allows input of additional information on the type of material that you
are drilling. The characters entered in this field automatically form the “File name” field.
The “File Name” field cannot be changed and is automatically created with the hole-drilling date (the first 6 digits) and after the “#” symbol it is again automatically updated with the progressive hole number. If characters are entered in the “Sample ID” field, they are automatically added at the end in the “File Name” field.
“Hole Depth (mm)”, “Penetration Rate (mm/min)” and “Revolution Speed (rpm)” are very important parameters and represent the corresponding values that the mechanical system will automatically operate with during hole drilling in the “Start Drilling Test” mode.
When the Automatic Name function (Figure 10) is disenabled, on clicking on the “Start drilling test” button you are asked to name the file which will be saved in the previously selected directory.
Page 10 of 27
By clicking on the Full Setting button the full control panel shown in Figure 11 opens. The first part of the configuration process is the same as for the simplified control panel in Figure 9. In addition, it is possible to enter the following additional fields:
1. Lithotype: additional field to characterize the type of material being tested
2. Decay State: state of decay of the material being tested (Figure 12). You can
choose from SOUND (no decay), LIGHT decay, MEDIUM decay, HEAVY decay
3. Treatment: any treatment of the material under testing (Figure 13). You can
choose from NONE (NN) – Cleaning (CL) – Protection (PT) – Consolidation (CO) – Other (OT) – Artificial Ageing (AA) – Natural Ageing (NA)
4. Type: additional field for describing the type of treatment
5. Water Porosity (%): water porosity of the material being tested
6. Compressive Strength (MPa): resistance to compression
7. Drill Bit Type: bit code
8. N. Holes: number of holes drilled by the bit with a specified code
9. First Hole: number of the first drilled hole
10.File Name: name of the file, created automatically.
As for the simplified panel, the “File Name” field cannot be modified but is filled automatically based on the characters entered in the fields described above. The first five characters from the left are taken from the “Sample ID” field, 4 characters from the “Drill Bit Type” field, 3 represent the progressive number of holes made with the type of bit, and the last two indicate any treatment applied to the material.
If the Automatic Name option is not selected, when you click on the “Start drilling test” button you are asked to enter the name of the file to be saved in the directory selected earlier.
Once all the required data is entered, the configuration can be saved in a file with extension .set by clicking on the Save button. It may then be called up by clicking on the Load button.
Page 11 of 27
Figure 11 – Full "Test Configuration" control panel with typical data input
Page 12 of 27
Figure 13 – Treatment options
4.2
Signal monitor
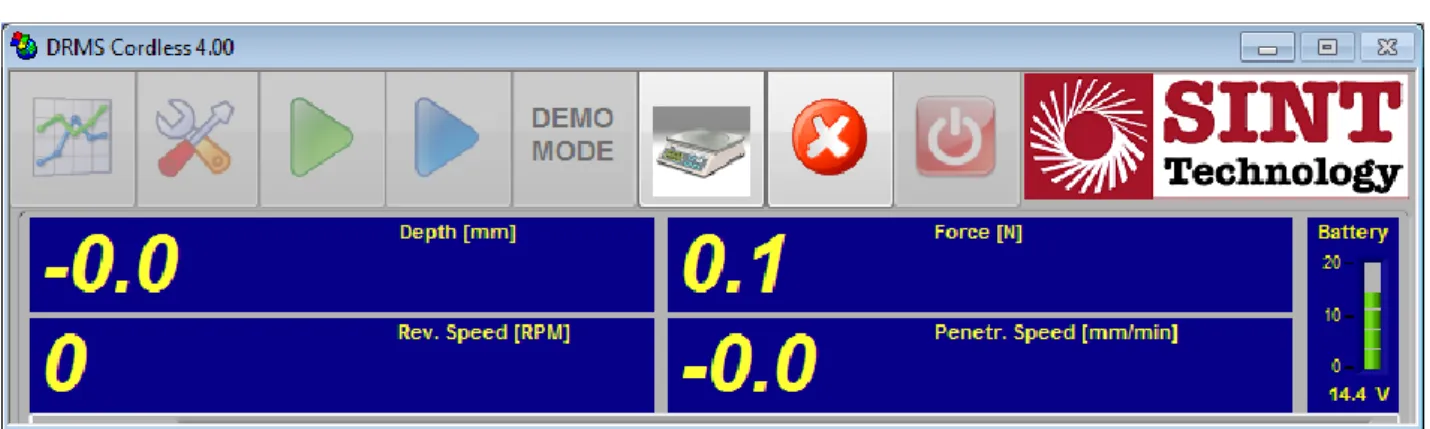
Pressing this button accesses the panel for real time monitoring of the drilling instrument movements and signals (Figure 14).
It gives you an instantaneous view of:
1. Depth (mm): hole depth in millimeters
2. Rev. Speed (rpm): bit speed of rotation in revolutions per minute
3. Force (N): force read by the load cell, corresponding to the penetration
resistance, measured in Newton
4. Penetr. Speed (mm/min): penetration speed in millimeters per minute
5. Battery: battery charge. As the charge runs down, the bar changes color going
from green to yellow and finally to red. When the charge level gets too low to guarantee proper operation of the system, an alarm message appears telling you to change the battery (Figure 15).
Page 13 of 27
Figure 14 – Real-time monitor
The “Set zero reference” button for resetting the load cell reading and the “Abort/exit acquisition mode” button for going back to the main control panel are active on this panel. With this procedure you can move the mechanical drilling instrument forward and backward by the start button on the handle and the direction selector. This allows you to set the bit as close as possible to the surface of the specimen and to cut working time to the minimum before starting with the automatic test procedure.
Figure 15 – battery down alarm window
4.3
Start drilling test
This button enables acquisition and saving of data in the file named in the “Test configuration” control panel. Unless the directory where it is to be saved is specified in the “Test configuration” panel, an error message is displayed (Figure 16) and the “Start drilling test” function cannot be enabled.
Page 14 of 27
Figure 16 – Error message, the directory where the file is to be saved has not been specified
Once the directory is specified, when the “Start drilling test” button is pressed the red and white flashing window shown in Figure 17 immediately appears
.
Figure 17 – Acquisition ready window
Now pressing the start button on the handle of the mechanical system starts the test.
The bit will start to rotate to the speed of rotation set in the configuration and will then begin moving at the speed again set in the configuration.
When the bit reaches the surface, acquisition will commence automatically and the window containing the force vs. penetration depth graph will open (Figure 18).
Page 15 of 27
Figure 18 – Force vs. penetration depth graph
If the start button on the handle of the mechanical instrument is pressed again during the test, the test is aborted and you are asked if you want to save the test (Figure 19).
Figure 19 – Dialog box for saving aborted tests
Page 16 of 27
Figure 20 – Graph on completion of a drilling test
The test was completed successfully and the data was saved on file and in the specified directory. To close this window, press the “Abort/Exit acquisition mode” button, after which we go back to the main control panel shown in Figure 7 and we can start again with another selection.
At the end of each hole, the average force and the average penetration speed during the hole are automatically displayed.
4.4
Demo mode
By enabling this function, with the “Demo mode” button pressed and flashing red (Figure 21) clicking on the “Start drilling test” button starts a hole-drilling demonstration showing a typical hole drilling procedure. The mechanical setup does not perform any operation. To
Page 17 of 27
leave this mode, you must click on the “Abort/Exit acquisition mode” button and disengage the “Demo mode” button.
Figure 21 - Demo mode enabled
4.5
Set zero reference
This button is active in the “Signal monitor” mode (Figure 14). Pressing it resets the
load cell force reading to zero.
4.6
Abort/Exit acquisition mode
This button is active in the “Demo mode” and “Start drilling test” procedures. It
allows you to abort testing in progress (whether demonstration or real testing) and to
go back to the main control panel (Figure 7).
4.7
Exit program
This function closes the program.
5.
DESCRIPTION OF DATA PROCESSING FUNCTIONS
5.1
Test elaboration
This procedure is accessed by pressing the “Test elaboration” button on the software main control panel in Figure 7.
Page 18 of 27
Figure 22 – Data processing window
This window allows to analyze data that is stored in files (filename.DRM), allowing you to view as many as 6 acquisitions contemporaneously from separate files, to print and export data. It contains a graph showing the force measured by load cell versus penetration depth. The curves are distinguished by a different color and the selected curve is shown in bold print. You can choose the type and size of line to be used in the graphs. To change the color and format of the line used in the graphs, you can use the command in the drop-down menu that appears clicking with either of the two buttons on the mouse on the curve or the name of the corresponding file in the box (in the top right corner of the window) shown in Figure 23.
Page 19 of 27
There are also two cursors, “Cursor 0” and “Cursor 1”, and the toolbar on the panel. Referring to Figure 24, you can see that there are a number of indicators showing:
Figure 24 – Cursors’ and graph toolbar
the name of the cursors (“Cursor 0” and “Cursor 1”)
the value of the x and y coordinates where the cursor is positioned
which of the two cursors is selected with a black square on a white field
the color of the cursor on the graph
if it is locked on the selected curve or free to move around the graph (open-closed lock)
the X button sets the scale of the x-axes for full view of the curve to the end of the
scale
the Y button sets the scale of the y-axes for full view of the curve to the end of the
scale
the X.XX button sets the properties of the x-axis scale
the Y.YY button sets the properties of the y-axis scale
the magnify button allows you to zoom in on a part of the graph
the hand button allows you to move around the graph.
The cursors are automatically pegged to the curve selected in the box in the data processing panel headed “Curve Selct.” shown in Figure 23. The curve is easily recognized as it is highlighted in bold print (in our case 110205#01_____.drm).
For further information on these commands, you may refer to the documentation provided on
National Instruments’ site www.ni.com.
Page 20 of 27
Figure 25 – Averaging commands
“Back Color” and “Grid Color” button controls for the color of graphs: “Back Color” for the
color of the background and “Grid color” for the color of the grid. The colors can be changed by clicking on them
“Window points” sets the number of window points on which averaging is to be done
“Step Res. (mm)” sets the graph resolution step once the average is calculated
“No Average/Win. Average” averaging control button. When “Win. Average” is activated,
the average of the selected curve is calculated with a movable window of a number of points specified in the “Window points” window
“Cut one point” eliminates the point where Cursor 0 is positioned, if pressed; the selected
point is replaced by the average value calculated from the preceding point and the following point
“Cut Pnt Between Curs.” removes the points between the two cursors from the graph
“Show setting/Hide Setting” shows and hides the panel (Figure 26) containing all the
additional information saved on the file selected by “Curve selct.” on running the test
“Modify setting” allows you to change saved data.
Page 21 of 27
Finally, there are a number of parameters (Figure 27) directly calculated on the selected curve, which are:
“Sur [mm2]” indicates the hole surface area in mm2
“Average Force [N] is the average of the force values between the two cursors
“Drilling Pressure [N/mm2]” is the ratio between the “Average Force [N]” and “Sur [mm2]”
“Curves Auto Number”, when activated, allows several files to be loaded and viewed
contemporaneously (up to a maximum of 6). When disactivated, only one file is viewed at a time
“Cursor Reset” puts the two cursors back in the default position, if pressed.
Figure 27 – Averaging feature parameters
The toolbar, at the top, contains the following commands (Figure 28):
Figure 28 - Toolbar
“Open” opens the dialog box which allows you to select the files to be loaded for viewing in
the form of a graph. If “Curves Auto Number” is activated up to 6 drilling files can be loaded, otherwise only the last one opened is viewed
“Save” opens the dialog box that allows you to save the data being viewed. This allows you
to have a single file containing the data of several curves or to save a curve that has been processed. The data is saved in a file with extension .drm
Page 22 of 27
Figure 29 – Print window
“WORD”/“HTML” opens a dialog box that allows you to save a report file
in format .doc/.htm containing the graphs and configuration parameters for the selected curve
“PRINTER” allows you to print out the report
“UNDO” closes the Print Graph window.
“Export” opens the dialog box that allows you to save the files viewed in the graphs in text
format (.txt)
“Del current” removes the selected curve from the graph
“Delete All” clears all curves from the graph
“Show diagram” is not active
“Exit” closes the program
“About” information on the software release.
The “Averaging curves” panel, shown in Figure 30, can be accessed by the command of the same name on the toolbar. The graph on this panel functions if 6 drilling files have been loaded in advance for processing. It visualizes:
“1-3 Average – Cu1”, the average over curves 1 to 3 of the six loaded in the processing
panel
“4-6 Average – Cu2”, the average over curves 4 to 6 of the six loaded in the processing
panel
Cu1 – Cu2, the difference between the abovementioned curves.
At the foot of the panel (Figure 31), the following indicators are provided:
“1-3 Average” (Cursor) and “4-6 Average” (Cursor) indicate the average of the values
Page 23 of 27
“Difference Average” is the difference between the “1-3 Average” (Cursor) and “4-6
Average” (Cursor) values
“Curves List” indicates the files to which processing refers.
For as far as regards the toolbar for the cursors and graphs, refer to the previous section.
Figure 30 – Averaging Curves Panel
Figure 31 – Averaging Curves Indicators
Page 24 of 27
“Print” prints out the graph
“Save” opens a dialog box that allows you to save a file with extension .cal containing all
the data on the graph. The file is saved by default in the directory drms\calculation
“Load” opens a window allowing you to load a file saved with extension .cal to view the
content
“Export Test Format” opens the dialog box where you can save the visualization in text
format
“Exit” closes the window.
Figure 32 – Averaging Curves Panel Commands
6.
TYPICAL TEST PARAMETERS AND USE OF REFERENCE MATERIAL FOR
CHECKING BIT WEAR
6.1
Typical parameters and recommendations
All tests and system settings are conducted with the following parameters:
5 mm. diamond drill provided
600 rpm speed of rotation
10 mm/min penetration speed.
These parameters are to be considered “typical” for the majority of stone materials and form the basis for setting the system for a material with an unknown drilling resistance. When dealing with particularly hard material (eg. granite) or soft material (such as “pietra di Lecce” stone), the instrument may measure resistance values greater than 100 N and
Page 25 of 27
therefore the load cell protection system comes into operation if drilling granite or it may not give appreciable results as in the case of Lecce stone.
In these extremes, the penetration speed and speed of rotation settings can be changed to obtain a value within the instrument’s measuring scale.
The following are examples of possible settings: GRANITE.
Speed of rotation: 900 rpm Penetration speed: 5 mm/min LECCE STONE.
Speed of rotation: 20 rpm Penetration speed: 40 mm/min
Good results have been achieved on granite using the parameters indicated above and off-the-shelf 5 mm. diameter drills with Widia coatings.
These values are provided purely as an indication and can vary considerably depending on the type and condition of the material concerned.
It is clear that a comparison can only be made of curves obtained at the same speed of rotation and penetration speed and with the same type of bit.
6.2
Checking bit wear
The system is supplied with five diamond bits and a specimen for checking bit wear (designation ARS).
The first hole made with a bit is always on this specimen (ARS), and then you go on to drilling specimen materials. Depending on the recognized abradability of each material (eg, marble: low abradability, sandstone stone: high abradability) a certain number of drilling procedures is performed and then another sample hole is drilled in the ARS specimen. Comparing the
Page 26 of 27
result with the first hole made with the bit when new, you assess wear of the bit and decide whether to continue drilling more holes or to change the bit.
7.
OPERATING AND SAFETY PRECAUTIONS
Once the speed of rotation is set within the permitted range, the drill chuck may not be able to reach the speed. If this happens, check the setting of the selector switch on the top of the drill (Figure 33) belonging to the drilling instrument. Position 1 is suitable for low speeds (20 - 200 rpm), position 2 for medium speeds (200 - 400 rpm) and position 3 for high speeds (400-1000 rpm). These values depend also on the level of the battery.
Position 1 can be set also when the system is rotating, moving the selector switch from Position 2 to Position 1.
Moreover, the other switch beside the previous selector switch must always be in the left position.
The mechanical setup has moving parts that cannot be guarded any further, particularly rotation of the bit and forward and backward movement of the plate that regulates the penetration speed of the bit.
For this reason, it is necessary to take the following precautions:
Do not wear clothing or articles that can get caught (ties, chains, etc). If
operated by people with very long hair, it is recommended that hair be tied back so that there is no possibility of it being caught
Do not put your hands near the drill when in operation or the plate when moving
The system must not be operated by anyone who has not received training.
Page 27 of 27
Figure 33 – High and low speed selector switch
8.
LIST OF SUPPLIED MATERIAL
Mechanical drilling instrument with onboard electronic control system
Tablet PC with pre-installed software (optional)
Cd-Rom with DRMS-Cordless software version 4
Monopod
USB connection lead
No. 02 rechargeable batteries
Quick battery charger
These operating instructions
Specimen holder (1 plate, 3 threaded bars, 3 wing nuts, 3 nuts, 3 wall push rods)
No. 05 diamond drills + ARS specimen
Calibration certificates, calibration declarations, CE marking conformitycertificate.