VOLUME XIV (2016), Page 95 - 106
IDENTIFYING FACTORS INFLUENCING URBAN SPATIAL
GROWTH FOR THE GEORGE TOWN CONURBATION
Mohd Amirul Mahamud1, Narimah Samat2 & Norzailawati Mohd Noor3
1&2
School of Humanities
UNIVERSITI SAINS MALAYSIA
3
Kulliyyah of Architecture and Environmental Design
INTERNATIONAL ISLAMIC UNIVERSITY MALAYSIA
Abstract
Urban growth, which caused spatial land use and land cover changes has affected various physical environment, social, and economic activities. Thus, in order to understand the dynamic process of urban spatial growth, researchers throughout the world have implemented diverse approaches, where spatial models have been developed to predict and simulate future urban growth. Those models were developed based on the driving forces that stimulate urban spatial growth. Therefore, in ensuring reliable models to be developed will be able to forecast future changes and their potential environmental effects, the driving forces must be identified. The objective of this paper is to identify possible driving forces that promote urban spatial growth of the George Town Conurbation. The study was conducted based on reviewing recent publications in journals and an on-line survey. An on-line survey was generated and distributed to academicians and urban planners to identify factors influencing urban spatial growth and their weights. The findings indicated that distance to public amenities, cheap housing price, and distance to the workplace are among factors that are important determinants of urban development. The results provide valuable insights in modelling urban growth in future research.
INTRODUCTION
Urbanisation is among the most significant process that has shaped land use activities and has drawn a great deal of attention throughout the world. It is estimated that urban population will rise from 3.57 billion in 2010 to 6.34 billion in 2050 where almost 70 percent of the world’s population is expected to live in the cities (United Nations, 2014). This immense figure is mainly due to migration from rural to city in search of better quality of life generated by urban activities and services (Deng, Wang, Hong & Qi, 2009).
However, an increase of urban population has forced cities to expand vertically or horizontally, encroaching into agricultural land and natural boundaries, and changing land use and land cover without us realizing it (Su, Jiang, Zhang & Zhang, 2011). The George Town Conurbation is no exception as exemplified by the two revisions made by Federal Department of Town and Country Planning (FDTCP, 2015a) on George Town Conurbation’s boundaries due to rapid urbanisation caused by George Town city. Deeper understanding of the concepts or mechanisms underlying the urban growth can assist toward formulating appropriate policies of urban growth management, and thus, lessening the negative impacts of urbanisation while maximising the positive impacts (Aguayo, Wiegand, Azócar, Wiegand & Vega, 2007).
In understanding urban growth and development, spatial model has been developed and implemented (Batty, 1971; Briassoulis, 2008). These models have the ability to simulate the spatial changes of land use and land cover of a city and forecast the possible urban development according to data received (Hu & Lo, 2007). In order to develop reliable models that can be used in forecasting urban change, various factors or driving forces that stimulate urban change in a very complex manner needs to be considered (Deng et. al., 2009). Thus, determining and studying the factors or driving forces that stimulate urban growth is the fundamental step in the development of such model (Verburg, Schot, Dijst & Veldkamp, 2004; Briassoulis, 2008).
BACKGROUND OF THE STUDY
To date, various studies that identify and utilise driving forces urban growth model have been conducted throughout the world (Lo & Yang, 2002; Aguayo et. al., 2007). For example, Aguayo et. al. (2007) revealed that urban growth areas are stimulated by distance and density of specific elements which implies proximity and neighbourhood are two important driving forces to urban development. It is difficult to develop an area if the road network is not well constructed because roads open many opportunities, especially for business by attracting higher population migration. Residents’ desire to live at a location with easy access to other destinations helps to explain the construction of nodes and highways in many urban areas. Road network not only facilitates residents’ daily lives but also reduces construction cost for amenities like shopping malls and hospitals (Li, Zhou & Ouyang, 2013).
Industrialisation or commercialisation which implies economic factor is also one of the important determinants in promoting urban development (Lu, Wu, Shen & Wang, 2013; Liu, Wang & Long, 2008; Lo & Yang, 2002). It offers many job opportunities which attract employees to stay in the vicinity and also influences road network development to stimulate economic factor in regional trade (Lu et. al., 2013). Lo and Yang (2002), for example, found that industrial and commercial activities are located at high-density urban area, which proved that these two activities are also important forces in developing an area. The increase of investment in secondary and tertiary industries has boosted land for residency and become the direct factors of land conversion for development (Liu et. al., 2008). Furthermore, urban growth is more likely to be expanded if the location is closer to urban centres.
In addition, Briassoulis (2008) proposed that urban model should consider bio-physical driving forces which consist of characteristics and processes of the natural environment. Suitability of a location to develop can be impacted by bio-physical factors, for instance, slope layer needs to be taken into consideration in urban expansion model (Verburg et. al., 2004). Hu and Lo (2007) proposed that steep and elevated areas are less likely to be developed due to the cost of construction and higher risk of land instability. Factors like economic gains and insufficiency of land availability might lead developer to consider developing despite the high cost and risk of slope and elevation. Apart from that, zoning status or legally protected areas have produced the best result in sensitivity analysis of developed urban model which signify it as one of important factors of urban expansion (Poelmans & van Rompaey, 2010).
China’s commercial and industrial hub. On the contrary, the United States remained relatively stable urbanisation rate due to introduction to variation of distinct zone to manage rural and urban area (Kuang et. al., 2014). Instead of exercising land use policy to direct physical development, it can also serve as a platform to promote economic, social, environment and other goals which indirectly stimulate urban development (Briassoulis, 2008).
As indicated by studies undertaken in various countries, socio-economic, economy, bio-physical and political factors played an important role in stimulating urban spatial growth (Li et. al., 2013; Liu et. al., 2008; Briassoulis, 2008; Kuang et. al., 2014). Similarly, in Malaysia, rapid urbanisation was due to various driving forces that influenced urban spatial growth especially in major urban conurbations namely Kuala Lumpur, George Town, Johor Bahru and Kuantan. These conurbations have been identified in National Physical Plan 2 (NPP2) and prioritised to facilitate urban planning process (Hashim, 2011). All the above mentioned conurbations were named after the major cities that trigger rapid urbanisation to its surroundings (FDTCP, 2015b). Although urban development brought economic benefits to the country, it may also cause negative impact to the agricultural and natural areas if proper planning is not in place (Samat, Ghazali, Hasni & Elhadary, 2014).
METHODOLOGY
Data
experienced urban growth and development since year 1990. Apart from that, 84.6% of the respondents (33 respondents) are directly involved or are well aware of urban development. 24 respondents (61.5%) are academicians specializing in urban studies and 9 respondents (23.1%) are urban planners. The reliability of the online survey has been tested, especially for question related to determine the importance of a driving force in urban growth. The result, Cronbach’s Alpha value of α=0.789, indicates that the instrument is reliable. Quantitative data was analysed using Microsoft Excel 2010 and qualitative data, in the form of direct quotations, are used to supplement the findings.
Identifying Weights for Drivers of Urban Growth
In understanding the urban development phenomenon, there are factors or drivers inevitably influencing the process either explicitly or unwittingly. For example, the existence of institutions or administrative offices in an area will directly attract developers to build residential area nearby, which consequently forces local authorities to enhance public amenities and infrastructure for the community. This situation unwittingly will result in the existence of another new town which in future will expand into city. Due to the variety of factors influencing urban development, it is necessary to figure out weights or relative importance of each identified factor, which is useful for urban planners and urban modellers.
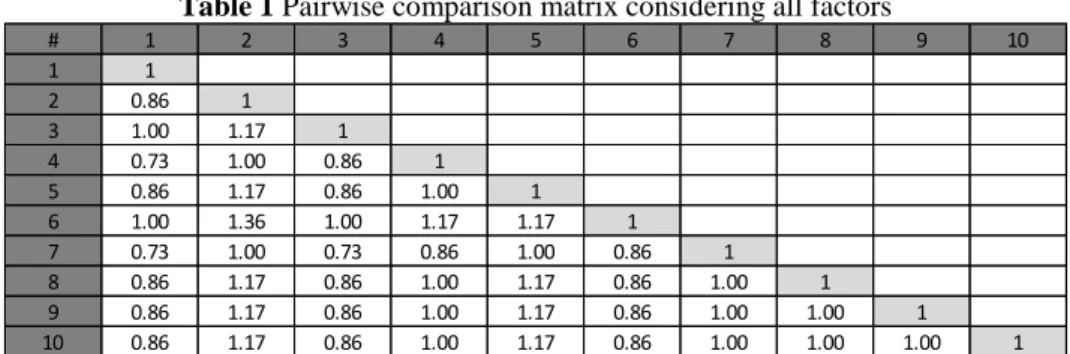
Pairwise comparison method was chosen to compute weights of drivers as this approach is a popular approach to analyse Likert Scale questionnaire (Beynon, 2002; Hossain, Adnan & Hasin, 2014). Relative importance is computed from the ratings assigned from Likert Scale and then form a “suggestion Matrix” in order to calculate weights using Pairwise comparison method (Hossain et. al., 2014). “Suggestion matrix” in determining weights of factors are shown in the following Table 1 and Table 2 below.
Table 1 Pairwise comparison matrix considering all factors
1=Distance to workplace 2=Distance to city centre 3=Cheap housing price 4=Population density or neighbourhood 5=Distance to health centre eg. public hospital, public clinic, etc. 6=Distance to public amenities eg. school, university, etc. 7=Distance to main road or highway 8=Distance to commercial or industrial area 9=Proximity to parks and natural features 10=Proximity to area that support new and growing business
# 1 2 3 4 5 6 7 8 9 10
1 1
2 0.86 1
3 1.00 1.17 1
4 0.73 1.00 0.86 1
5 0.86 1.17 0.86 1.00 1
6 1.00 1.36 1.00 1.17 1.17 1
7 0.73 1.00 0.73 0.86 1.00 0.86 1
8 0.86 1.17 0.86 1.00 1.17 0.86 1.00 1
9 0.86 1.17 0.86 1.00 1.17 0.86 1.00 1.00 1
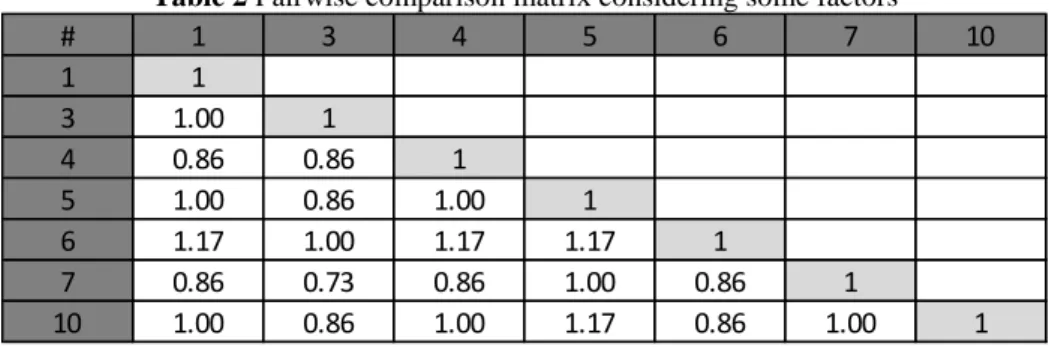
Table 2 Pairwise comparison matrix considering some factors
1=Distance to workplace 3=Cheap housing price 4=Population density or neighbourhood 5=Distance to health centre eg. public hospital, public clinic, etc. 6=Distance to public amenities eg. school, university, etc. 7=Distance to main road or highway 10=Proximity to area that support new and growing business
Study Area
The study was carried out in the George Town Conurbation, which involves the Penang State and parts of neighbouring states of Kedah and Perak as proposed by Penang State Department of Town and Country Planning (PDTCP, 2015) and in line with NNP2 of Malaysia (Hashim, 2011). It is located in the northwest coast of Peninsular Malaysia between latitude 4o 50’ N and 5o 52’ N and longitude 100o
10’E and 100o 51’E, with an area approximately 3,938 square kilometres (See
Figure 1). George Town Conurbation is a metropolitan area with a total population over 2.5 million people and it is estimated to exceed 3 million residents by 2020 (Department of Statistics, 2010). As this conurbation spreads across three states, the proposed boundary of George Town Conurbation was determined by economic criteria, distance travelled and mega projects in George Town’s neighbouring districts (PDTCP, 2015).
George Town Conurbation was selected as the study area because this area has experienced rapid development, especially in the industrial manufacturing, trade, commerce and services sectors (Samat et. al., 2014). In addition, its strategic location in establishing relationships and cooperation with regional countries and bordering regions are also one of the reasons for selecting this conurbation as the study area. This strategic location will intensify the northern territory’s role in contributing to major economic development of the country (FDTCP, 2015b). Furthermore, George Town Conurbation is one of the four major conurbations that have been highlighted in NPP 2 which implies that the study area is very significant in the development of Malaysia (Hashim, 2011). George Town Conurbation had also experienced a tremendous land use changes influenced by the spillover of Penang Development. Many people have been forced to sell their agricultural land as they are not able to earn maximum yield due to the development surrounding the land (Samat et. al., 2014). As a result, development has expanded based on land availability instead of following regulation made by the local authority.
# 1 3 4 5 6 7 10
1 1
3 1.00 1
4 0.86 0.86 1
5 1.00 0.86 1.00 1
6 1.17 1.00 1.17 1.17 1
7 0.86 0.73 0.86 1.00 0.86 1
Figure 1 The Study Area (George Town Conurbation)
Source: Penang State Department of Town and Country Planning (PDTCP, 2015)
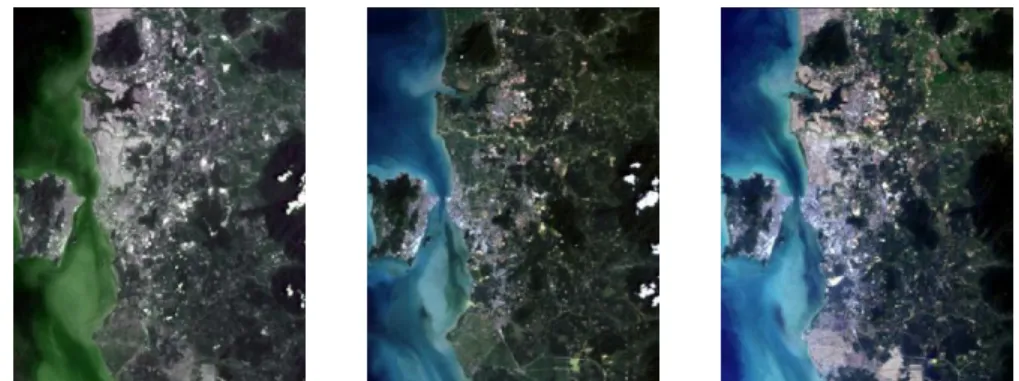
Due to that reason, Landsat images of the study area have been downloaded from the United States Geological Survey (USGS, 2014) and processed using Erdas Imagine software 2014 to assess the spread of development in George Town Conurbation.
Legend:
Figure 2 Landsat Image of Year 2002 (left), Year 2009 (centre) and Year 2014 (right)
Source: United States Geological Survey (USGS, 2014)
Figure 3(a) Land Cover, 2002 Figure 3(b) Land Cover, 2009
Table 3 Area (Hectares) Changes for Each Class Period
Class Name 2002 to 2009 2009 to 2014
Water Area 1,202 1,254
Forest Area 32,580 -41,255
Development Area 8,197.3 97,718.5
Agricultural Area -41,979 -57,718
Table 4 Area of Each Class for Different Year Period
Based on the image classification results (Table 3 and Table 4), it can be seen that developed areas has increased from 68,843 hectares to 174,759 hectares (more than 150% increase) from 2002 to 2014 respectively. The increase of developed areas is at the expense of agricultural land which decreased from 284,572 hectares in 2002 to 184,875 hectares in 2014 (total changes of -99,697ha). Forest area also experienced a decreasing change, from 209,821 hectares in 2002 to 201,146 hectares in 2014. These results show that George Town Conurbation has been experiencing rapid urban growth over the last decade or so.
RESULTS AND DISCUSSIONS
Based on the driving forces identified and gathered from published articles in journals, this study utilized online survey to determine weight for each factor in influencing urban spatial growth. These weights and factors will later be used in modelling the dynamic urban spatial growth of the study area. Table 5 shows the weights for each factor as indicated by the data gathered from the survey.
Table 5 Factors with Respective Weighting Value
Factors Weight 5a Weight 5b
Distance to public amenities e.g. school, university, etc.
0.1122 0.1589
Distance to workplace 0.1141 0.1457
Proximity to area that support new and growing business
0.0977 0.1393
Class Name Area (Hectares)
2002 2009 2014
Water Area 186,999 188,201 189,455
Forest Area 209,821 242,401 201,146
Development Area 68,843.2 77,040.5 174,759 Agricultural Area 284,572 242,593 184,875
Overall Classification Accuracy (%)
80.08 83.59 81.25
Distance to health centre e.g. public hospital, public clinic, etc.
0.0950 0.1333
Distance to main road or highway 0.0906 0.1276 Distance to commercial or industrial area 0.0977 - Proximity to parks and natural features 0.0977 -
Distance to city centre 0.0879 -
Cheap housing price 0.1123 0.1589
Population density or neighbourhood 0.0948 0.1362
Consistency Ratio 0.004 0.001
Weight 5a in Table 5 are weighting values for all factors rated by the respondents, whilst Weight 5b are weighting values after removing three factors with lowest mean rated by the respondents. Distance to workplace, cheap housing price and distance to public amenities have been rated by the respondents as the most important factors that affecting urban development with weights of 0.1141, 0.1123 and 0.1122 respectively. Similarly, according to Samat (2007) proximity to employment centres have been rated as most influence factor in urban growth. In addition, the study by Samat, Hasni & Elhadary (2011) also proved that Northern Seberang Perai in Penang has experienced an increased rate of urban growth with the development of education institutions especially in Bertam. As a result of the development of the institutions, many sites neighbouring those institutions developed rapidly while other areas grow much slower (Samat et. al., 2011).
CONCLUSION
A good dynamic urban model should be able to account identified driving forces in order to utilise land within a boundary optimally. Based on the literature review, it was found that three major driving forces stimulate urban development namely: physical landscape, socio-economic and environment. Meanwhile, respondents of the survey conducted during this study have rated distance to workplace, cheap housing price and distance to public amenities as factors with most influence on urban growth. The respondents also provided valuable data (weight) for modelling urban growth. However, some respondents also proposed that political factor should be considered in predicting urban growth. Findings from previous research proved that this political factor does have a significant impact to urban growth but it is very difficult to quantify it. Therefore, future research could investigate political factors, which influence urban growth using qualitative approach.
ACKNOWLEDGEMENTS
Authors wish to thank Ministry of Higher Education (MoHE) for funding the research through Fundamental Research Grant Scheme (FRGS) grant number 203/PHUMANITI/6711472, Federal and Penang State Department of Town and Country Planning for providing the land use data and to those who has participated in responding to the online survey in this study.
REFERENCES
Aguayo, M. I., Wiegand, T., Azócar, G. D., Wiegand, K. & Vega, C.E. (2007). Revealing the driving forces of mid-cities urban growth patterns using spatial modeling: a case study of Los Ángeles, Chile. Ecology and Society, 12(1): 13 [online] URL: http://www.ecologyandsociety.org/vol12/iss1/art13/
Batty, M. (1971). Modelling cities as dynamic systems. Nature, 231, 425-428.
Beynon, M. (2002). DS/AHP method: a mathematical analysis, including an understanding of uncertainty. European Journal of Operational Research, 140, 148-164.
Briassoulis, H. (2008). Land-use policy and planning, theorizing, and modeling: lost in translation, found in complexity? Environmental and Planning B, 35, 16-33. Deng, J.S., Wang, K., Hong, Y. & Qi, J.G. (2009). Spatio-temporal dynamics and evolution
of land use change and landscape pattern in response to rapid urbanization.
Landscape and Urban Planning, 92, 187-198.
Department of Statistics (2010). Population distribution and basic demographic characteristics. Department of Statistics, Malaysia.
Hashim, N. (2011). The Planning & Implementation of Urban Agglomeration. Kuala Lumpur: Malaysian Institute of Planners.
Hossain, M.F., Adnan, Z.H. & Hasin, M.A.A. (2014). Improvement in weighting assignment process in Analytic Hierarchy Process by introducing suggestion matrix and Likert scale. International Journal of Supply Chain Management, 3(4), 91-95.
Hu, Z. & Lo, C. P. (2007). Modeling urban growth in Atlanta using logistic regression.
Computers, Environment and Urban Systems, 31(6), 667-688.
Kuang, W., Chia, W., Lu, D. & Dou, Y. (2014). Comparative analysis of megacity expansions in China and the U.S. patterns, rates and driving forces. Landscape and Urban Planning, 132,121-135.
Li, X., Zhou, W. & Ouyang, Z. (2013). Forty years of urban expansion in Beijing: What is the relative importance of physical, socioeconomic, and neighborhood factors? Applied Geography, 38, 1-10.
Liu, Y.S., Wang, L.J. & Long, H.L. (2008). Spatio-temporal analysis of land-use conversion in the eastern coastal China during 1996-2005. Journal of Geographical Sciences, 18(3), 274-282.
Lo, C.P. & Yang, X. (2002). Drivers of land-use/land-cover changes and dynamic modeling for the Atlanta, Georgia Metropolitan Area. Photogrammetric Engineering & Remote Sensing, 68(10), 1073-1082.
Lu, C., Wu, Y., Shen, Q. & Wang, H. (2013). Driving force of urban growth and regional planning: A case study of China’s Guangdong Province. Habitat International, 40, 35-41.
Malczewski, J. (1999). Visualization in multicriteria spatial decision support systems.
Geomatica, 53, 139-147.
Penang State Department of Town and Country Planning (PDTCP) (2015). Pernyataan
Dasar-Dasar dan Cadangan Umum RSNPP 2020, retrieved on 5 June 2015, from
http://jpbdgeoportal.penang.gov.my/jpbd/RSN/ Topik_4.0.html [In Bahasa]. Poelmans, L. & van Rompaey, A. (2010). Complexity and performance of urban expansion
models. Computers, Environment and Urban Systems, 34, 17-27.
Saaty, T. A. (1992). Decision-making for leaders (2nd Edition). Pittsburgh: RWS Publication.
Samat, N. (2007). Integrating GIS and Cellular Automata Spatial model in evaluating urban growth: prospects and challenges. Jurnal Alam Bina, 9(1), 79-93.
Samat, N., Hasni, R. & Elhadary, Y. (2011). Modelling land use changes at the peri-urban areas using Geographic Information Systems and Cellular Automata model. Journal of Sustainable Development, 4(6), 72-84.
Samat, N., Ghazali, S., Hasni, R. & Elhadary, Y. (2014). Urban expansion and its impact on local communities: A case study of Seberang Perai, Penang, Malaysia. Pertanika J. Soc. Sci. & Hum., 22(2), 349-367.
Su, S., Jiang, Z., Zhang, Q. & Zhang, Y. (2011). Transformation of agricultural landscapes under rapid urbanization: a threat to sustainability in Hang-Jia-Hu region, China.
Applied Geography, 31, 439-449.
United Nations (2014). World Urbanization Prospects (CD-ROM Edition). Population Division of the Department of Economic and Social Affairs, United Nations. U.S Geological Survey (USGS) (2014). Earth Explorer, Maps, Imagery and Publications,
retrieved on 29 July 2015, from http://earthexplorer.usgs.gov/