Hungarian Association of Agricultural Informatics European Federation for Information Technology in Agriculture, Food and the Environment
Journal of Agricultural Informatics. Vol. 8, No. 1 journal.magisz.org
Special extension opportunities of CReMIT method in time series analysis and
their application in forestry
Zoltán Pödör1
I N F O
Received 9 Jan. 2017 Accepted 6 Feb. 2017
Available on-line 15 Mar. 2017 Responsible Editor: M. Herdon
Keywords:
time series, CReMIT, climate, tree growth
A B S T R A C T
One of the problems frequently arising in connection with the study of time series is the thorough examination of relationships and correlations between the examined time series. In the case of time series with periodicity, study of the effects of periods with different time shifting, delayed, and varying length of windows can be also examined by using the early developed systematic CReMIT (Cyclic Reverse Moving Intervals Techniques) method. In this paper we present a special extension to this method that allows to alloy the CReMIT, the moving intervals and evolutionary techniques. It makes it possible to examine the temporal changes of the effects and relationships using evolutionary and moving interval techniques on special secondary time series derived by CReMIT. The function and applicability of the extended method are introduced on forestry, tree growth and meteorological data because of the weight of climate change. The climate change studies provide further motivation to examine the relationships between forestry parameters (tree growth) and environmental factors.
1. Introduction
Searching for relationships between time series is a major area of statistics and data mining. A huge number of techniques are available and among them correlation and regression analysis (Miles & Shevlin 2001; Myers 1990) are the most frequently used for defining connections between one or more independent and dependent variables. Beside the applied analysis methods, the completeness of the examinations can be significantly affected by the sphere of the involved dependent and independent variables. For example, the methods of cluster-analysis (Han & Kamber 2006), or PCA/ICA (Abdi & Williams 2010) can be adapted for the dimension reduction of datasets. In several steps of an analysis method, only a special portion of the full time series is used instead of the full range of the available time series. If we have a proper length time series, the temporal changes of the relationships can be examined by using the forward and backward evolution and moving interval techniques (Biondi & Waikul 2004). The essence of the moving interval technique is that the length of the examined interval is always fixed and the starting point is moved forward by one period in each iteration step. In the case of the evolutionary technique the starting point is fixed, and the interval length is increased by one period in each iteration step (Fritts 1970; Mudelsee 2010). These window-based techniques can be used not only during the breakdown of the whole examined data line into intervals, but also in a more specific manner in the case of periodic time series. Founded on the mentioned windows-based methods above, a special systematic window concept called CReMIT (Cyclic Reverse Moving Intervals Techniques) method combines the solution of moving intervals and evolutionary techniques, was created (Pödör, Edelényi & Jereb 2014a), This basic CReMIT makes it possible to systematically widen the sphere of the used dependent or independent variables with the derived transformed time series. It is important that the CReMIT method is independent of the applied analysis technique. However, the CReMIT uses the full, available time series to systematically generate the derived time series. The extension of the basic CReMIT method with the evolutionary and moving interval techniques insures the further extension of variables and the depth of the analysis. The extended CReMIT gives opportunities for the examination of the temporal changes of derived time series (based on the basic CReMIT) and relationships. The practical applicability of the extended
1 Zoltán Pödör
CReMIT method is widely confirmed by the studies of correlations between yearly tree growth and monthly climate data. CReMIT was used on meteorological data, as independent variables to extend the analysis possibilities. The main aim of this paper is the description of the extended CReMIT method, but not the deduction of forestry results.
2. Short description of CReMIT
Let be ts a given time series ts and P be its natural period. The elements of this time series are stored in a vector. Let the first element of ts, ts1 be the chronologically latest element, and natural numbers will be assigned to the data accordingly, the length of the vector is m.
(1) ts ts ts ts m 2 1
Let SP
1SPP
the SPth element of the vectorts
denotes the starting point of the currently applied investigation. Special windows are applied on the vector ts, the actual time shifting(
i
)
and width
j values of a window are defined on the basis of this index. The minimal value of time shifting can be 0
i0
, and the window width can be 1
j0
. Based on the periodP
of the basic time series, the above defined window will be periodically repeated with the maximum cycle number)
(MCN . As shown in Equation (2), the value of MCN depends on the defined parameters
SP,i,j
:(2)
1P j i SP n MCNts
, where
is the entire function.The starting and end point indexes of the windows created with the actual SP i and j values can be defined as
SPilP;SPi jlP
, where 0lMCN1. Using these parameters two temporal vectors are defined for the storage of the index values representing the limits of the windows as denoted in Equation (3) and Equation (4).(3)
P MCN i SP P i SP P i SP indexbegin 1 1 0 (4)
P MCN j i SP P j i SP P j i SP indexend 1 1 0 By using the above defined index vectors a pre-defined transformation function
TR
(for example mean, maximum, minimum, sum) can be applied on the elements of the individual windows.Based on the above described starting point SP
1SPP
, the maximum time shifting value I
0iI
and the maximum window width J
0 jJ
, pre-defined on the basis of the task all the potential tr_tsSP,i,j transformed vectors can be generated on a systematic way. The values of I andJ depend on the actual investigation and they are defined by the user.
2.1. Applicability of CReMIT
The CReMIT method was applied as part of an analytical process in order to ensure its application in practice. The process consists of three main parts: (a) data preparation, (b) execution of the CReMIT method, and (c) analytical modules. After data preparation is completed, the data enter the second transformation module that executes the CReMIT method. The third, the analytical module of the shell, receives the derived time series and executes the pre-defined analytical process. The derived time series generated by the CReMIT module can be used in any analytical process which ensures a high level of flexibility.
The practical applicability of the CReMIT method and the analytical process developed to expand the study of periodical time series are widely confirmed by the studies of correlations between tree growth, climate (Edelényi, Pödör, Jereb & Manninger 2011; Manninger, Edelényi, Pödör & Jereb 2011), and butterfly trapping data (Csóka, Pödör, Hirka, Führer & Szőcs 2012; Csóka, Pödör, Hirka, Führer, Móricz, Rasztovics & Szőcs 2013; Pödör, Csóka & Kiss 2013), the health of trees and climatic features (Pödör, Kolozs, Solti & Jereb 2014b).
The output size of the CReMIT method depends on the parametrization, and it is usually big. Therefore, the evaluation of the received results is really important for an expert from a special area of the studies.
3. The extension opportunities of CReMIT
The CReMIT method is independent of the applied analysis methods following the systematic extension of the basic time series, such as correlation and regression analysis (Myers 1990). However, the basic CReMIT method uses the full available, or the user selected
ts
time series to generate thets
tr_ SP,i,j transformed vectors. By using this approach, the relationships relative to the full tscan be examined. Nevertheless, sometimes we want to examine the temporal changes of the relationships, not only the static results for the full ts. It is especially important in the case of the environmental and forestry datasets - which defined the development of the basic CReMIT method – in view of the climate change.
3.1. The theoretical background
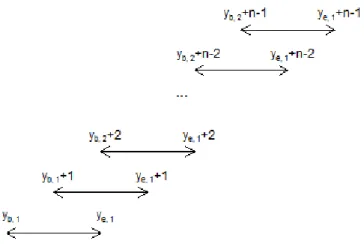
Figure 1.Moving interval technique for times series
Figure 2.Evolutionary technique for time series
Let tr_tsSP,i,j,
1SPP
, I
0iI
, J
0 jJ
, be the transformed vector corresponding to the basic CReMIT method with the parameters SP,i,j. The tr_tsSP,i,j vectors are created on the whole length of the examined time series. Therefore, it is not suitable for the examination of the temporal changes of the relationships.Let us suppose that the original
ts
time series containm
pieces of periods with length P (for examplem
is the number of years, and P12 by using monthly data in time series). The basic CReMIT method is complemented with the evolutionary and moving interval techniques. We are able to examine the temporal changes of relationships on given time shifting and window width. To do this we have to define a start and an end point. These points determine the initial interval of booth methods.Let us denote the beginning period by BP, and the ending period by EPMCN, where 1
BP
(6)
EP index EP index TR BP index BP index TR BP index BP index TR ts tr end begin end begin end begin j i SP ; 1 ; 1 ; ) 1 ( _ ,, Then, according to the selected procedure (moving interval, or evolutionary techniques), the additional intervals are generated. Let us denote by k the step kth of the given method. In the case of evolutionary technique, the length of the examined interval increases by one period step by step, without changing its starting point:
(7)
1 ; 1 1 ; 1 ; ) ( _ ,, k EP index k EP index TR BP index BP index TR BP index BP index TR k ts tr end begin end begin end begin j i SP By using the moving interval technique the length of the intervals are fixed, and the starting point is moved forward by one period step by step:
(8)
1 ; 1 ; 1 ; 1 ) ( _ ,, k EP index k EP index TR k BP index k BP index TR k BP index k BP index TR k ts tr end begin end begin end begin j i SP The above described methods and the software frame were implemented in the open source R (R 2.15.2. version, R Development Core Team, 2008) environment and the mean, amount, minimum and maximum were the implemented elementary TR functions. The default analysing procedure was the linear correlation analysis with Student’s t-test to evaluate the significance of the correlation coefficients.
3.2 Application of the extended method – an example
We represent the above described extension opportunities of the CReMIT method on a forestry dataset. Let the dependent parameter be the yearly tree growth data, and let the independent parameters be the monthly precipitation sum values. We would like to examine the relationships between the climatic factors (precipitation, temperature) and tree growth variables, but it is insufficient to compare only the simple monthly climatic and yearly tree growth time series.
The basic CReMIT method makes it possible to create and add several derived climatic variables - with different width and time shifting values for the examinations of the relationships. It has a really important part in the concern of the examined data sets; after all, the forestry parameter is affected by a period that is more than any given month. Moreover it is worthy to involve the climatic features of the past year in addition the actual year into the examinations.
At the same time, the basic CReMIT method uses the entire available time series in the process of the window creating. Therefore, it is unsuitable for the examination of the effect of a time interval – defined by a CReMIT created window – that is constant or that changes in time. It is an especially important task because of the effects of supposed climate change. Altogether it is uncertain that the same climatic variables of different time periods (for example: 1960-2010, 1960-1990, or 1990-2010) have the same effect on the same independent parameters. By using the extended CReMIT method we demonstrate the effect of changing climatic variables on the tree growth data.
4
SP , September is the last examined month (in actual year),
12
I , the maximal time shifting value,
5
J , the maximal window width value.
In practice it means that all possible time windows were created from September of the actual year to April of the previous year with a maximum 6 month width for the monthly precipitation data. Altogether 93 different time periods (windows) were created. We used the undermentioned notations:
prec_x shows that the examined parameter is the precipitation and x the number of month. The a_, and
p_ prefixes show that the data come from the previous, or from the actual year. For example
p_prec_10 - a_prec_3 means that the period from the previous year October to the actual year March;
it is a window of 6 month width. Using the precipitation sum values of all created periods, it is possible to examine the effect of these periods on tree growth data.
But if we are curious about the temporal changes of the effects, then we should use the extended CReMIT method. Let the minimal interval length be 20 years, that is BP1962 and EP1981. By using this parametrization 28-28 intervals were generated by both the moving interval and the evolutionary techniques. Moving intervals: 1962-1981; 1963-1982; 1964-1983;…;1988-2007 and 1989-2008. Evolutionary technique intervals: 1962-1981; 1962-1982; 1962-1983;…; 1962-2007 and 1962-2008.
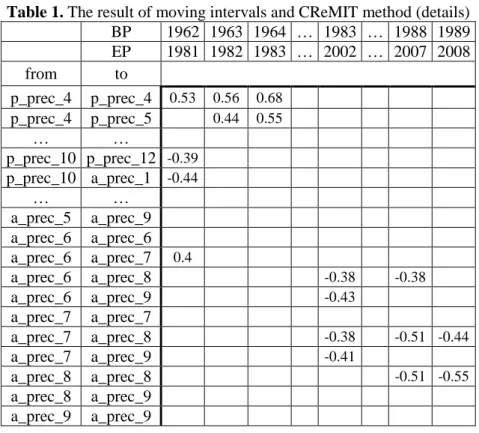
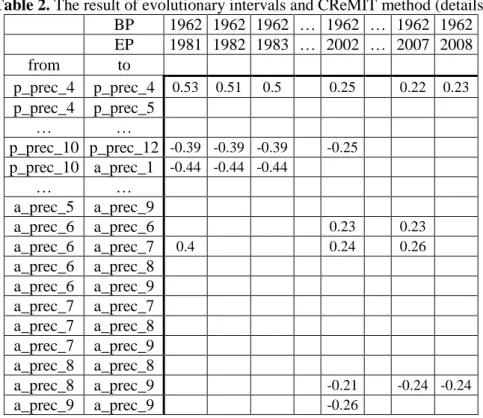
We analysed the relationships between the independent variables (93 time periods derived by extended CReMIT method, and 28-28 intervals) and the yearly tree growth data using simple linear correlation analysis. The significance of correlation coefficients were evaluated by Student’s t-test at the level of significance α=0.05 with the number of degrees of freedom n-2. In Table 1 and Table 2 only the statistically significant correlation values were shown.
Table 1. The result of moving intervals and CReMIT method (details)
BP 1962 1963 1964 … 1983 … 1988 1989
EP 1981 1982 1983 … 2002 … 2007 2008
from to
p_prec_4 p_prec_4 0.53 0.56 0.68
p_prec_4 p_prec_5 0.44 0.55
… …
p_prec_10 p_prec_12 -0.39
p_prec_10 a_prec_1 -0.44
… …
a_prec_5 a_prec_9
a_prec_6 a_prec_6
a_prec_6 a_prec_7 0.4
a_prec_6 a_prec_8 -0.38 -0.38
a_prec_6 a_prec_9 -0.43
a_prec_7 a_prec_7
a_prec_7 a_prec_8 -0.38 -0.51 -0.44
a_prec_7 a_prec_9 -0.41
a_prec_8 a_prec_8 -0.51 -0.55
a_prec_8 a_prec_9
Table 2. The result of evolutionary intervals and CReMIT method (details)
BP 1962 1962 1962 … 1962 … 1962 1962
EP 1981 1982 1983 … 2002 … 2007 2008
from to
p_prec_4 p_prec_4 0.53 0.51 0.5 0.25 0.22 0.23
p_prec_4 p_prec_5
… …
p_prec_10 p_prec_12 -0.39 -0.39 -0.39 -0.25
p_prec_10 a_prec_1 -0.44 -0.44 -0.44
… …
a_prec_5 a_prec_9
a_prec_6 a_prec_6 0.23 0.23
a_prec_6 a_prec_7 0.4 0.24 0.26
a_prec_6 a_prec_8
a_prec_6 a_prec_9
a_prec_7 a_prec_7
a_prec_7 a_prec_8
a_prec_7 a_prec_9
a_prec_8 a_prec_8
a_prec_8 a_prec_9 -0.21 -0.24 -0.24
a_prec_9 a_prec_9 -0.26
The results in Table 1 and Table 2 showed that the relationships changed in time. There are time periods which have significant r values in the first 20 years periods while there are not in the middle, or the last periods, or vice versa. These result can be important in the course of the examination of the climate change effects.
Table 1 shows the results of 20 year long moving intervals (the starting points, BP are different) and Table 2 shows the results of different length time series (from 20 to 47 years), where the starting points (BP) are the same. The moving interval technique may represent the changing of the relationships better, because the starting points (BP) of the examined time intervals are moving in time. We can compare the relationships of the first 20 years (1962-1981) and the relationships of the last 20 years (1989-2008). It is important to detect the effect of climate change in nature.
In this chapter our aim was to introduce the applicability of the extended CReMIT method without declaring forestry results. Due to the size of the result tables, we only emphasize the parts which can show the change of relationships in time.
4. Conclusions
The study of time series and the analysis of their interrelations are highly important and are major areas of statistics and data mining and, therefore, the results presented herein may be related to these professional fields. The basic aims in analysing relationships are to define the strength of the relationships between variables and to define functions to describe these interrelations.
The efficiency of search for connections between time series can be affected by the applied analysis methods, the sphere of derived time series and the use of variables. A special time series transformation method based on CReMIT which can support the analysis of complex and deep relationships between the examined time series, is presented. The CReMIT method permits the systematic expansion of the parameters based on the applied window technique. It makes it possible to create different time periods beside the raw data (for example monthly data). These derived time series can be used in the relationships examinations.
derived time series and the examination opportunities. This expansion gives us a real opportunity for the examination of the temporal changes of the relationships between the time series.
We illustrate the applicability and the function of this methodology through an example of forestry. The dependent variable is the yearly growth data of a tree from 1962 to 2008, and the basic independent variables are the monthly precipitation sums from 1961 to 2008. We can examine the effect of precipitation sums of different time periods from the previous year April to September of the actual year using the minimal interval length of 20 years. Due to the supposed climate change, it is an important area where we can efficiently use the presented methodology.
However, the applicability of the method is not limited to the forestry problems that had originally motivated its development the procedures developed can also be applied in any other field where the analysis of relationships between periodic time series is of fundamental importance.
References
Abdi, H & Williams, J L 2010 ‘Principal component analysis.’ Wiley Interdisciplinary Reviews:
Computational Statistics, vol. 2, no. 4, pp 433–459.
Biondi, F & Waikul K 2004 ‘DENDROCLIM2002: A C++ program for statistical calibration of climate signals in tree-ring chronologies’ Comp Geosci vol. 30, pp 303–311. doi: https://doi.org/10.1016/j.cageo.2003.11.004
Csóka, Gy, Pödör, Z, Hirka, A, Führer, E & Szőcs, L 2012 ‘Influence of weather conditions on population fluctuations of the oak processionary moth (Thaumetopoea processionea L.) in Hungary’
Joint IUFRO 7.03.10 – “Methodology of forest insect and disease survey” and IUFRO WP 7.03.06 –
“Integrated management of forest defoliating insects” Working Party Meeting, 10-14 Sep 2012,
Palanga, pp 10.
Csóka, Gy, Pödör, Z, Hirka, A, Führer, E, Móricz, N, Rasztovics, E & Szőcs L 2013 ‘Időjárásfüggő fluktuáció a tölgy búcsújáró lepke nyugat-magyarországi populációinál’ Növényvédelmi Tudományos
Napok 19-20 Feb 2013, Budapest
Edelényi, M, Pödör, Z, Jereb, L & Manninger M 2011 ‘Developing of method for transforming time series data and demonstration on forestry data (in Hungarian)’ Acta Agraria Kaposváriensis vol. 15, no. 3, pp 39-49.
Fritts, H C 1976 Tree rings and climate Academic Press, London, p 582.
Han, J & Kamber, M 2006 ‘Data Mining: Concepts and Techniques, 2nd ed.’, Morgan Kaufmann Publishers, p 703.
Mudelsee M 2010 Climate Time Series Analysis – Classical Statistical and Bootstrap Methods, Springer, p 467.
Manninger, M, Edelényi, M, Pödör, Z & Jereb L 2011 ‘The effect of temperature and precipitation on growth of beech (Fagus sylvatica L.) in Mátra Mountains, Hungary’ Applied Forestry Research in the
21st Century conference, 13-15 Sep 2011, Prága-Pruhonice pp 22-23.
Miles, J & Shevlin, M 2001 ‘Applying Regression and Correlation: A Guide for Students and Researchers’ Sage publications Ltd: p 251.
Myers H R 1990 ‘Classical and modern regression with applications (second edition)’ Virginia Polytechnic Institute and State University, Duxbury, Thomson Learning: p 488.
Pödör, Z, Csóka, Gy & Kiss B 2013 ‘Simple- and Multivariate data analysis of light trap catching data by a systematic window procedure’ Decision Support System Workshop and ForestDSS Community of
Practice, 4-6 Dec 2013, Lisbon
Pödör, Z, Edelényi, M & Jereb L 2014a ‘Systematic Analysis of Time Series – CReMIT’
Pödör, Z, Kolozs, Solti Gy & Jereb L 2014b ‘Investigation of Hungarian forest health condition with special respect to climate change’ Journal of advances in agriculture vol. 3, no. 2, pp 164-176.