Comparison of Several Improved Versions of Particle Swarm Optimizer
Algorithm for Parameter Estimation of Squirrel-Cage Induction Motors
*
Mohammad Yazdani-Asrami
1, Mehran Taghipour Gorjikolaie
2and S. Asghar Gholamian
11Faculty of Electrical and Computer Engineering, Babol University of Technology, Babol, Iran 2Faculty of Electrical and Computer Engineering, University of Birjand, Birjand, Iran
E-mail: [email protected]
Abstract:
In this paper, three versions of Particle Swarm Optimization (PSO) are proposed to estimate the equivalent circuit parameters of squirrel cage induction motor. It is believed that how inertia weight changes during iterations can impact on final results. Constricted coefficients, linear model and exponential version are used as inertia weight, each of them presents different variations for inertia weight and consequently for particle movements and speed of such movements. In the linear version, particles start searching process with high speed and their speed will decrease by constant ramp, this kind of variation let to search all solution space in a short time and local search at the final iterations with low speed, also exponential version presents same treatment as linear version with non-linear variations in inertia weight and speed of movement. But, mathematical analysis shows that they trap into local minima and scientists presents constricted version to solve this problem. In order to evaluate proposed versions additional to make changing in PSO’s version, sensitivity of proposed methods is analyzed using three sets of data. Results confirm the ability of proposed method which can estimate parameters with a possible least error.
Keywords: Equivalent circuit parameters, Induction motor, Parameter estimation, Particle Swarm Optimization
Introduction
Induction machines are extensively applied in all sectors of industrial power networks due to their low price and ruggedness. The presence or absence of a large induction machine or a combination of machines in power systems plays a significant role in their transient stability or security assessment. Accurate machine parameters are essential for systems behavior prediction. Machine parameters are also crucial in industrial system studies (Perez et al., 2012).
Electric drives using induction motors (IM) are one of the main fields of interest to the control systems and electrical engineering specialists. The quality and effective control of IM is based on their equivalent circuits. The necessity of knowing the equivalent circuit parameter of IM is constantly growing due to the following reasons (Kostov et al., 2009; Pillay et al., 1997; Leonhard, 2001):
1) Engineers and Students should get deeper, up-to-date and accurate knowledge in the physical processes
occurring in IM
2) Designed power converters should possess better quality indices in static and dynamic modes
3) Increasingly adequate models of IM are needed for their research and improvement.
Generally, estimation methods of induction motor parameter can be classified into five different categories, depending on what data is available, and what data is used for:
2) Parameter estimation based on steady-state motor models:
The methods in this category use iterative solutions based on induction motor steady-state network equations and given manufacturer data (Hung and Dommel, 1996). This is the most common type of parameter estimation for system studies since the data needed for it is usually available.
3) Frequency-domain parameter estimation:
The frequency response method is based on measurements that are performed at standstill. The motor parameters are estimated from the resulting transfer function (Willis et al., 1989). The major advantage of this method is its accuracy. However, stand-still tests are not common industry practice, and this method can therefore not be used very often.
4) Time-domain parameter estimation:
For this type of method, time-domain motor measurements are performed and model parameters are adjusted to match the measurements (Ju et al., 1996; Moon and Keyhani, 1994). Since not all parameters can be observed using measurable quantities, the motor models need to be simplified (Ju et al., 1996). The method is costly, and the required data is usually not available.
5) Real-time parameter estimation:
This type of parameter estimation is used to tune the controllers of induction motor drive systems. This requires real-time parameter estimation techniques, using simplified induction motor models, which are fast enough to continuously update the motor parameters and therefore prevent the detuning of induction machine controllers (Willis et al., 1989; Zaremba and Pavlov, 2002).
The newest class of the estimation methods is heuristic based methods, applied in the present paper. The survey of the methods for equivalent circuit parameters estimation shows, that adjustable, cost and accuracy are the major considerations when selecting a method for determining IM parameters. Users prefer a cheap and low adjustable method providing good accuracy. The evolutionary algorithm (Nangsue et al., 1999), genetic algorithm (GA) (Bishop and Richards, 1990; Rahimpour et al., 2007; Huang et al., 2001; Orlowska Kowalska et al., 2006), adaptive GA (Abdelhadi et al., 2004), artificial neural network (ANN) (Michael and Ronald, 1995; Bae, 1997) and differential evolution (DE) (Ursem and Vadstrup, 2003) have been used for parameter determination of induction motor.
The conventional method for estimation of IM equivalent circuit parameters is based on the no-load and blocked rotor tests which are a time-consuming
task, especially if the motor is already coupled to driving equipment. This paper presents a more sophisticated approach for determining the equivalent circuit parameters of induction motors. The approach is based on only a set of measured or analytically obtained data such as stator voltage, current, power factor and slip. Particle swarm optimization (PSO) algorithm models for determining the parameters are synthesized that enables the simultaneous satisfaction of steady-state stator current and power factor by defining an objective function. The results obtained by the synthesized model are compared with analytical data. An analysis is performed that proves the validity and adequacy of such models in IM control systems. In the rest of the paper, overview of three versions of PSO has been presented in section 2. How can PSO be used for parameter estimation is stated in section 3 and obtained results are discussed in section 4. And finally, section 5 includes conclusion of the paper.
Overview of Particle Swarm Optimization
Particle Swarm Optimization: A Basic Version
Vt+1 = W × Vt + C1 × r×(Ppb – Xcs ) + C2 ×r×(Pgb – Xcs ) (1)
Xt+1 = Xt + Vt+1 (2)
Where W is the inertia weight, Vt+1 is the particle velocity, Xcs is the current particle (solution) of each particle, Ppb and Pgb are Pbest and Gbest, r is a random number between [0,1] and C1, C2 are learning factors.
PSO versions: from topology point of view
The main PSO categorized into two major topologies: global PSO and local. Several tests show that global version has a worse search space coverage than the local PSO, also in global version particles’ movement are more concentrated around one solution and therefore can more quickly find the best solution. An inappropriate problem may occur for global version is very susceptible to local minima. In general, global version is the better choice when solution space is not very scattered, because of its speed and accuracy (Clerc and Kennedy, 2002; Zahiri, 2010).
Following code shows global PSO algorithm’s pseudo code:
For each particle Initialize particle End
Do
For each particle
Evaluate objective function and calculate fitness value
If the fitness value is better than the best fitness value Pbest in history
Set current value as the new Pbest End
Choose the particle with the best fitness value of all the particles as the Gbest
For each particle
Update particle’s velocity according Equation (1) Update Particle’s position according Equation (2) End
While maximum iteration or minimum error criteria is not attained
PSO versions: from inertia weight point of view
Inertia weight is the other factor that its changes can make new versions of PSO. In this case, amount of momentum that a particle carries between iteration can be controlled by a parameter w that multiplied by the particle’s current velocity, as it can be seen in Equation (1). Indeed, this control parameter influences the particle’s area of exploration. So, the amount of this parameter can play an important role in searching process. Using a high constant value of inertia weight
(e.g. more than unit) although can cover more area, but often PSO trap in local minima and can’t find best solution. In the other hand, a lower value of this parameter will lead to particles concentrating on small search space and PSO losses the other possible solution spaces. In this paper, using different equations for inertia weight, three version of PSO is presented and used for parameter estimation of induction motor. As mentioned before, using not proper constant value for this control parameter may result in not suitable results, so one idea is using an equation for inertia weight that depends on the number of pass iterations so that decreases during search process. Using high value of inertia weight in initialization step can help PSO to search all area of the solution space, by spending time and increase of the number of iteration, inertia weight decreases; this can help PSO to present good local search at the final iterations. Equations (3) and (4) show the inertia weights of first and second used PSO in this paper, respectively.
)
( max min
max t
T w w w
W (3)
Where, wmax and wmin are the maximum and minimum values of inertia weight, respectively. T is the maximum iteration and t is the current iteration. As it can be seen in Equation (3), PSO search process is stated by a value less than wmax and when it wants to be finished inertia weight is equal to wmin. Several testes in this work show that best interval for wmax is 0.9 to 1.1 and for wmin is 0.01 to 0.1.
The other formula for inertia weight can be exponential format, as shown in Equation (4). Using this equation, PSO starts by a given value and decreases exponentially to near zero.
T t
e
w
W
max (4)
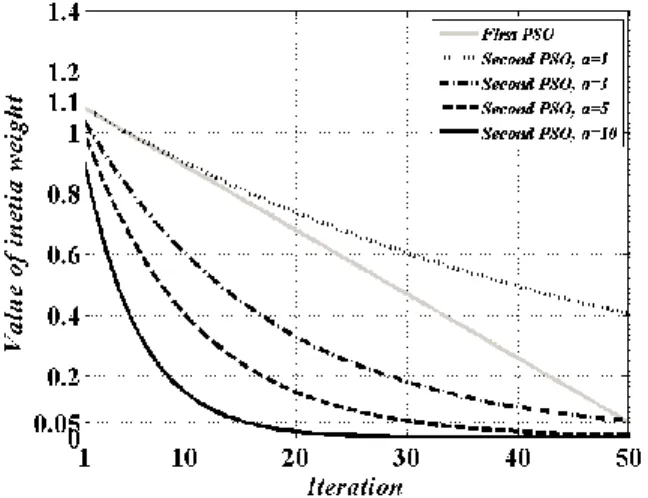
Where, wmax is the maximum values of inertia weight. Coefficient α is a positive constant that amount of it can control ramp, slope and bend of variations. Figure 1 shows the typical variations of proposed versions of PSO.
Figure 1: Typical variations of proposed versions of PSO:
wmax and wmin are 1.1 and 0.05, and also in order to show the influence of coefficient α, it is changed from 1 to 10.
Figure 2: T-shape induction motor equivalent circuit without considering the steel losses
k
else
for
4
4
2
2
2
(5)
Vt+1 = χ × (Vt + φ1×(Ppb – Xcs ) + φ2×(Pgb – Xcs )) (6)
Where, coefficient χ is constriction coefficient which is used as inertia weight. Coefficients φ1 and φ2 are random numbers uniformly distributed in the range (0, φ/2). We set k=1, meaning that the space thoroughly searched before the swarm collapses into a point (Zahiri, 2010).
Application of Proposed Methods
As you know, one of the main applications of PSO is its powerful optimizing ability. In this paper, using this ability of PSO our purpose to estimate parameters of induction motor has been satisfied. As usual, PSO is
used for optimizing (minimizing) a designed objective function. It is worth noting that this optimization is the skin and output layer of the problem, indeed by utilizing this ability when designed objective function is minimized, the constructing parameters of this function obtain their optimum value. So, something which is important here and is the main part of the proposed method is objective function.
Designed objective function
In order to estimate parameters of induction motor, two sets of quantities are necessary; measured quantities and calculated quantities. So, objective function of this problem should be developed based on these values. According to Figure 2, T-shape induction motor equivalent circuit which steel losses are not considered equations of objective function is developed.
As it can be seen in Figure 2, five parameters are unknowns that should be estimated that descriptions of these parameters are shown in Table 1. So, one particle of PSO can be as Figure 3. Also, in addition to these parameters that should be calculated and estimated, some quantities that can be measured are shown in Table 2.
Figure 3: a typical particle of PSO
Table 1: descriptions of unknown parameters which should be estimated
Unknown parameters of
induction motor Descriptions
R1 Stator resistance
X1 Stator leakage reactance
R2 Rotor resistance
X2 Rotor leakage reactance
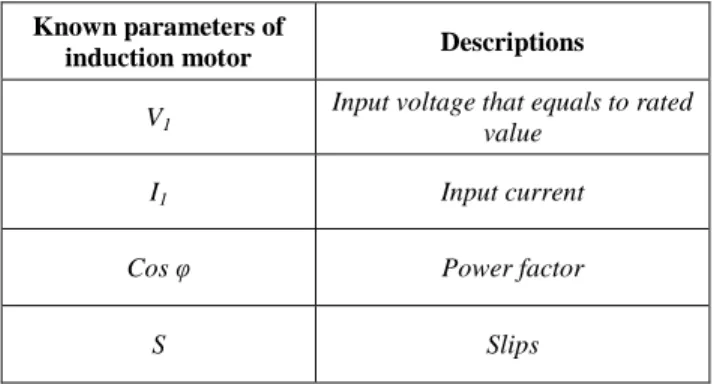
Table 2: descriptions of known parameters which should be measured
Known parameters of
induction motor Descriptions
V1
Input voltage that equals to rated value
I1 Input current
Cos φ Power factor
S Slips
Table 3: set of data used for sensitive analysis
No. Stator current (A) Slip Power factor
1 1.86 0.06 0.62
2 2.39 0.10 0.74
3 3.07 0.15 0.78
Stator current and power factor can be calculated by Equations (7) and (8) which can be derivate from Figure 2.
eq eq
eq
R
jX
V
Z
V
I
. 1 . 1 1 . (7)
eq eqR
X
1tan
cos
cos
(8)Where, Zeq is the equivalent circuit impedance. Also, the equivalent circuit resistance (Req) and reactance (Req) can be computed by Equations (9) and (10), respectively.
Therefore, the objective function can be considered as Equation (11) that is the average error in the power factor and input current for various load points.
22 2 2 2 2 1 m m eq
X
X
S
R
S
R
X
R
R
(9)
22 2 2 2 2 2 2 1 m m m m eq
X
X
S
R
X
X
X
X
X
S
R
X
X
(10) 21 1 ,
, 1 2 1 , ,
1
1
ni mi
i c n
i mi
i c obj
I
I
Cos
Cos
F
(11)Where, I1c,i and Cos φc,i are the values computed by Equations (7) and (8). I1m,i and Cos φm,i are measured or analytical values. Also, the variable n varies from 1 to the number of states. It is worth noting that the sensitivity of the approach is investigated in three states of data presented in Table 3.
Results and Discussion
As mentioned before, to do this estimation problem and choose best method three versions of PSO are used. Also, obtained results are compared to presented results in (Kostov et al., 2009). Proposed method is applied to a three-phase induction motor with the following data: 0.75 KW output power, 380 V phase-to-phase voltage, 50 Hz frequency and 2 poles.
In order to present trusty results, each estimation process is done for 50 times run and average value of obtained results for each parameter is reported. Also the configuration of the PC which simulation is done by it is: 2.53 GHz, Intel ® Core ™2 Duo CPU with 3GB RAM.
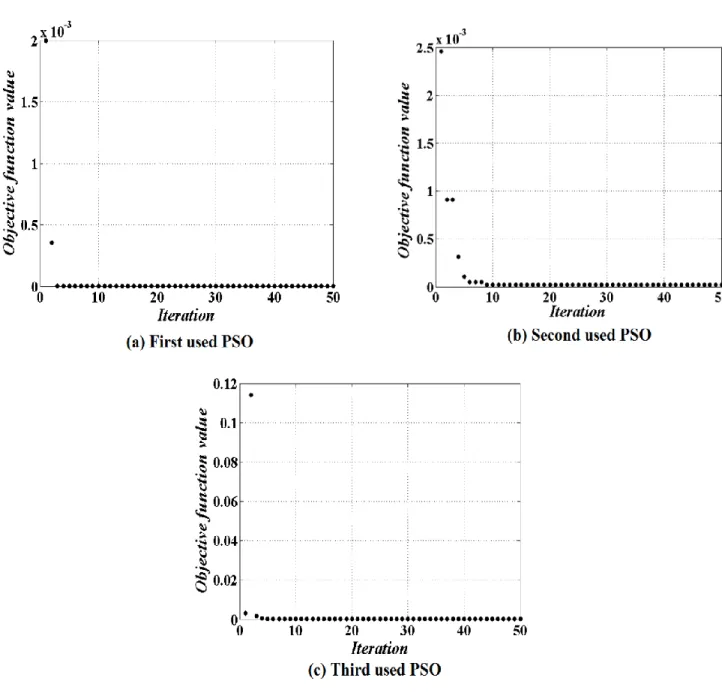
Each optimization process is done for 50 iterations. Table 4 illustrates amount of control parameters for simulation process. Figure 4 shows the typical convergence curve of objective function value for used PSOs. Estimated parameters of induction motor using proposed PSO-based methods as compared to GA-based method are presented in Table 5. In addition, errors of estimated values are calculated as Equation (12).
value - Analytical value
|
| 100
Analytical value
Estimated
Figure 4: Convergence curve of objective function values for three used versions of PSO
Table 4: Control parameters of used PSOs
PSO version K φ wmax wmin α T
Number of
population C1 C2
1st PSO - - 0.9 0.05 - 50 500 2.8 1.2
2nd PSO - - 1 - 10 50 500 2.8 1.2
Table 5: Estimated parameters of induction motor using proposed PSO-based methods as compared to GA-based method
Parameter of induction
motor
Analytical value (Ω)
Proposed method
Estimated, one data set
Estimated, two data sets
Estimated, three data sets Estimated
value (Ω)
Error # (%)
Estimated value (Ω)
Error (%)
Estimated value (Ω)
Error (%)
R
110.20
1
stPSO
10.28
0.78
9.95
2.45
10.17
0.29
2
ndPSO
10.19
0.09
10.02
1.70
10.11
0.88
3
rdPSO
8.9
12.74
9.97
2.25
10.11
0.80
GA
62.56
513.30
10.54
3.30
10.28
0.80
X
18.17
1
stPSO
7.62
6.73
7.33
10.28
8.03
1.71
2
ndPSO
7.53
7.80
7.45
8.80
7.96
2.50
3
rdPSO
7.16
12.36
7.61
6.85
8.18
0.12
GA
43.49
432.30
8.24
0.90
8.19
0.20
R
210.52
1
stPSO
10.53
0.09
10.56
0.38
10.44
0.76
2
ndPSO
10.54
0.19
10.54
0.19
10.45
0.66
3
rdPSO
8.4
20.15
10.52
0
10.42
0.95
GA
11.02
4.80
10.47
0.50
10.48
0.40
X
219.16
1
stPSO
19.13
0.15
18.90
1.35
19.32
0.83
2
ndPSO
18.95
1.09
18.94
1.10
19.26
0.52
3
rdPSO
19.47
1.61
18.51
3.39
19.09
0.36
GA
101.98
432.20
19.32
0.80
19.21
0.30
X
m143.57
1
stPSO
142.95
0.43
143.49
0.05
143.47
0.06
2
ndPSO
143.03
0.37
143.40
0.11
143.53
0.02
3
rdPSO
141.11
1.71
143.11
0.32
143.42
0.10
GA
58.77
59.10
142.73
0.60
143.17
0.30
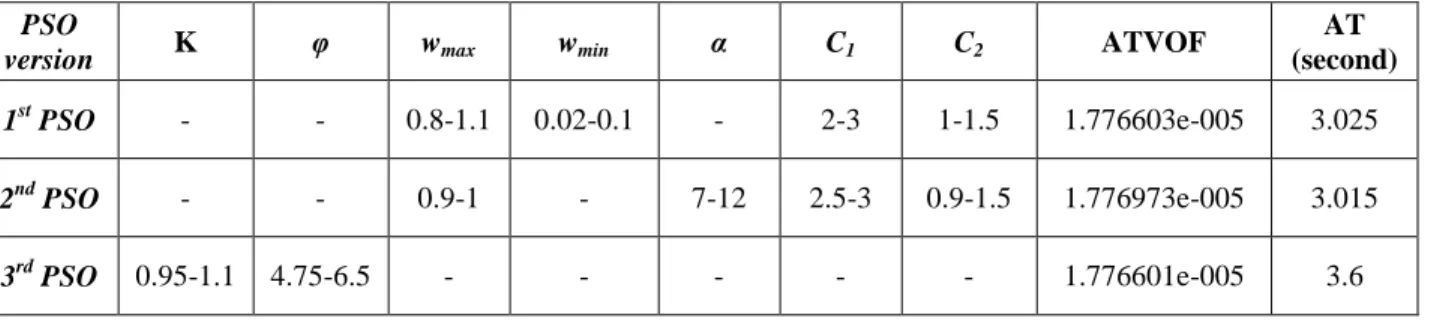
Table 6: Some extra obtained results of this work; optimum range of parameters of used PSO
PSO
version K φ wmax wmin α C1 C2 ATVOF
AT (second)
1st PSO - - 0.8-1.1 0.02-0.1 - 2-3 1-1.5 1.776603e-005 3.025
2nd PSO - - 0.9-1 - 7-12 2.5-3 0.9-1.5 1.776973e-005 3.015
As it can be seen in Table 5, proposed methods can estimate parameters of induction motor by less than 0.2% error. Bold values in Table 5 shows the least error in each part. Additional to these results, some extra results are listed in Table 6; optimum range of control parameters, the average of terminates value of objective function (ATVOF) and average time of simulation (AT) for each estimating process. It is worth noting that although the average of terminates value of objective function is about 1.7e-005 but maximum terminates value of objective function is about 8.5e-005 and minimum terminates value of objective function is about 1.5e-010.
In this paper, three versions of PSO based on their inertia weight have been used for solving our estimation problem. According to estimated values and calculated errors, third PSO estimates the parameters of studied induction motor more accurate, but in other hand, based on average time of simulation second version of PSO do the simulation faster than others. Therefore, we should consider a reasonable tradeoff between time and accuracy of estimation. In this work, because accuracy is more important third version of PSO can be best choice. Although depend on application of parameter estimation process, this tradeoff can be changed. For example, when parameter estimation is used to detect electrical or mechanical faults [26], faster method with acceptable accuracy is needed, but when it is just used to estimate structural parameters in order to manufacturing purpose and optimization design, using more accurate method with acceptable speed is reasonable.
Conclusions
As mentioned before, estimation of important parameters of electrical machines can help engineers to find out essential information about machine. In this paper, three versions of PSO have been proposed to estimate parameters of the equivalent circuit parameters of squirrel cage induction motor. Obtained results show the abilities of proposed methods that can estimate equivalent parameters with less than 0.2% error; also this procedure is done only in less than 4 seconds. So, proposed methods present accuracy along with speed in decision making. These two important factors hope us to use these useful methods in other parameter estimation applications and problems. In addition, it is worth noting that equivalent parameters estimation has been only done by three electrical input data; voltage, current and power factor and slip of the motor.
References
Abdelhadi B., Benoudjit A., Nait Said N., (2004). Identification of Induction Machine Parameters Using an Adaptive Genetic Algorithm. Electric Power Components and Systems. Vol. 32, pp. 767-784.
Bae D., (1997). Determination of Induction Motor Parameters by Using Neural Network Based on FEM Results. IEEE Transactions on Magnetics, Vol. 33, pp. 1924-1927.
Bishop R. R., Richards G. G., (1990). Identifying Induction Machine Parameters Using a Genetic Optimization Algorithm. In Proceedings of IEEE Southeastcon. Vol. 2, pp. 476-479.
Clerc M., Kennedy J., (2002). The Particle Swarm— Explosion, Stability, and Convergence in a Multidimensional Complex Space. IEEE Transactions on Evolutionary Computation, Vol. 6, No. 1, pp. 58-73.
Ertan H. B., Leblebicioglu K., Avenoglu B., Ercan B., (2003). Identification of parameters of an induction motor from field solution. In Proceedings of 6th International Conference on Electrical Machines and Systems, Vol. 1, No. 1, pp. 1-6.
Faiz J., Ebrahimi B. M., (2007). Influence of Magnetic Saturation upon Performance of Induction Motor Using Time Stepping Finite Element Method. Electric Power Components and Systems, Vol. 35, No. 5, pp. 505-524.
Hung R., Dommel H. W., (1996). Synchronous machine models for simulation of induction motor transients. IEEE Transactions on Power Systems, Vol. 11, No. 2, pp. 833-841.
Huang K. S., Kent W., Wu Q. H., Turner D. R., (2001). Parameter Identification for Induction Motors Using Genetic Algorithm with Improved Mathematical Model. Electric Power Components and Systems. Vol. 29, No. 3, pp. 247-258.
Ju P., Handschin E., Wei Z. N., Schluecking U., (1996). Sequential parameter estimation of a simplified induction motor load model. IEEE Transactions on Energy Conversion, Vol. 11, No. 1, pp. 319-324.
Kostov I., Spasov V., Rangelova V., (2009). Application of Genetic Algorithms for Determining the Parameters of Induction Motors. Technical Gazette, Vol. 16, No. 2, pp. 49-53.
Lindenmeyer D., Dommel H. W., Moshref A., Kundur P., (2001). An induction motor parameter estimation method. Electrical Power and Energy Systems, Vol. 23, No. 4, pp. 251-262.
Michael T. W., Ronald G. H., (1995). Identification and Control of Induction Machines Using Artificial Neural Networks. IEEE Transactions on Industry Applications, Vol. 31, No. 3, pp. 612-619.
Moon S. I., Keyhani A., (1994). Estimation of induction machine parameters from standstill time-domain data. IEEE Transactions on Industry Applications, Vol. 30, No. 6, pp. 1609-1615.
Nangsue P., Pillay P., Conry S., (1999). Evolutionary Algorithms for Induction Motor Parameter Determination. IEEE Transactions on Energy Conversion, Vol. 14, No. 3, pp. 447-453.
Orlowska Kowalska T., Lis J., Szabat K., (2006). Identification of the Induction Motor Parameters using Soft Computing Methods. COMPEL, Vol. 25, No. 1, pp. 181-192.
Perez I., Gomez-Gonzalez M., Jurado F., (2012). Estimation of induction motor parameters using shuffled frog-leaping algorithm. Electrical Engineering, Vol. 95, No. 3, pp. 267-275.
Pillay P., Sabur S., Haq M., (1997). A model for induction motor aggregation for power system studies. Electric Power Systems Research, Vol. 42, pp. 225-228.
Rahimpour E., Rashtchi V., Pesaran M., (2007). Parameter Identification of Deep-Bar Induction Motors Using Genetic Algorithm. Electrical Engineering. Vol. 89, pp. 547-552.
Ursem R. K., Vadstrup P., (2003). Parameter Identification of Induction Motors Using Differential Evolution. The Congress on Evolutionary Computation, Vol. 2, pp. 790-796.
Willis J. R., Brock G. J., Edmonds J. S., (1989). Derivation of induction motor models from standstill frequency response tests. IEEE Transactions on Power Energy Conversion, Vol. 4, No. 4, pp. 608-615.
Zahiri S. H., (2010). Swarm Intelligence and Fuzzy Systems, Nova Publisher, USA.
Zaremba A. T., Pavlov A. V., (2002). Real-Time Identification of an Induction Motor using Sinusoidal
PWM Voltage Signals. In the Proceedings of the American Control Conference, pp. 3082-3087.
Zhou P., Gilmore J., Badics Z., Cendes Z. J., (1998). Finite element analysis of induction motors based on computing detailed equivalent circuit parameters. IEEE Transactions on Magnetics. Vol. 34, No. 5, pp. 3499-3502.