© 2016, IRJET | Impact Factor value: 4.45 | ISO 9001:2008 Certified Journal
| Page 679
An Analysis of Tuberculosis Data for Pattern Matching Using Data
Mining Techniques
Ravinder Kaur
1, Anshu sharma
21
M.tech Student, Dept. of CSE, CT Institute of Technology & Research , Jalandhar, India
2Assistant Professor, Dept. of CSE, CT Institute of Technology & Research , Jalandhar, India
---***---Abstract -
With the advancement of time in the datamining we use clustering and classification in TB disease for better results. Generally, data mining is the process of analyzing data from different perspectives and summarizing it into useful information. The objects with similar properties are assigned into one group using clustering. There are several clustering algorithms that can be used for the analysis of tuberculosis data. In this paper, we compared K-means clustering and farthest first clustering algorithm using decision table on tuberculosis data for which farthest first gave better results.
Keywords
:
data mining, classification, clustering, k-meanalgorithm, farthest first algorithm, Manhattan distance, tuberculosis dataset.
1. INTRODUCTION
Tuberculosis is very common disease which is caused by mycobacterium and established as severe disease with fatal effects. TB typically affects the lungs, but it also can affect any other organ of the body. It is usually treated with a regime of drugs taken for six months to two years depending on the type of infection. Sometimes it is very difficult to diagnose it at initial level by physicians because symptoms of TB initial level are similar to any other normal disease. [1] Tuberculosis is spread through the air from one person to another. The TB bacteria are put into the air when a person with TB disease of the lungs or throat coughs, sneezes, speaks, or sings.
The bacteria must enter the body, thereby causing an infection. This usually happens when a person breathes in
mtb-contaminated air, and the inhaled tuberculosis bacteria make their way to the lungs. The immune system cannot stop tuberculosis bacteria from develop and expand after the initial infection. Once a person is infected with TB bacteria, the chance of developing TB disease is higher.
There are so many classification algorithms the researchers have already used. Classification is the process to assign an object into predefined classes by evaluating their membership into class according to attribute values for that objects. For making significant improvement in classification process many researchers have employed different approaches and adopt different learning methods which are better than previous traditional approaches but very few researchers have tried for classification process preceded by clustering approach. [2]
The simplest way of describes the output from machine learning is to put it in the same form as the input. The use of the classifier rules decision table is represent as building and using a simple decision table majority classifier. The output will show a decision on a number of attributes for each instance. It evaluates feature subsets using best-first search and can use cross-validation for calculation.
© 2016, IRJET | Impact Factor value: 4.45 | ISO 9001:2008 Certified Journal
| Page 680
approach which divides dataset into predefined k partition known as clusters which have minimum intra cluster Manhattan distance. Although it is a basic algorithm but it has some shortcomings such as the result of the algorithm mostly depends upon initial value of centroid chosen for each cluster the other drawback is in error function of k-mean where several minima is are possible and can easily fall to local minima. [4][5] So aim of this paper is to give classification and clustering together with certain improvement in k-mean clustering. [3]
The paper is organized in multiple sections where section 2 describes simple k-mean clustering and farthest first clustering algorithms and talks about limitation and advantages of k-mean. Section three describes the sensitivity of k-mean and farthest first algorithms towards centroid selection and proposes a methodology for selection of centroid for clustering of medical data. Section four shows the results and discussion. Section five shows the conclusion and future scope.
2. RELATED WORKS
In the most of the research paper, k-mean algorithm is used for the clustering. In this paper, farthest first algorithm is used for clustering and decision table is used for classification techniques. The clustering is performed the various way and there are so many functions available for measuring the quality of clusters,
(1)
These function called fitness function. A widely-known function which is mostly used is total mean-square quantization error function which is given below:
d (Oi, Oj) = (2)
K-mean clustering uses a Manhattan distance formulas, to
compute the absolute differences between coordinates of pair of objects.
=
Steps of k-mean algorithm: [12]
1. Choose randomly k data objects from given dataset which works as centroid for k clusters initially.
2. Compute distance of each data object from k centroids and then allocate each data object to the closest cluster with minimum centroid distance.
3. Compute new centroid for each cluster by taking mean of the all data objects belonging to particular cluster. Calculate the total mean-square quantization error function. If error function reduces from previous one than these centroids will work as new centroids.
4. Repeat step 2 and 3 until error function get constant.
In this paper, the algorithm is used for the farthest-first clustering algorithm. Farthest-first clustering algorithm is a fast and greedy algorithm. In this algorithm k points are first selected as cluster centers. The first center is select randomly. The second center is greedily select as the point furthest from the first. Each remaining center is determined by greedily selecting the point farthest from the set of already chosen centers, and the last points are added to the cluster whose center is the closest.
Score (Xi) =
Steps of farthest-first algorithm:
1. Farthest first traversal (D: data set, k: integer) {
2. Randomly select first center;
3. //select centers
© 2016, IRJET | Impact Factor value: 4.45 | ISO 9001:2008 Certified Journal
| Page 681
5. for (each remaining point) {calculate distance to current center set; }
6. Select the point with maximum distance as new center ;}
7. //assign remaining points
8. for (each remaining point) {
9. Calculate the distance to each cluster center;
10. put it to the cluster with minimum distance;}}
3. PROPOSED METHODOLOGY
In this study, we first identify the dataset and collect the dataset. The data regarding 1000 patients from 10 major medical centers of Jalandhar city was collected using a well-developed questionaries’ based on different symptoms according to priority. On this basis, 8 symptoms of patients suffering from TB were identified and are given below. Coughing up blood, fatigue, chills, fever, weight loss, chest pain.
3.1. Data Clustering
After collection of dataset, data cluster was performed in which two algorithms we used.
a. K-mean algorithm
K-mean is one of the unsupervised learning algorithms that solve the widely-known clustering problem. The procedure follows a simple and easy way to classify a given data set through a certain number of clusters (assume k clusters) fixed apriori. The main goal is to define k centers, one for each cluster. These centers should be placed in a cunning way because of different location causes different results. [12]
Although k-mean is very simple in nature but it is very sensitive toward centroid selection initially and it can produce different results for different initial centroids. So if accurate clustering is a prime concern then careful selection of centroid is required in k-means. [1]
From the above literature review, the number of cluster used for k-mean clustering is from 2 to 3. But in this paper, the algorithm used in clustering is k-mean clustering using Euclidian distance. Distance can be changed to Manhattan distance with 4 clusters. As well as we can use farthest first algorithm and results can be compared. Then to overcome the problem of hypersensitivity, than farthest first algorithm was used.
b. Farthest first algorithm
Farthest-first clustering algorithm is a fast and greedy algorithm. In this algorithm k points are first selected as cluster centers. The first center is select randomly. The second center is greedily select as the point furthest from the first. Each remaining center is determined by greedily selecting the point farthest from the set of already chosen centers, and the another points are added to the cluster whose center is the closest.
After that to compare the accuracy of k-mean and farthest first algorithm, we use the classification
techniques known as the decision table. Decision table
© 2016, IRJET | Impact Factor value: 4.45 | ISO 9001:2008 Certified Journal
| Page 682
YES
[image:4.595.29.295.69.646.2]NO
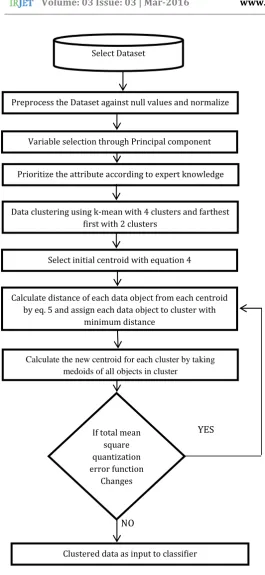
Fig. 1: Proposed Methodology
In this methodology, the first step is to calculate the centroid and after that assign each of the objects in dataset to the partition from whose centroid it is closest. Next step is to calculate total mean-square quantization error function. In this manner new centroid for every partition
has been calculated and all the data objects rearrange according to their distance from new centroids. For each step the error function is required to be calculated. If new centroid provide lower error function value than the new centroid will be kept and movement will be continued in same direction otherwise if value of error function is higher than previous then the movement direction will change. [11][12]
Stopping criteria for movement is the maximum number of iteration allowed or consistency of centroid of clusters. The research work proposes the selection procedure for initial centroid in following manner. First step is to select k initial centroid from dataset and keep the distance centroid as far as possible. We can divide dataset into k equal parts according to the following function in simple way [13]:
(3)
Where Maxi represents maximum value of ith attribute and Mini represents minimum value of ith attribute from whole data objects. K corresponds to number of predefined clusters
While Gi gives the range of partition for ith attributes. Initial centroid will contain all the attribute range and from a variable vector. Medical dataset are differ from other because they are sensitive in nature and some attributes shows more impact than offers in any disease as its symptom. So here we can take advantages of some expert knowledge for deciding that which attribute is most important and which is of less importance and can prioritize them according to significance. To achieve this final centroid is as follows:
(4)
Where i = 1,2,…..k Select Dataset
Preprocess the Dataset against null values and normalize
Variable selection through Principal component selection
Prioritize the attribute according to expert knowledge
Data clustering using k-mean with 4 clusters and farthest first with 2 clusters
Select initial centroid with equation 4
Calculate distance of each data object from each centroid by eq. 5 and assign each data object to cluster with
minimum distance
Calculate the new centroid for each cluster by taking medoids of all objects in cluster
If total mean square quantization error function
Changes
© 2016, IRJET | Impact Factor value: 4.45 | ISO 9001:2008 Certified Journal
| Page 683
Where Pi indicates the priority of ith attribute. Here attribute with higher priority is represented by higher number. Above formula will give final centroid for each attribute and it will form a variable vector for centroid.
The newly proposed Clustering algorithm is applied on the dataset to divide it into three classes and the improvement is achieved by distance calculation between two clusters in a novel way. Here the distance is calculated on the basis of influence, for example more influencing attribute plays more crucial role in finding the distance.
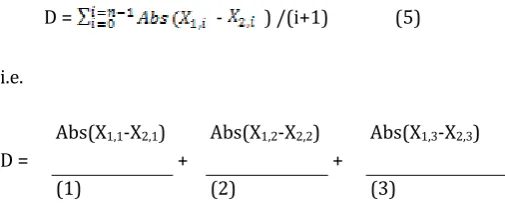
Here the improve distance is based on the Applied Manhattan Distance given by:
D = - ) /(i+1) (5)
i.e.
D =
Abs(X1,1-X2,1) +
Abs(X1,2-X2,2) +
Abs(X1,3-X2,3)
(1) (2) (3)
Where ( ) and ( ) are two patient records where (i =1,
2……n) denotes attributes (in this case n=8). Since first attribute is having more effect on disease as per expert advice, which is glucose level. In distance formula it is promote more weight than other attribute. For example ( - )/1 is having more impact and ( - )/2 is
having comparatively less impact and so on.
The calculation of weights is done by making all other attributes constant and examines only one attribute at a time to calculate its effect in formation of a particular class of disease.
4. RESULT AND DISCUSSION
From the Table 1, it can be inferred that while comparing the k-mean algorithm and farthest first algorithm, Shukla and Aggarwal (2014) used the k-mean algorithm, however this is very sensitive towards centroid selection. So, farthest first was used to data classification. Correctly
classification instances were higher in farthest first (90.9%) than k-mean (86.90%). Similarly the average magnitude of error measure by mean absolute error (MAE) was higher in k-mean (0.217) as compared to farthest first. The accuracy of farthest first measure was again calculated while using the formula of root mean square error (RMSE), while inferred that RMSE of (.265) as compared to k-mean (.2771).
From the above discussion it can be concluded that farthest first method is accurate and measure in data classification. Next step is to preprocess data against null values followed by normalization and prioritize dataset attribute according to expert knowledge. [17]
[image:5.595.36.289.339.447.2]From the above discussion, the below two figures depicts the efficiency of the k-mean and farthest first algorithm and the result depicted in the table 1.
Table 1:
Comparison of results by k mean and
farthest first method
Particulars K-mean
cluster 4
Farthest first cluster 2
Correctly classified instances 86.90% 90.90%
Incorrectly classified instances
13.10% 9.10%
Mean absolute error 0.2178 0.183
Root mean squared error 0.2771 0.265
Relative absolute error 61.79% 40.01%
Root relative squared error 66.025 55.41%
© 2016, IRJET | Impact Factor value: 4.45 | ISO 9001:2008 Certified Journal
| Page 684
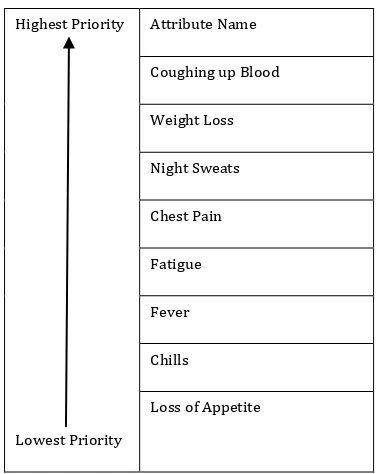
attribute with higher priority whereas loss of appetite can be considered as an attribute with lowest priority.
Fig. 2:
Results of k-mean clustering algorithm
[image:6.595.351.543.120.357.2]Fig. 3
: Results of farthest first clustering algorithm
Table 2:
Attribute arranged according to priority
Highest Priority
Lowest Priority
Attribute Name
Coughing up Blood
Weight Loss
Night Sweats
Chest Pain
Fatigue
Fever
Chills
Loss of Appetite
5. CONCLUSION AND FUTURE SCOPE
In the present study, the alternate way of classification is presented with the help of two different clustering techniques which were tested against tuberculosis dataset and helps in showing significant improvement in classification techniques in the field of tuberculosis. Two different clustering techniques k-mean and farthest first were used. In the present study and the accuracy was compared for these two techniques. From the study it can be concluded that farthest first algorithm of clustering using 2 clusters resulted in more accuracy, lower error, less time as compared to k-mean algorithm using 4 clusters. So, the future study the farthest first algorithm should be tested for the prediction of other diseases apart from tuberculosis in the field of medical.
References
[1] T. Asha, S. Natarajan, and K. N. B. Murthy, “Data Mining Techniques in the Diagnosis of Tuberculosis,” Understanding Tuberculosis - Global Experiences and Innovative Approaches to the Diagnosis, 2012.
© 2016, IRJET | Impact Factor value: 4.45 | ISO 9001:2008 Certified Journal
| Page 685
based on data mining,” Applied Soft Computing, vol. 11, no. 8, pp.5006-5014, 2011.
[3] T. Divya, and A. Sonali, “A survey on Data Mining approaches for Healthcare”, International Journal of Bio-Science and Bio-Technology, vol. 5, no. 5, pp. 241-266, 2013.
[4] M. Sakthi, and Dr. Antony Selvadoss Thanamani, “An Effective Determination of Initial Centroids in K-Means Clustering Using Kernel PCA,” International Journal of Computer Science and Information Technologies, vol. 2, no. 3, pp. 955-959, 2011.
[5] K.S. Al-Sultan, “A Tabu Search Approach to the Clustering Problem,” Pattern Recognition, vol.28, no.9, pp. 1443-1451, 1995.
[6] R.V. Singh, and M. P S “Bhatia, "Data clustering with modified K-means algorithm,” International Conference on Recent Trends in Information Technology (ICRTIT), 2011, pp.717-721.
[7] J. Han, and M. Kamber, Data mining: concepts and techniques. 2nd ed. The Morgan Kaufmann Series, 2006.
[8] Shailendra Singh Raghuwanshi, and Prem Narayan Arya, “Comparison of K-means and Modified K-mean algorithms for Large Data-set,”
International Journal of Computing, Communications and Networ,vol. 1, no.3, 2012.
[9] K. A. Yadav, D. Tomar, and S. Agarwal, “Clustering of Lung Cancer Data Using Foggy K-Means,” Accepted in Third International Conference On Recent Trends In Information Technology (ICRTIT-2013). In Press.
[10]Chin-Yuan Fan, Pei-Chann Chang, Jyun-Jie Lin, and J.C. Hsieh, “A hybrid model combining case-based reasoning and fuzzy decision tree for medical data classification,” Applied Soft Computing, vol. 11, no. 1, pp. 632-644, January 2011,.
[11]A. K. Jain, “Data Clustering: 50 Years Beyond K-Means,” Pattern Recognition Letters, vol. 31, no. 8, pp. 651-666, 2010.
[12]Pei-Chann Chang, Chin-Yuan Fan, and Wei-Yuan Dzan, “A CBR-based fuzzy decision tree approach for database classification, Expert Systems with Applications,” vol. 37, no. 1, pp. 214-225, January 2010. [13]Abdolreza Hatamlou, “In search of optimal centroids on data clustering using a binary search algorithm,” Pattern Recogn. Lett., vol. 33, no. 13, pp. 1756-1760, October 2012.
[14]Abdolreza Hatamlou, “Black hole: A new heuristic optimization approach for data clustering,” Inf. Sci., vol. 222, pp. 175-184, February 2013.
[15]S. Khanna, and S. Agarwal, “An Integrated Approach towards the prediction of Likelihood of Diabetes,” Accepted in International
conference on Machine Intelligence Research and Advancement (ICMIRA-2013). In Press.
[16]M. Shouman, T. Turner, and R. Stocker, “Integrating Decision Tree and K-Means Clustering with Different Initial Centroid Selection Methods in the Diagnosis of Heart Disease Patients,” Proceedings of the 2012. International al Conference on Data Mining, CSREA Press, Las Vegas Nevada, USA, 2012, pp. 24-30.
[17]Panzarasa, S., et al., “Data mining techniques for analyzing stroke care processes,” Proceedings of the 13th World Congress on Medical Informatics, 2010.
[18]K. Srinivas, B.K. Rani, and A. Govrdhan, “Applications of Data Mining Techniques in Healthcare and Prediction of Heart Attacks,” International Journal on Computer Science and Engineering (IJCSE), vol. 02, no. 02: pp. 250-255, 2010
[19]Murthy, C.A., Chowdhury, N., “In search of optimal clusters using genetic algorithms,” Pattern Recognition Letter, vol. 17, pp. 825– 832,1996.
[20] Niknam, T., Amiri, B., “An efficient hybrid approach based on PSO, ACO and k-means for cluster analysis,” Applied Soft Computer, vol.10, pp. 183–197, 2010.
[21]Selim, S.Z., Alsultan, K., “A simulated annealing algorithm for the clustering problem,” Pattern Recognition, vol. 24, pp. 1003–1008 1991.
[22]Selim, S.Z., Ismail, M.A., “K-means-type algorithms: a generalized convergence theorem and characterization of local optimality” IEEE Transactions on Pattern Analysis and Machine Intelligence, vol. 6, pp. 81–87 1984.
[23]Shelokar, P.S., Jayaraman, V.K., Kulkarni, B.D., “An ant colony approach for clustering,” Anal. Chim. Acta, vol. 509, pp. 187–195, 2004.
[24]Son, Y.S., Baek, J., “A modified correlation coefficient based similarity measure for clustering time-course gene expression data,” Pattern Recognition Letter, vol. 29, pp. 232–242, 2008.
[25]Sung, C.S., Jin, H.W., “A tabu-search-based heuristic for clustering,” Pattern Recognition, vol. 33, pp. 849–858, 2000.
[26]Barbakh, W., Wu, Y., Fyfe, C., “Review of Clustering Algorithms,” Non-Standard Parameter Adaptation for Exploratory Data Analysis. Springer, Berlin/ Heidelberg, pp. 7–28, 2009.
[27]Blake, C.L., Merz, C.J., “ UCI repository of machine learning databases," Availablefrom:<http://www.ics.uci.edu/-mlearn/MLRepository.html>.