Making Large-Scale Systems Observable — Another
Inescapable Step Towards Exascale
Dmitry A. Nikitenko1, Sergey A. Zhumatiy1, Pavel A. Shvets1
c
The Authors 2017. This paper is published with open access at SuperFri.org
The effective mastering of extremely parallel HPC system is impossible without deep under-standing of all internal processes and behavior of the whole diversity of the components: computing processors and nodes, memory usage, interconnect, storage, whole software stack, cooling and so forth in detail. There are numerous visualization tools that provide information on certain compo-nents and system as a whole, but most of them have severe issues that limit appliance in real life, thus becoming inacceptable for the future system scales. Predefined monitoring systems and data sources, lack of dynamic on-the-fly reconfiguration, inflexible visualization and screening options are among the most popular issues. The proposed approach to monitoring data processing resolves the majority of known problems, providing a scalable and flexible solution based on any available monitoring systems and other data sources. The approach implementation is successfully used in every-day practice of the largest in Russia supercomputer center of Moscow State University.
Keywords: scalable monitoring visualization, situational screen, supercomputer state visual-ization, joint monitoring sources, supercomputer dashboard, HPC instrument control board.
Introduction
The effective mastering of large-scale supercomputer systems which includes many aspects of management and administering, is impossible without deep understanding of peculiarities of system behavior on all levels. Most of existing techniques and tools require extensive tuning to fit even present system scales and tasks. Taking steps towards Exascale predetermines the strong need for effective highly-scalable and flexible techniques and algorithms that support simultaneous use of a number of data sources with diverse output formats with a dynamical reconfiguration feature as well as means for visualization of obtained data in user-defined com-binations and a variety of screening cases and templates, including implementation for mobile devices. At present numerous monitoring systems and visualization tools are available. Most of them were developed for a certain purpose such as network monitoring, without taking into the account extreme parallelism of observed objects and strict scalability requirements.
Zabbix is a system designed to monitoring network services and applications [1] with compre-hensive facilities for visualization of observed object state and history of changes. The developers declare support for 10 000+ observed objects and more, but with a consequent reduced monitor-ing rate to once per several minutes for every attribute, that is hardly acceptable even for present scales of supercomputers, say nothing of Exascale. Moreover there are issues with simultaneous visualization of multiple characteristics and lack of HPC-specific component support “out of the box”, such as resource managers support, queuing systems, etc. Some of the issues cannot be fixed by system Zabbix design.
Nagios is another monitoring system [2] for network services. The system provides a wider support for different modules due to log evaluation history. Basic Nagios has very poor tools for visualization, which is why external tools are used. These tools are usually designed to meet certain requirements, and they are rarely flexibly configurable. Moreover, the declared scalability is even worse than thousands of objects. There is Nagios-based commercial software with mature
visualization facilities and some HPC-relevant modules, but stillit is as limited in scalability as the original version.
Moreover, there are many other monitoring systems and data collectors with different vi-sualization facilities: Ganglia, Collectd, Cacti, OpenNMS, Munin, Monit, NetXMS, etc. All of them have demerits in flexibility of visualization configuration and difficulties in introducing new data sources.
Among others one should noticeOpen Lorenz byLawrence Livermore National Laboratory. This tool allows every user designing his own web-page with the information on the latest and forthcoming events, job queue state, overall system load rate and some other information. Every data type is available in separate portlet visual element. As for now, custom configuration of portlet combination and positions is available. The number of available characteristics is rather small and the majority of those available do not suit most other supercomputers, fitting the specific certain HPC center workflow. It is very promising that the project is open source and one can expect further development in functionality extension, introducing new portlets, but there have been not many changes during the last 1,5 years [3, 4].
Another interesting project has been developed by National Center for Supercomputing Applications, University of Illinois. It is aimed at visualization data on certain jobs behavior screening characteristics of network usage, CPU utilization, etc. and is oriented to users, lacking valuable information on infrastructure or queuing that is important for system administrators. Unfortunately, the project is not publicly available [5]. As we see, the need for efficient HPC dashboard exists and there are same attempts to develop such tools. At present, most approaches lack flexibility, portability and have poor support for diverse data sources and visualization schemes, not to mention critical scalability issues.
1. Design Principles
In our approach we put emphasis on the development of portable, configurable and scalable algorithms and principles aimed to provide flexible all-round methods of control over supercom-puter complex of any scale. The analysis of many-year experience of running and supporting large HPC systems provided us same basic principles that the development has to follow.
1. It is imperative to permanently keep track on all components that influence efficiency of large-scale system output. It is totally wrong to control only compute nodes, real life imposes much more complicated set of observed objects:
• Computing hardware: nodes, CPUs, memory stack, disks and storage hierarchy, net-works, etc.
• Infrastructure hardware: this part of hardware is rarely paid enough attention, but it is much more fault-tolerance critical, than compute hardware. It includes cooling system: chillers, heat exchangers, air conditioners; piping, pumps; a set of components of the power system in conjunction with an uninterruptible power supply; fire safety systems and smoke removal; access control.
• Whole software stack: OS parameters, package and license usage rates and limitations, etc.
• Dynamics and resource utilization of all user applications.
• Users. At one hand, all HPC systems are designed for users, and on the other job queue structure, application peculiarities and as a total an output of supercomputer is determined by user activity.
2. Support extreme levels of parallelism. One of the distinctive features of the modern computer world is a rapidly growing degree of parallelism in all elements of architecture. Even today, the number of processor cores in the largest system is more than 3 million. Many other options like networks interfaces are in a close range too. These levels must be supported as a starting point, keeping in mind forthcoming Exascale concurrency levels that are expected to be at least thousands times higher. It is related both to scalable algorithms for data analysis that comes from a huge number of objects, and to the means of visualization.
3. Minimal induced overhead.Auxiliary tools must not be integrated deeply into a system and must not be able to influence its functionality. Hence, it is best not to be integrated with monitoring system and data collector agents on compute nodes.
4. The general and the particular points of view. At one hand system must provide summary statistics for the whole machines in a space-effective (on a single display) manner, and on the other providing detailed reports on any and every component just in a few clicks, including support of wide range of display types: wide display panels, notebook and desktop displays, tablets and other mobile devices.
5. Flexible configuration of data sources.It means easy introduction of new data collector of any output format supporting most popular data types and protocols (http, json, csv, etc.), but not limited to any set of those.
2. Implementation
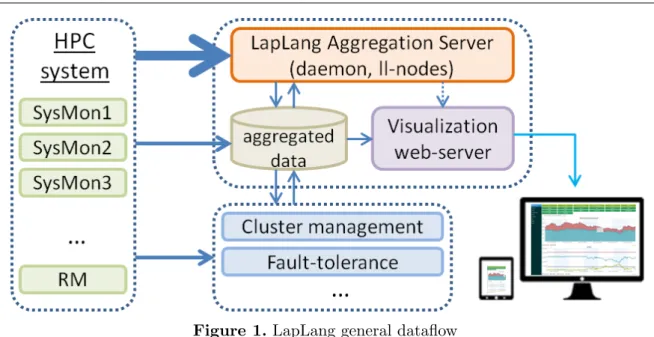
A variety of monitoring systems and data collectors can serve as data source. The developed system of data acquisition runs over HTTP request via PUT methods. The data is submitted in json or csv format. Thus, the data transmission can be performed even by a simple script with a common curl or wget. Most monitoring systems support exporting data via HTTP in json format. If not, an external program (or perl, ruby, python, etc. script) is used to export data, which allows using HTTP and json. At present, we use information that is acquired from: Collectd monitoring system, epilogue scripts of SLURM resource manager, Octoshell cluster management system [6], Octotron fault-tolerance system [7]. General dataflow is shown in fig. 1. Incorporation of a new data source is implemented easily, but the one thing we should be aware of is the data size. Large-scale systems already include ∼ 104 of nodes, so saving and processing of the raw data from numerous per-node sensors with high granularity can hang the system. This scalability issue can be resolved with on-the-fly filtering and aggregation. As a rule, real raw data is not too important for visualization and must correspond to the resolution limitations or analysis purposes. After aggregation and filtering, the data size is reduced significantly and can easily be stored for reference and post-processing.
Figure 1. LapLang general dataflow
can be passed from one ll-node to another, generating command pipes. It is allowed to pass data from one ll-node to several, all data flows can be filtered.
Every ll-node processes data portions one by one in FIFO order. Besides the data, ll-node can send and receive commands: to create a new ll-node joining with parent ll-node, to delete specified ll-node with all its links; set filter on the link of two ll-nodes; delete filter from the two ll-nodes link; create link between two specified ll-nodes; delete link between two ll-nodes, get information on all ll-nodes, links and filters (executed only by a head ll-node), finish service (executed by the head ll-node), sent signal “end-of-data” instead of “data”.
At the current stage of implementation, the following ll-nodes functionality is available: avg, min, max, file (csv read), http csv (csv http read), exec (reads program output), outcsv (writes csv to file), slice (sends end-of-data periodically or by condition), agr/grid (aggregation types), sort, join, db save.
Figure 2. LapLang command pipe aggregating and calculating averages
An example of command pipe that gets min, max and avg for some dynamical characteristic of a job is illustrated in fig. 2. The master “head” ll-node performs no processing, “h” ll-node obtains data from monitoring system and passes it to three children — job avg 778899,
job min 778899, andjob max 778899. Only filtered data is passed (bold arrows shown on figure represent filtering by set of ll-nodes). Every filter performs own aggregation by a specified field of data. Later, all three aggregators pass data tojob join 778899 ll-node, that joins tuples in a new tuple, containing min, max, and avg for a period of time. Next, job 778899 ll-node saves data to the database. When job finishes, ll-nodes job avg 778899, job min 778899, job max 778899,
job join 778899 and job 778899 are killed after processing the last portions of data.
diverse hardware from mobile phones to widescreen panels just with a difference in templates and preferences. Authorization and authentication allows granting access in different scenarios for various user groups and use cases.
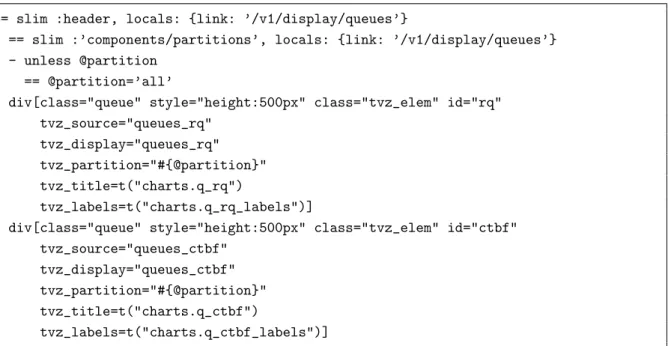
Web-page design does not require experience in web-programming and even HTML knowl-edge. Most portlets are already prearranged, so one just has to add a few lines of slim code into a template. As an example, the following code is used to display a set of available queues as controls, queue load graph and average number of CPU (cores) utilization. The resulting template is shown in fig. 3.
== slim :header, locals: {link: ’/v1/display/queues’}
== slim :’components/partitions’, locals: {link: ’/v1/display/queues’} - unless @partition
== @partition=’all’
div[class="queue" style="height:500px" class="tvz_elem" id="rq" tvz_source="queues_rq"
tvz_display="queues_rq" tvz_partition="#{@partition}" tvz_title=t("charts.q_rq")
tvz_labels=t("charts.q_rq_labels")]
div[class="queue" style="height:500px" class="tvz_elem" id="ctbf" tvz_source="queues_ctbf"
tvz_display="queues_ctbf" tvz_partition="#{@partition}" tvz_title=t("charts.q_ctbf")
tvz_labels=t("charts.q_ctbf_labels")]
An example of slim-based code to display a set of available queues as controls, queue load graph and average number of CPU (cores) utilization
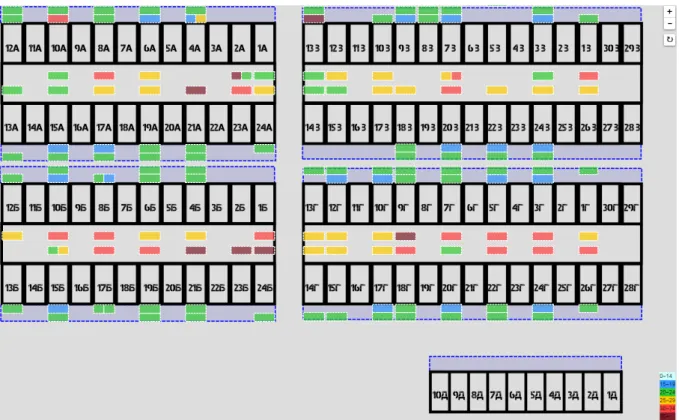
The next example illustrates the temprature distribution according to the formal model of the HPC system that includes information on aisles and infrastructure racks location, see fig. 4. Temperature sensors are mapped to the racks. There can be a total of four sensors located on each rack: two upper-mounted and two bottom-mounted. The racks with no sensors are actually racks with compute nodes.
Figure 4. “Lomonosov” system visualization sample: aisles temperatures
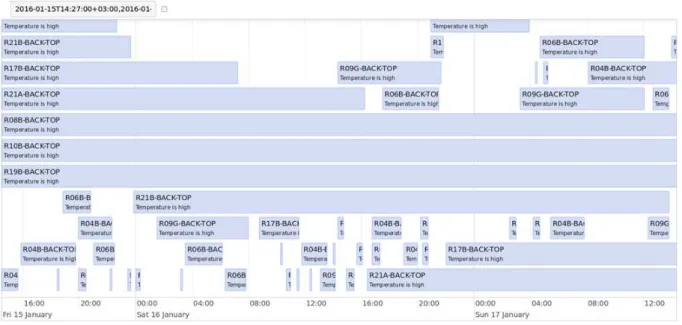
The example shown in fig. 5 illustrates the timeline of warning and errors, revealed by OctoTron resilience system.
The developed system also provides data on user activity. As a result of integration with user management system administrator can get in a few clicks user, project or organization details as well as detailed information on any job, including means to reveal categories of user job runs by resource utilization and many other factors.
Conclusions
Figure 5. “Lomonosov” system visualization sample: warnings and failures timeline
The work is partially funded by the Russian Foundation for Basic Research, grants 13-07-12206, 2016-07-01199 and by the Ministry of Education and Science of the Russian Federation, Agreement No. 14.607.21.0006 (unique identifier RFMEFI60714X0006).
This paper is distributed under the terms of the Creative Commons Attribution-Non Com-mercial 3.0 License which permits non-comCom-mercial use, reproduction and distribution of the work without further permission provided the original work is properly cited.
References
1. Zabbix — The Enterprise-class Monitoring Solution for Everyone, http://www.zabbix.com
2. Nagios — The Industry Standard in IT Infrastructure Monitoring, http://www.nagios.org
3. Long J.W. Lorenz: Using the Web to Make HPC Easier. 2013. 15.
4. OpenLorenz — Web-Based HPC Dashboard and More, https://github.com/hpc/OpenLorenz
5. Showerman M. Real Time Visualization of Monitoring Data for Large Scale HPC Systems // 2015 IEEE International Conference on Cluster Computing. IEEE, 2015. Pp. 706-709.
6. Dmitry Nikitenko, Vladimir Voevodin, and Sergey Zhumatiy. Octoshell: Large Supercom-puter Complex Administration System // Russian Supercomputing Days International Con-ference, Moscow, Russian Federation, 28-29 September, 2015, Proceedings. CEUR Workshop Proceedings, 2015. Vol. 1482. pp. 69-83.
Krakow, Poland, September 6-9, 2015. Revised Selected Papers, Part I (2016), vol. 9573 of LECTURE NOTES IN COMPUTER SCIENCE, Springer International Publishing, pp. 12-22.
8. Vladimir Voevodin, Anadrey Adinets, Pyotr Bryzgalov, Vadim Voevodin, Sergey Zhumatiy, Dmitry Nikitenko, and Konstantin Stefanov. Job Digest - approach to analysis of application dynamic characteristics on supercomputer systems. Numerical Methods and Programming. 2012. Vol. 13. pp. 160-166.