15
MODIFICATION OF FLOW STRUCTURE OVER A VAN MODEL BY
SUCTION FLOW CONTROL TO REDUCE AERODYNAMICS DRAG
Harinaldi
*), Budiarso, Warjito, Engkos Achmad Kosasih, Rustan Tarakka,
Sabar Pangihutan Simanungkalit, and I Gusti Made Fredy Lay Teryanto
Department of Mechanical Engineering, Faculty of Engineering, Universitas Indonesia, Depok 16424, Indonesia
*)E-mail: [email protected]
Abstract
Automobile aerodynamic studies are typically undertaken to improve safety and increase fuel efficiency as well as to find new innovation in automobile technology to deal with the problem of energy crisis and global warming. Some car companies have the objective to develop control solutions that enable to reduce the aerodynamic drag of vehicle and significant modification progress is still possible by reducing the mass, rolling friction or aerodynamic drag. Some flow control method provides the possibility to modify the flow separation to reduce the development of the swirling structures around the vehicle. In this study, a family van is modeled with a modified form of Ahmed's body by changing the orientation of the flow from its original form (modified/reversed Ahmed body). This model is equipped with a suction on the rear side to comprehensively examine the pressure field modifications that occur. The investigation combines computational and experimental work. Computational approach used a commercial software with standard k-epsilon flow turbulence model, and the objectives was to determine the characteristics of the flow field and aerodynamic drag reduction that occurred in the test model. Experimental approach used load cell in order to validate the aerodynamic drag reduction obtained by computational approach.The results show that the application of a suction in the rear part of the van model give the effect of reducing the wake and the vortex formation. Futhermore, aerodynamic drag reduction close to 13.86% for the computational approach and 16.32% for the experimental have been obtained.
Abstrak
Modifikasi Struktur Aliran pada Model Kendaraan Van dengan Kontrol Aliran Hisapan untuk Mengurangi
Hambatan Aerodinamika. Studi aerodinamika kendaraan biasanya berkaitan dengan keselamatan dan peningkatan
efisiensi bahan bakar serta penemuan inovasi baru dalam teknologi kendaraan untuk mengatasi masalah krisis energi dan pemanasan global. Beberapa perusahaan mobil memiliki tujuan untuk mengembangkan solusi kontrol yang memungkinkan pengurangan hambatan aerodinamika kendaraan seiring dengan kemajuan modifikasi kendaraan yang masih dapat dilakukan dengan cara mengurangi massa, rolling friction atau hambatan aerodinamika. Beberapa metode kontrol aliran memberikan kemungkinan dalam memodifikasi pemisahan aliran untuk mengurangi terbentuknya
swirling structure di sekitar kendaraan. Dalam studi ini, sebuah kendaraan keluarga dimodelkan dengan memodifikasi
Ahmed body dengan mengubah orientasi aliran dari bentuk aslinya (modifikasi Ahmed body/reversed Ahmed body). Model ini dilengkapi dengan hisapan pada sisi belakang untuk memeriksa secara komprehensif perubahan medan tekanan yang terjadi. Penelitian dilakukan dengan pendekatan komputasi dan eksperimental. Pendekatan komputasi menggunakan perangkat lunak komersial dengan model turbulensi aliran k-epsilon standar dan bertujuan untuk mengetahui karakteristik medan aliran dan pengurangan hambatan aerodinamika yang terjadi pada model uji. Pendekatan eksperimental menggunakan load cell untuk memvalidasi pengurangan hambatan aerodinamika yang diperoleh dengan menggunakan pendekatan komputasi. Hasil penelitian menunjukkan bahwa penerapan hisapan di bagian belakang model kendaraan van memberikan efek pengurangan olakan dan pembentukan vortex. Selanjutnya, pengurangan hambatan aerodinamika yang diperoleh dengan pendekatan komputasi sebesar dengan 13,86% dan pendekatan eksperimen sebesar 16,32%.
1.
Introduction
Automobile aerodynamic is the study of air flow characteristic around and through a vehicle during motion. These studies are typically undertaken to improve safety and increase fuel efficiency [1-2] as well as to find new innovation in automobile technology to answer the problem of energy crisis and global warming. Modification of automobile technology is one of solution that can be applied to transform and achieve sustainable energy and the preservation of nature. Some car companies have the objective to develop control solutions that enable to reduce the aerodynamic drag of vehicle and significant modification progress is still possible by reducing the mass, rolling friction or aerodynamic drag. It provides the possibility to modify the flow separation to reduce the development of the swirling structures around the vehicle using active or passive control. A number of approaches are available to assist the engineer in developing improved designs, including numerical simulation, laboratory (wind tunnel) methods, and field tests.
The Ahmed vehicle model is a very simplified bluff-body which is frequently employed as a benchmark in vehicle aerodynamics. It has been used in several experiments [3-7] and numerical studies [8-13]. In another computational study, a passenger van is modeled with a modified form of Ahmed's body by changing the orientation of the flow from its original form (modified/reversed Ahmed Body). This model is equipped with suction and blowing on the rear side to comprehensively examine the pressure field modifications that occur in order to modify the near wall flow toward reducing of aerodynamics drag and stated that the application of active control by suction can reduce the aerodynamic drag of reversed Ahmed body up to 15.38% [14].
Meanwhile, Bruneau et al. [15], conducted a study by combining active and passive control techniques to reduce the drag coefficient on the rear side of the square back Ahmed body model, where a drag reduction up to 30% was obtained. Kourta and Gilliéron [16], also conducted a research on the application of active flow control on the vehicle. They obtained 30% drag reduction and reduced the fuel consumption on an average up to 2.4 liter per-100 km on the highway at a speed of 130 km/h and also the reduction of gas emissions at least 12 grams/km. Therefore, the previous results constitutes an interesting prospect of suction active control to suppress the rear window separation and to decrease the aerodynamic drag as well as replacement the passive systems which become insufficient to fullfill the needs.
In this study, a family van is modeled with a modified form of Ahmed's body by changing the orientation of
the flow from its original form (modified/reversed Ahmed Body). This model is equipped with a suction on the rear side to comprehensively examine the pressure field modifications that occur. The investigation combines computational and experimental work.
2.
Methods
Computational Approach. Computational work was
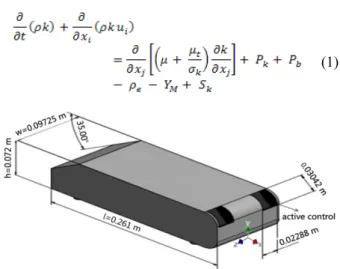
conducted to simulate the flow conditions around the models. This was carried out to develop an appropriate prediction tools to assist the determination of influencing parameters to be used in the experimental works. Fig. 1 shows the van model used in this investigation. The van geometry of the type of a reversed Ahmed body used in the investigation has the geometries ratio to the original Ahmed body model about 0.25. Therefore, the test model has dimensions of length (l) = 0.261 m, width (w) = 0.09725 m, and height (h) = 0072 m with front slant angle (φ) = 35o.
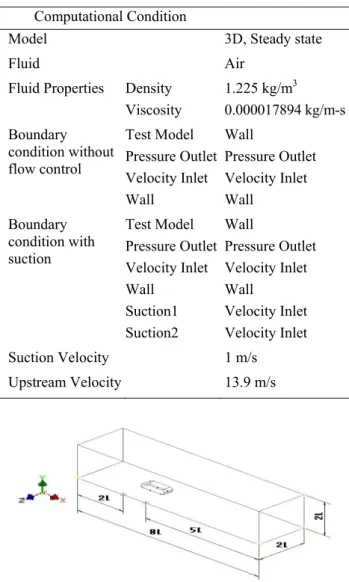
The 3D computational domain is depicted in Fig. 2, which has dimensions of length (L) = 8l, width (W) = 2l, and height (H) = 2l (l = length of model in x-axis). Meshing type was tetra/hybrid element with hex core type and the grid number was more than 1.7 million in order to ensure detail discretization and more accurate calculation results. The boundary condition was inlet velocity of 13.9 m/s. Mean free stream at far upstream region was assumed in a steady state condition and uniform. The suction velocity is set 1 m/s. Reynolds number corresponding with the length of the test model was Re = 2.48 x 10⁵. Details of computational conditions are given in Table 1.
The governing equations were solved numerically by finite volume approach using a commercial solver Fluent 6.3 [17]. The turbulence model used in the computation was a standard k-epsilon model showed in Eq. (1) and (2)
(1)
(2)
where:C1ε=1.44, C2ε=1.92, Cμ=0.09, Sk =1.0, Sε=1.3.
The amount of viscous drag force and pressure drag force Fd, can be written in equations as follows:
∫
∫
+= w dS p dS
d
F
τ
sinθ
cosθ
(3)Cd is drag coefficient which expressed as:
S dS Cp
dS S
V w
d
C =
∫
+∫
∞
θ
θ
ρ
τ
cossin
2 1 2
(4)
Table 1. Computational Condition
Computational Condition
Model 3D, Steady state
Fluid Air
Density 1.225 kg/m3
Fluid Properties
Viscosity 0.000017894 kg/m-s Test Model Wall
Pressure Outlet Pressure Outlet Velocity Inlet Velocity Inlet Boundary
condition without flow control
Wall Wall Test Model Wall
Pressure Outlet Pressure Outlet Velocity Inlet Velocity Inlet Wall Wall Suction1 Velocity Inlet Boundary
condition with suction
Suction2 Velocity Inlet
Suction Velocity 1 m/s
Upstream Velocity 13.9 m/s
Figure 2. Computational Flow Domain
Where, τw = μ(du/dy)w is the wall shear stress evaluated
from the velocity gradient at the wall and Cp = (p-p∞)/(ρV∞2/2) is pressure coefficient evaluated from
pressure distribution at the wall.
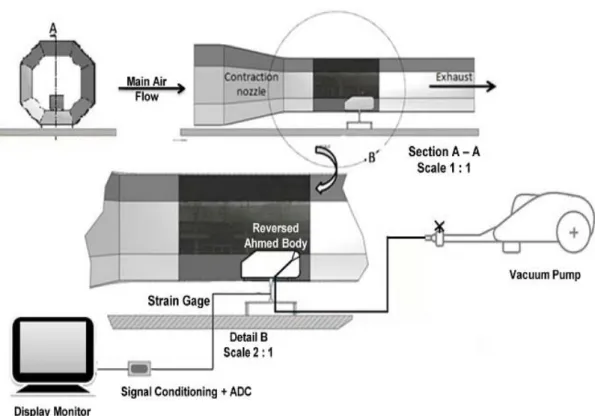
Experimental. The tests of experimental model were
carried out in a controlled low speed wind tunnel. The investigation used van model made of acrylic material with a 0.25 scale to the original Ahmed body model. The van model consisted of two test models i.e model without flow control and model withactive flow control by suction. The suction is placed inside the body of the model at the region where the flow separation is predicted to cause a significant drag based on the computational results. The suction was done by using vacuum pump. The suction velocity is set at 1 m/s. Both models were placed in a low speed wind tunnel test section with free stream air flow. The low speed wind tunnel has length 260 cm and feeder diameter 55 cm. The wind tunnels flow was driven by an axial blower powered by a 1.5 kW DC motor with 2800 rpm of speed. The low speed wind tunnel has a diffuser to produce uniform flow at the test section. The maximum air velocity that can be achieved in the test section is 70 km/h or 19.44 m/s.
The turbulence intensity and flow velocity in the test section of the wind tunnel was measured in advanced for ensuring a steady state flow condition using a hot wire anemometry system. The average turbulence intensity obtained on the test section at free-stream velocity 16.7 m/s is about 0.55% which is sufficient to consider that the test section has a steady flow condition at free stream velocity. Parameters to be studied was the aerodynamic drag force which was measured by using a load cell (Fig. 3). Aerodynamic drag force measurement scheme is shown in Fig. 4.
Load cells used in the experimental approach consisted of strain gauges and signal conditioning. Strain gauge type was foil strain gauge (SHOWA Measuring Instruments Co., Ltd./N11-FA-5-350-11), and had gauge length 5 mm and thermal output of ±2 µɛ/°C. To read the output voltage of the strain gauge a signal conditioning equipment (Excellent Scale/XK3190-A12) was used. This signal conditioning system had sample rate of 10 times/second and load cell sensitivity of 1.5-3 mV/V.
Figure 4. Scheme of Aerodynamic Drag Force Measurement
Prior to the main experiments, the load cell was calibrated using a digital balance and a prelimary measurement was conducted to determine the statistical uncertainty of force measurement. It was predicted that the uncertainty was about ±2%.
Dimensionless coefficient called drag coefficient and related to drag force acting on the bluff body is then defined as follow:
S
V
F
dd C
2
2
1
∞
=
ρ
(5)
where, ρ is air density, V∞ is free stream velocity, S is
cross section area and Fd is total drag force which works on vehicles measured by a load cell.
3.
Results and Discussion
Flow field. Some selected results from computational as
well as experimental works are described in the follwing figures. Figure 5 (a-b) show computational result of comparison of flow structure alteration between the case without flow control and the case when using flow control by suction. The figure show the path line colored by velocity field.
The Figure 5 (a) shows the formation of the swirling structure (vortex) behind the rear part of the body near the side wall and the wheels which interact with each
(a) Without flow control
(b) With flow control by suction, Usc = 1 m/s
other and contribute to the complexity of the near wake flow region. Flow separation occurs because the fluid flow can not follows the shape of the object surface. Wake structure, other than caused by flow separation is also influenced by the presence of longitudinal vortices that appear at the edges of the side, rear side of the test model. Longitudinal vortex is formed due to the flow velocity difference between the wake and the side area of the test model.
From the definition of drag given by Onorato et al. [18] that the formation of aerodynamic drag on vehicles, other than caused by the separated flow and pressure loss, also the effect of longitudinal vortex interaction. Therefore, the flow control is placed on the back side of the flow near the longitudinal side edge where the vortex is formed. The aim of placement this flow control are reducing the vortex structure formation, the wake area and the total pressure loss in the wake.
Meanwhile, Fig. 5 (b) shows effect of placement of the flow control by suction gives the effect of reducing the wake and the vortex formation.
Figure 6 (a-b) shows computational result of pressure coefficient distribution comparison between the condition without flow control and the condition when flow control by suction is used.
(a) Without flow control
(b) With flow control by suction, Usc = 1 m/s Figure 6. Coefficient Pressure Distribution at the Rear of
the of the Reversed Ahmed Body with the Upstream Velocity, Uo = 13.9 m/s
From Fig. 6 (a), it can be seen that minimum value of pressure coefficient is -0.9256 at y/h = 1and z/w = -1/2 in the rear of the reversed Ahmed body. Meanwhile, Fig. 6 (b) indicates that by introducing suction, the location of minimum value of pressure coefficient shifted significantly to y/h = 1; z/w = -1/4 in the rear side of the body. The minimum value of pressure coefficient have been obtained was -0.6834. The increase of minimum value of pressure coefficient of 26.17% has been obtained. It indicates that the application of suction in the reversed Ahmed Body was able to reduce the total pressure loss and increase the static pressure at the surface of the object or model such as already been indicated by other studies [19-21].
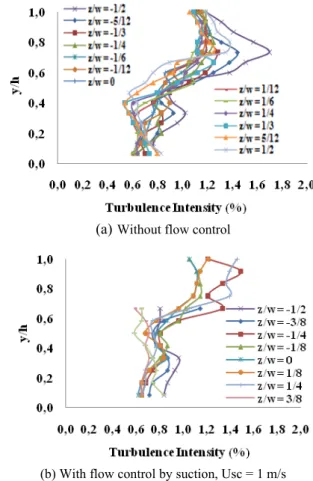
Turbulence intensity. Figure 7 describes computational
result of turbulence intensity comparison between the condition without flow control and the condition when flow control by suction is used.
Figure 7 (a) show the characteristics of turbulence intensity without flow control. It can be seen that the maximum value of turbulence intensity is about 1.70%. Furthermore, Fig. 7 (b) shows the effect of suction velocity in the rear part of the reversed Ahmed body to the turbulence intensity distribution. The maximum turbulence intensity under suction is about 1.49%.
(a)Without flow control
(b) With flow control by suction, Usc = 1 m/s Figure 7. Turbulence Intensity at the Rear of the of the
These results indicate that there is a decrease in the turbulence intensity by the use of suction mechanism in the rear part of the body. The decrease of turbulence intensity about 12.35% has been obtained.
Aerodynamic drag. Result of drag coefficient obtained
by using a computational approach is given in Table 2.
Table 2 indicates that the computational approach, the drag coefficient have been obtained about 1.781 without flow control. By introducing flow control by suction, the obtained drag coefficient is about 1.534. Thus, a drag reduction about 13.86% have been obtained.
Experimental validation. Experimental work was
carried out to validate the results of numerical computation for the aerodynamic drag. It was measured by using a load cell. The number of drag force data was 50 for each run. It was taken at upstream velocity 13.9 m/s for both test models i.e without flow control and with active flow control by suction at velocity 1 m/s. Data retrieval time interval was 100 seconds and fluctuated data obtained is shown in Fig. 8.
Experimentally, the influences of suction is analyzed according to the aerodynamic forces applied to the geometry, with and without control. The results are presented through aerodynamic drag reduction with respect to the reference configuration (without control). The mean drag coefficients, obtained at velocity of suction is indicated in Table 3.
From the Table 3, it appears that with the experimental approach, the obtained drag coefficient is about 1.523 without flow control. The placement of the flow control by suction reduces the drag coefficient about 1.274.
Table 2. Drag Coefficient (Cd), CFD
Description Drag coefficient (Cd)
Without flow control 1.781
With suction (Usc=1 m/s) 1.534
Figure 8. Fluctuated Drag Force Data at Upstream Velocity Uo = 13.9 m/s Taken by Experimental Test
Table 3. Drag Coefficient (Cd), Experiment
Description Drag coefficient (Cd)
Without flow control 1.523
With suction (Usc=1 m/s) 1.274
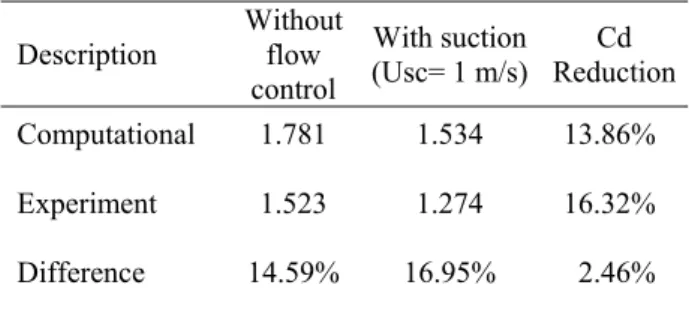
Table 4. Comparison Drag Coefficient (Cd)
Description Without flow control
With suction (Usc= 1 m/s)
Cd Reduction
Computational 1.781 1.534 13.86%
Experiment 1.523 1.274 16.32%
Difference 14.59% 16.95% 2.46%
Thus, the drag reduction about 16.32% have been obtained. It is closed to results obtained by Roumeas et.al which is drag reductions close to 18% were obtained both numerically and experiments for a suction velocity equal to 0.6 times the inlet farfield velocity [22].
The comparison of drag coefficient obtained by computational and experimental approach can be seen in Table 4.
Table 4 shows that the difference of drag coefficient between experiment and computational approach is about 14.59% for the case of without flow control. Meanwhile, for the case with suction flow control at suction velocity 1 m/s the difference is about 16.95%. Although drag reduction obtained by computational and experimental approaches has a difference for 2.46%, but both approaches produce the same tendency to the characteristic of suction effect for supporting the drag reduction.
4.
Conclusion
Acknowledgement
The authors would like to thank the Ministry of Research and Technology, Republic of Indonesia for funding this research through Research Incentive, Fundamental Research Grant 2011, Contract No. RD-2011-0863.
References
[1] S. Watkins, V. Gioacchino, J. Wind Eng. Ind. Aerodyn. 96 (2008) 1232.
[2] Z.M. Kassim, A. Filippone, Transport. Res. Part D-Transport. Environ. 15 (2010) 275.
[3] S. Ahmed, G. Ramm, G. Faltin, SAE Paper, Detroit, Michigan, USA, 1984, p.840300-01. [4] D. Sims-Williams, SAE Paper, Detroit, Michigan,
USA, 1998, p.980391-01.
[5] D. Bayraktar, D. Landman, O. Baysal, SAE Paper, Chicago, USA, 2001, p.2742-01.
[6] A. Spohn, P. Gillieron, IUTAM Symposium Unsteady Separated Flows, Toulouse, France, 2002, p.1.
[7] H. Lienhart, S. Becker, SAE Paper, Detroit, Michigan, USA, 2003, p.0656-01.
[8] T. Han, American Institute of Aeronautics and Astronautics Journal, 27 (1989) 9.
[9] B. Basara, V. Przulj, P. Tibaut, SAE Conf., Detroit, Michigan, USA, 2001, p.0701-01.
[10] B. Basara, ASME Fluid Engineering Division Summer Meeting, Proceedings FEDSM99-7324, San Francisco, USA, 1999.
[11] B. Basara, A. Alajbegovic, 7th Int. Symp. of Flow Modelling and Turbulence Measurements, Taiwan, 1998, p.1.
[12] P. Gillieron, F. Chometon, ESAIM, 7 (1999) 173. [13] S. Kapadia, S. Roy, K. Wurtzler, 41st Aerospace
Sciences Meeting and Exhibit, 0857 (2003) 1.
[14] Harinaldi, Budiarso, R. Tarakka, S.P.
Simanungkalit, Int. J. Mech. & Mechatronics Eng., IJMME-IJENS, 11/3 (2011) 24.
[15] C.H. Bruneau, E. Creusé, D. Depeyras, P. Gilliéron, I. Mortazavi, Computers & Fluids., 39 (2010) 1875.
[16] A. Kourta, P. Gillieron, J. Appl. Fluid Mech. 2 (2009) 69.
[17] User’s Guide Manual of Fluent 6.3, Fluent Inc., Cavendish Court, September 2006, p.618.
[18] M. Onorato, A.F. Costelli, A. Garonne, SAE, SP-569, International Congress and Exposition, Detroit, MI, 1984, p.85.
[19] M. Roumeas, P. Gillieron, A. Kourta, Computers & Fluids. 38 (2009) 60.
[20] M. Gad-El-Hak, Appeared in Applied Mechanics Reviews, 49 (1996) 365.
[21] E. Fares, Computers & Fluids. 35 (2006) 940. [22] M. Rouméas, P. Gillieron, A. Kourta, Journal of