59 | P a g e
Availability of basic amenities among poor households in
Himachal Pradesh: A cross sectional study
Saroj Kumar Rana
(Research Scholar),
1Desh Bhagat University, Mandi Gobindgarh, Punjab, (India)
ABSTRACT
Although India is way towards to meet its Millennium Development Goal for providing access to safe drinking
water and sanitation, thus remains a worrying discrepancy in access between urban and rural areas. In 2006,
96% of the urban population versus 86% of the rural population obtained their drinking water from an
improved water source.Poverty is “pronounced deprivation in well-being.” The wellbeing primarily linked to
commodities, so the poor are those who do not have enough income or consumption to keep them above some
adequate minimum threshold level. Poor household is defined as the position where household is deprived of
minimum requirement of standard of living. Poverty is a major rural phenomenon, as majority of poor live in
rural areas. Rural peoples regularly face geographically disadvantage, being in rural area where the access to
basic amenities is inadequate. Majority of poor households found deprived in rural areas as urban areas due to
lack of adequate resources. Access to basic amenities found very low due to lacking of government policies,
infrastructure and awareness of ongoing programs and campaign on rural development activity. The objective
is based on availability of basic amenities among poor households and to find the coverage of basic amenities
among characteristics of households in Himachal Pradesh. The present study is based on data collected on the
basis of basic household amenities such as decent house, sanitation, drinking water, cooking fuel, and drainage
in rural poor houses in Himachal Pradesh and data extracted from the study conducted by NSSO, Government
of India. Two-stages sampling were for data collection in all states of India. First stage sampling includes the
selection of census village in the rural areas and urban frame survey block in the urban sector. Second stage
include household was selected by using random sampling. Survey covered 65,932 households and 333,104
persons were interviewed all over 36 states of India. Study covered 896 households in Himachal Pradesh
including 757 non-poor households and 159 poor households. The study result revealed that Average
Household consumer expenditure and Average Monthly Household consumer expenditure found Rs. 5160 and
Rs. 862 and also average family size found 6 in poor households in Himachal Pradesh. septic tank/ flush system
(61.9%), open kutcha (37.4%), Tap(88.5%) and firewood and chips (77.0%) was the main source of Latrine,
Drainage system, drinking source and cooking fuel in poor households in Himachal Pradesh.Other house type
and Sikhism, Non- schedule cast and family size with one & two member family shows more availability of
latrine. Casual labour in non-agriculture house (93.5%),Sikhism (100%) SC(81%) and more than three member
60 | P a g e
of religion (80%) and non SC(20.3%) and family with one member (75%) have LPG as sources of cooking inpoor houses
Keywords:
Average household monthly consumption expenditure, Availability of types of house,
Basic household’s amenities, Drainage system, Monthly per-capita expenditure
I.INTRODUCTION
Poverty is “pronounced deprivation in well-being.” The wellbeing primarily links to commodities, so the poor
are those who do not have sufficient income or consumption above some adequate minimum threshold. This view sees poverty largely in monetary terms. Poverty may also be tied to a specific type of consumption, so we can, people could be house poor or food poor or health poor. The broadest approach to well-being (and poverty) generally focuses on the capacity of the individual. Poor people often lack key capabilities; they may have inadequate income or education, or be in poor health, or feel powerless, or lack political freedoms or less access to basic amenities. The provision of basic services such as piped water, cooking fuel, sanitation systems, and electricity has been an important goal of Indian developmental planning. Households assets and amenities reflected the quality of life. Electric lights enable more reading and education; new fuels and improved stoves
61 | P a g e
schemes functioning at the sub-national levels for the provision of various basic amenities. Under Bharat Nirman, various schemes (for improving the access to basic amenities in rural areas with special provisions for poor, excluded and marginalised groups), such as rural housing (Indira Awaas Yojana), rural drinking water supply (National Rural Drinking Water Programme under Rajiv Gandhi National Drinking Water Mission), Total Sanitation Campaign (which has been renamed Nirmal Bharat Abhiyan in May 2012 by the Ministry of Drinking Water and Sanitation), rural electrification (Rajiv Gandhi Grameen VidyutikaranYojana) among others, are functioning. A landmark initiative was the launch of Provision of Urban Amenities to Rural Areas (PURA) in 2004. In India, 82.7 percent rural and 91.4 percent urban populations having sustainable access to safe drinking water [11]. As per the 2011 Census of India, Rural India have 16.78 crores households in that 69.3% household don‟t have latrine facility within the household premises including with all states. 46.9% of the households having latrine facilities within the household‟s premises. 21.9% in rural area and 81.4% in urban area have been latrine facilities within the household‟s premises [11].
Objective:
1. To excess the availability of basic amenities among poor households in Himachal Pradesh.
2. To find the coverage of basic amenities among characteristics of poor households in Himachal Pradesh.
Study design
The present study is based on secondary data source collected by the National Sample Survey Organisation (NSSO-2014), India and data is extracted 139 for poor households in Himachal Pradesh.
Data source
The data based on basic households amenities and characteristics in different states of India and unit level data was extracted from the 25th schedule of the 71st round of the cross-sectional collected by the National Sample Survey Organization (NSSO) on „Health‟ and „Education‟. NSSO is a national organisation under the Ministry
of Statistics In India. The data was collected in all states of India from January to June 2014.
Methodology
Stratified two-stage sampling design was used for data collection. First stage sampling based on the selection of census village in the rural areas and urban frame survey blocks in the urban sector. In second stage, household was selected by using random sampling. Survey covered total of 4577 villages and 3720 urban blocks surveyed from which 36,480 and 29,452 households were sampled in rural and urban areas respectively. Survey covered 65,932 households and 333,104 persons were interviewed all over 36 states of India. Total 896 households were covered in Himachal Pradesh including 757 non-poor households and 139 poor households. The face-to-face interviews were conducted using an interview schedule, on households characteristics, Individual characteristics, morbidity (self-reported), utilization of health care services (including types) and household expenditure on health care.
Data analysis
62 | P a g e
Result
Households report average Household consumer expenditure (Rs.5160), Monthly per-capita expenditure (Rs. 862) and average family size was 6 respectively.
Average Household consumer expenditure and type of Houses
Maximum average of poor households found in other type of houses (Rs.7000) followed by Self-employed in non-agriculture (Rs.5226), Self-employed in agriculture (Rs.5188), Regular wage/salary earning(Rs.4912) and Casual labour in non-agriculture (Rs. 5034) respectively. Similarlly, maximum percapita consumer expenditure in other type of house(Rs.1133), self-employed in non-agriculture (Rs.945), regular wage/salary earning (Rs.908), self-employed in agriculture(Rs.822) and , casual labour in non-agriculture (Rs. 810) respectively. (Table1)
Average Household consumer expenditure and Religion
Sikhism (Rs.7500) reported maximum average expenditure followed by Christianity (Rs.6250), Islam (Rs.5618), Hinduism (Rs.5225) and Other (Rs.3378) respectively. Similarly, per-capita average expenditure was found for Sikhism (Rs.750), Christianity (Rs.893), Islam (Rs.786), Hinduism (Rs.860) and Other (Rs.997) respectively.(Table1)
Average Household consumer expenditure and Social group
Schedule Caste (SC) poor households report average expenditure (Rs.5228) and Non Schedule Caste (Rs. 5158) whereas per-capita average expenditure found SC (Rs.817) and Non-SC (Rs.870) respectively and average family size for both was 6.(Table1)
Average Household consumer expenditure and Family size
Household having more than 3 in family have average expenditure (Rs. 5462) followed by three members (Rs.3223), two members (Rs.1695) and one member (Rs. 988) respectively(Table1).
Table 1: Average Household consumer expenditure (Rs.), Amount of medical insurance
premium (Rs.), Average Monthly Household usual consumer expenditure (Rs.) and Average
Household size among poor household’s characteristics in Himachal Pradesh
Average Household consumer expenditure (Rs.)
Average Monthly Household
consumer expenditure (Rs.)
Average Household
size
Overall 5160 862 6
Household type
Self-employed 5188 822 6 Self-employed in
63 | P a g e
Regular wage/salary
earning 4912 908 5
Casual labour in
non-agriculture 5034 810 6
Other 7000 1133 7
Religion
Hinduism 5225 860 6
Islam 5618 786 7
Christianity 6250 893 7
Sikhism 7500 750 10
Other 3378 997 4
Social Group Schedule Caste 5228 817 6 Non Schedule Caste 5148 870 6
Family Size
One Member 988 988 -
Two member 1695 848 -
Three member 3223 1074 -
More than Three
members 5462 852 -
Overall poor households shows major source of latrine as
septic tank/ flush system (61.9%), Service64 | P a g e
source of latrine. More than three members shows septic tank/ flush system(60.6%), Service latrine(1.6%), Pit(11.0%) and other (0.8% )as a source of latrine whereas 25 % do not have latrine in house.(Table 2)
Table 2: Availability of type of latrine among poor household’s characteristics in Himachal
Pradesh
Service
latrine Pit
septic tank/
flush system No Latrine others
Overall 2.2 10.1 61.9 25.2 0.7
Household type
Self-employed 5.2 12.1 62.1 20.7 0.0 Self-employed in
non-agriculture 0.0 3.7 77.8 14.8 3.7
Regular wage/salary
earning 0.0 0.0 55.0 45.0 0.0 Casual labour in
non-agriculture 0.0 19.4 48.4 32.3 0.0
Other 0.0 0.0 100.0 0.0 0.0
Religion
Hinduism 1.7 10.3 62.4 24.8 0.9
Islam 9.1 9.1 36.4 45.5 0.0
Sikhism 0.0 0.0 100.0 0.0 0.0 Other 0.0 10.0 80.0 10.0 0.0
Social Group SC 4.8 19.0 42.9 28.6 4.8 Non SC 1.7 8.5 65.3 24.6 0.0
family size
One Member 0.0 0.0 75.0 25.0 0.0
Two member 0.0 0.0 75.0 25.0 0.0 Three member 25.0 0.0 75.0 0.0 0.0
More than Three members 1.6 11.0 60.6 26.0 0.8
65 | P a g e
open kutcha (54.5%), covered pucca (9.1%), underground (9.1%) and whereas 27.3% houses do not drainage system. Sikhism shows 100% open pucca drainage system in houses and other shows as open kutcha (30%), open pucca (70%). Based on social group; Schedule caste shows as open kutcha (47.6%), open pucca (9.5%), underground (4.8%) and whereas 38.1% houses do not drainage system. Non-Schedule caste shows as open kutcha (35.6%), open pucca (17.8%), covered pucca (10.2%), underground (5.1%) and whereas 31.4% houses do not drainage system. Based on family size; One family member shows as open kutcha (25.0%) and open pucca (75%). Two members family shows as open kutcha (75%) and open pucca (25%) respectively. Three members showed as open pucca (25%) and underground (25%) and whereas 50% houses do not drainage system. More than Three members shows as open kutcha (37.8%), open pucca (14.2%), covered pucca (9.4%) and underground (4.7%) and whereas 33.9% houses do not drainage system.(Table3)
Table 3: Availability of drainage sources among poor households characteristics in Himachal
Pradesh
Open kutcha
Open pucca
Covered
pucca Underground
No drainage
Overall 37.4 16.5 8.6 5.0 32.4
Household type
Self-employed 44.8 17.2 6.9 6.9 24.1 Self-employed in
non-agriculture 25.9 33.3 11.1 3.7 25.9
Regular wage/salary earning
30.0 5.0 10.0 10.0 45.0
Casual labour in
non-agriculture 38.7 6.5 6.5 0.0 48.4
Other 33.3 33.3 33.3 0.0 0.0
Religion
Hinduism 36.8 12.8 9.4 5.1 35.9
Islam 54.5 0.0 9.1 9.1 27.3
Sikhism 0.0 100.0 0.0 0.0 0.0 Other 30.0 70.0 0.0 0.0 0.0
Social Group
SC 47.6 9.5 0.0 4.8 38.1
Non SC 35.6 17.8 10.2 5.1 31.4
Family size
One Member 25.0 75.0 0.0 0.0 0.0
Two member 75.0 25.0 0.0 0.0 0.0 Three member 0.0 25.0 0.0 25.0 50.0
More than Three
66 | P a g e
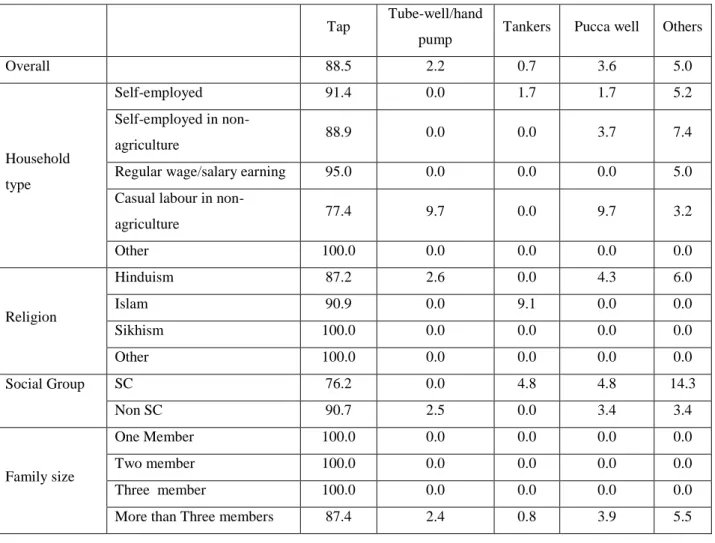
Overall poor households show availability of water source as Tap (88.5%), Tube-well/hand pump (2.2%), Tankers (0.7%), Pucca well (3.6%) and other (5.0%) respectively. According to households type; Self-employed houses shows as Tap (91.4%), Pucca well (1.7%) and others (5.2%) respectively. Self-employed in non-agriculture houses shows water sources as Tap (88.9%), Pucca well (3.7%) and other (7.4%) respectively. Regular wage/salary earning houses shows as Tap (95%) and other (5.0%) where as other poor houses shows 100% Tap as water source. Based on Religion; Hinduism shows as availability of water source as Tap (87.2%), Tube-well/hand pump (2.6%), Pucca well (4.3%) and other (5.0%). Islam shows water source as Tap (90.9%) and Tankers and Sikhism as well as other categories shows 100% Tap as water source in houses. Based on social group; Schedule caste shows as Tap (76.2%), Tankers (4.8%), Pucca well (4.8%) and other (14.3%) and whereas Non-Schedule caste shows as Tap (90.7%) and Tube-well/hand pump (2.5%) respectively. Based on family size; One member, Two members and three member family shows 100 % Tap as water sources whereas Tap (87.4%),Tube-well/hand pump (2.4%),Tankers (0.8%), Pucca well (3.9%) and other (5.5%) respectively.(Table4)
Table 4: Availability of source of drinking water among poor households characteristics in
Himachal Pradesh
Tap Tube-well/hand
pump Tankers Pucca well Others
Overall 88.5 2.2 0.7 3.6 5.0
Household type
Self-employed 91.4 0.0 1.7 1.7 5.2
Self-employed in
non-agriculture 88.9 0.0 0.0 3.7 7.4 Regular wage/salary earning 95.0 0.0 0.0 0.0 5.0
Casual labour in
non-agriculture 77.4 9.7 0.0 9.7 3.2
Other 100.0 0.0 0.0 0.0 0.0
Religion
Hinduism 87.2 2.6 0.0 4.3 6.0
Islam 90.9 0.0 9.1 0.0 0.0
Sikhism 100.0 0.0 0.0 0.0 0.0
Other 100.0 0.0 0.0 0.0 0.0
Social Group SC 76.2 0.0 4.8 4.8 14.3
Non SC 90.7 2.5 0.0 3.4 3.4
Family size
One Member 100.0 0.0 0.0 0.0 0.0
Two member 100.0 0.0 0.0 0.0 0.0 Three member 100.0 0.0 0.0 0.0 0.0
67 | P a g e
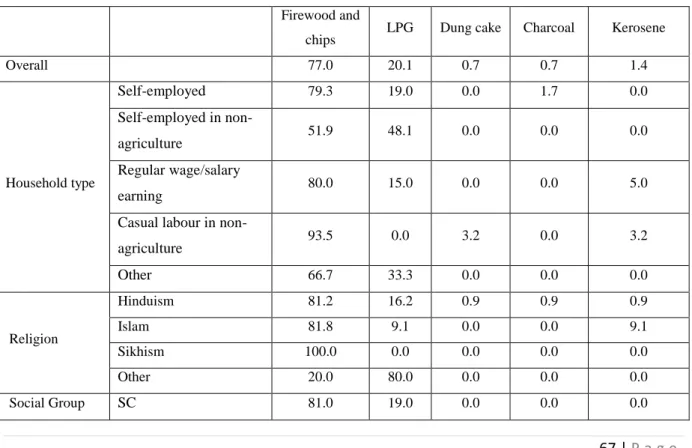
Overall poor households show availability of fuel sources as Firewood and chips (77%), LPG (20.1%), Dung cake (0.7%), Charcoal (0.7%) and Kerosene (1.4%) respectively. According to households type; Self-employed houses shows as Firewood and chips (79.3%) and LPG (19.0%) and charcoal(1.7%, Self-employed in agriculture houses shows Firewood and chips (80%), LPG (15%) and Kerosene (5%), Casual labour in non-agriculture shows as as Firewood and chips (93.5%), Dung cake (3.2%) and Kerosene (3.2%), Regular wage/salary earning houses shows as Firewood and chips (80%), LPG (15%) and Kerosene (5%), other (5%), other houses shows as Firewood and chips (66.7%) and LPG (33.3 respectively. Based on Religion; Hinduism shows as availability of cooking fuel as Firewood and chips (81.2%), LPG (16.2%), Dung cake (0.9%), Charcoal (0.9%) and Kerosene (0.9%), Islam shows fuel sources Firewood and chips (81.8%), LPG (9.1%) and Kerosene (9.1%), Sikhism shows 100% Firewood and chips as source and other categories shows Firewood and chips (20%) and LPG(80%) source of fuel. Based on social group; Schedule caste shows as Firewood and chips (81%), LPG (191%) and whereas Non-Schedule caste shows as Firewood and chips (76.3%), LPG (20.3%), Dung cake (0.8%), Charcoal (0.8%) and Kerosene (1.7%) respectively. Based on family size; One member shows as Firewood and chips (25%), and LPG (75%), Two members shows as Firewood and chips (75%) and LPG (25%), and three member family shows as Firewood and chips (503%), and LPG (50%), More than 3 member shows as Firewood and chips (79.5%), LPG (17.3%), Dung cake (0.8%), Charcoal (0.8%) and Kerosene (1.8%).(Table5)
Table 5: Availability of type of cooking source among non-poor and poor households
characteristics in Himachal Pradesh
Firewood and
chips LPG Dung cake Charcoal Kerosene
Overall 77.0 20.1 0.7 0.7 1.4
Household type
Self-employed 79.3 19.0 0.0 1.7 0.0 Self-employed in
non-agriculture 51.9 48.1 0.0 0.0 0.0
Regular wage/salary
earning 80.0 15.0 0.0 0.0 5.0 Casual labour in
non-agriculture 93.5 0.0 3.2 0.0 3.2
Other 66.7 33.3 0.0 0.0 0.0
Religion
68 | P a g e
Non SC 76.3 20.3 0.8 0.8 1.7
Family size
One Member 25.0 75.0 0.0 0.0 0.0 Two member 75.0 25.0 0.0 0.0 0.0 Three member 50.0 50.0 0.0 0.0 0.0 More than Three
members 79.5 17.3 0.8 0.8 1.6
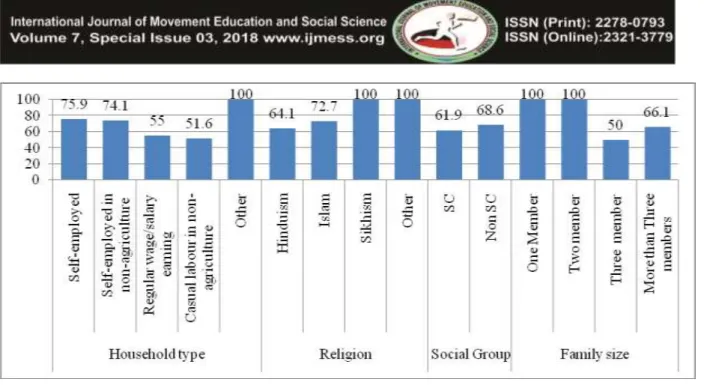
Different house type shows availability of improve sanitation as Self-employed (74.2%), Self-employed in non-agriculture (81.5%), Regular wage/salary earning (55%), Casual labour in non-non-agriculture (67.8%) and other (100%), Religionwise; Hinduism (72.7%), Islam (45.5%), Sikhism (100%) and Other (90%), social group wise; SC(61.9%) and Non SC (73.8%) whereas Family memberwise; One member (75%), Two members (75%), Three Member (75%) and More than three members (71.6%) shows improve saniataion in poor household in Himachal Pradesh.(Fig.1)
Fig 1: Availability of Improve sanitation in poor households
69 | P a g e
Fig 2: Availability of drainage in poor householdsDifferent house type shows availability of improve water as Self-employed (91.4%), Self-employed in non-agriculture (88.9%), Regular wage/salary earning (95%), Casual labour in non-non-agriculture (87.1%) and other (100%), Religionwise; Hinduism (89.8%), Islam (90.9%), Sikhism (100%) and Other (100%), social group wise; SC(76.2%) and Non SC (93.2%) whereas Family memberwise; One member (100%), Two members (100%), Three Member (100%) and More than three members (89.8%) shows availability of improve water in poor household in Himachal Pradesh.(Fig.3)
Fig 3: Availability of Improve drinking source in poor households
70 | P a g e
Fig 4: Availability of Improve cooking source in poor householdsII.DISCUSSION
71 | P a g e
progress. The poor section area had very low coverage in 1992–1993 (1%) and improved only modestly to 4.5% by 2005– 2006. Hindu households have the lowest sanitation coverage, followed by Muslim households [16]. Maximum open defecation found in Regular wage/salary earning house (45%), Islam religion (45.5%), Scheduled caste (28.6%) and family with more than 3 members (26%) hae more open defecation in their house. Open defecation [18] was found 44.1% overall whereas rural (47.1%) and urban (1.8%) where as open defecation (14.3%), rural (4.0%) and urban (4.0%) respectively [17]. District Chamba (31.2%) and Kangra (33.5%) districts have very low toilet facility where as Mandi (75.2%) and Hamirpur (70.2%) showed more toilet facility [17]. Majority of households have open kutcha drainage system (37.4%) and 32.4% houses do not have drainage Overall, 8% of households had access to underground drainage systems in 2005– 2006; 47% had no access to any drainage system; 17% had access to open kutcha (mud drainage with no concrete lining); 19% had access to open pucca (channels with concrete lining) drainage systems; and 8% had access to covered cement drainage systems. In rural areas, 60% of households had no access to drainage systems compared to 15% in urban areas [16]. Majority of houses have Tap (88.5%) as a main source of water. Tap water shows significant increase in all characteristics of household. Overall average was Pipe water (68.1%), rural (66.3%) and urban (82.5%) was the main source of drinking water [18]. According to DLHS3; Pipe water (45.2%), rural (42.3%) and urban (77.2%) was the main sources of drinking water. All districts of Himachal Pradesh have availability of drinking water significantly higher more than 90% [17]. Majority of houses have Firewood and chips (77%) and LPG (20.1%) as a main source of cooking. Casual labour in non-agriculture house (93.5%),Sikhism (100%) SC(81%) and more than three member family (79.5%) have Firewood and chips where as Self-employed in non-agriculture (48.1%), other categories of religion (80%) and non SC(20.3%) and family with one member (75%) have LPG as sources of cooking in poor houses.Overall state (24.6%), Rural (19.6%) and urban (78.5%) showed LPG as source of cooking where electricity (0.3%) showed same for urban as well as rural area of himachal pradesh [17]. According to NFHS-3; Overall state (35.1%), Rural (28.9%) and urban (83.6%) showed LPG as source of cooking where overall average for electricity (1.4%), rural(1%) and urban (5.1% showed source of cookingin Himachal Pradesh.
III.CONCLUSION
72 | P a g e
Acknowledgements
None.
Competing interests
The author declared that he has no competing interests.
Consent for publication
Not applicable.
REFERENCE
1. T. B Arya, Water and Sanitation in U.P., Fresh Water Action Network for South Asia (FANSA), 2009. 2. P. Bajpai, L. Bhandari, Ensuring Access to Water in Urban Households, Economic and Political Weekly,
Vol. 36, No.39,2001.
3. M. Haq et. Al, Household‟s Willingness to Pay for Safe Drinking Water, A Case Study of Abbottabad District, The Pakistan Development Review, Vol.46, No.4, 2007.
4. P. Bajpai, L. Bhandari Results of an NSSO Survey of Urban Water Access, Implications for Policy, India
Infrastructure Report, Ensuring Value for Money, Oxford University Press, New Delhi, 2004.
5. S. Phansalkar, Water, Equity and Development, International Journal of Rural Management, Vol. 3, No.1,
2007.
6. M. H. Zereh, Urban Water and Waste Water, India Infrastructure Report, Urban Infrastructure, Oxford University Press, New Delhi, 2006.
7. Shaban, A. and R. N. Sharma (2007), “Water Consumption Patterns in Domestic Households in Major Cities, Economic and Political Weekly,Vol. 42, No. 23, 2007.
8. Progress on Drinking Water, Sanitation and Hygiene, Update and SDG Baselines WHO/UNICEF 2017.
Available from: www.unicef.org/publications/index_96611. html,.
9. A. Prüss-Ustün, J. Bartram, T. Clasen, J. M. Colford, O. Cumming, V. Curtis, S. Bonjour, A. Dangour, De
J. France, L. Fewtrell, M. Freeman, B. Gordon, P. Hunter, R. Johnston, C. Mathers, D. Mäusezahl, K.. Medlicott, M. Neira, M. Stocks, J. Wolf, S. Cairncross, Burden of disease from inadequate water, sanitation and hygiene in low- and middle-income settings, a retrospective analysis of data from 145 countries. Trop. Med. Int. Health 19 (8), 894–905,2014.
10. J. Brown, S. Cairncross, J.H.J Ensink, Water, sanitation and enteric infections in children. Arch. Dis. Child. 98 (8), 629–634, 2013.
11. Census of India, 2011.
12. Report of the expert group to review the methodology for measurement of poverty, Government of India
Planning Commission June, Annexure- B, Page 28, 2014.
73 | P a g e
14. S. Bonu, H. Kim, Sanitation in India, Progress, Differentials, Correlates and Challenges, Asian Development Bank, South Asia Occasional Paper Series No. 2, 2009.
15. S. Srinivasan, S.K. Mohanty, Deprivation of Basic Amenities by Caste and Religion, Empirical Study using
NFHS Data, Economic and Political Weekly, vol. 39, No. 7, pp. 728-735, 2004.
16. B. Sekhar, K. Hun, Sanitation in India Progress, Differentials, Correlates, and Challenges, Asian Development Bank.