Imprint
Responsibility: PrimeEnergyIT Project consortium, July 2011
Project coordination: Dr. Bernd Schäppi, Austrian Energy Agency, Vienna
Reprint allowed in parts and with detailed reference only. Printed on non-chlorine bleached paper. The sole responsibility for the content of this publication lies with
the authors. It does not necessarily reflect the opinion of the European Union. Neither the EACI nor the European Commission are responsible for any use that may be made of the information contained therein.
remaining energy saving potential is still large and new technologies allow even more effective deploy-ment of saving options.
This brochure provides a short overview of current technologies supporting energy efficiency both for IT and infrastructure, with a focus on IT technology. It covers all essential IT technologies in the data centre, including servers, data storage and network equipment. Efficiency approaches include effective system design, power management from hardware to data centre level as well as consolidation and virtualisation approaches.
Recommendations for best practice highlight promising options to be considered in management and procurement. A number of resources for further reading are indicated. The brochure provides a source of basic information for IT and infrastructure managers to support energy- and cost-efficiency.
This brochure has been produced as part of the international project PrimeEnergyIT (www.efficient-datacenters.eu)
which is conducted within the framework of the EU programme Intelligent Energy Europe.
Content
1 Monitoring of energy consumption in server rooms and data centres 6
1.1 Monitoring concepts 6
1.2 Measurement devices 9
2 Server Equipment 10
2.1 Energy efficiency and power management at the server and component level 10
2.1.1 CPU efficiency 12
2.1.2 Power supply efficiency 13
2.2 Power management at rack to data centre level 14
2.2.1 Capacity planning and energy management 14
2.2.2 Power capping 16
2.3 Specific power management options for blade servers 16
2.3.1 Blade chassis and blade components 17
2.3.2 Blade system - power and cooling issues 19
2.4 Server virtualization 21
2.4.1 Energy saving potential of virtualization 22
2.4.2 Requirements and tools for virtualization planning 23 2.4.3 Power management in virtualized environments – virtual server migration 24 2.4.4 Cooling and infrastructure for virtualized systems 25
3 Data Storage Equipment 28
3.1 Storage devices 28
3.1.1 Tape based systems 28
3.1.2 Hard Disk Drives (HDDs) 29
3.1.3 Solid State Drives (SSDs) 31
3.1.4 Hybrid Hard Drives (HHDs) 31
3.2 Storage elements 32
3.2.1 Large capacity drives and small form factor 32
3.2.2 Massive Arrays of Idles Disks (MAIDs) 32
3.2.3 Efficient RAID levels 32
3.2.4 Horizontal storage tiering, storage virtualization and thin provisioning 33 3.2.5 Consolidation at the storage and fabric layers 34
5.1.1 Split systems and portable systems 44
5.1.2 Measures to optimize energy efficiency 45
5.2 Cooling for medium to large data centres 46
5.2.1 General aspects 46
5.2.2 Temperature and humidity settings 47
5.2.3 Component efficiency - chillers, fans, air handling units 48
5.2.4 Free cooling 48
5.2.5 Rack based cooling / in row cooling 49
Minimum Monitoring – Performing periodic spot measurements with portable equipment is mainly an approach for very small facilities. Some data is acquired from manufacturer’s information (power input, etc). The approach does not require investment in permanently installed measurement equipment and infrastructure.
Advanced Monitoring – Data is logged in real time by using permanently installed equipment not necessarily supported by online tools. Limited modifications to the infrastructure should be ex-pected.
State-of-the-Art Monitoring – Data is collect-ed by the use of automatcollect-ed/permanent recording systems in real time, with the support of online software with extensive capability for analysis. Modifications in the infrastructure are needed and support from expert technical staff mostly will be required.
The monitoring system must have the necessary number of “info nodes” (or monitoring points) to provide the required information for comprehen-sive energy consumption analysis. In larger facili-ties the “info nodes” selection should start with the most representative subsystems (in terms of power usage). Figure 1.1 shows the most impor-tant subsystems for which energy consumption should be monitored. These subsystems can also be considered as “info nodes” or “monitoring points”.
The following typical approaches for monitoring may be applied:
Power Switchgear Generators UPS etc. Cooling Chillers Free cooling etc.
Building load
IT load
IT Services Storage Telco equipment etc. IT equipment power Total facility power
Fig. 1.1 Simple schematic with the key data centre subsystems [Source: ASHRAE [2]].
1
Monitoring of energy consumption in
server rooms and data centres
Carlos Patrao, University of Coimbra
1.1 Monitoring concepts
Monitoring of energy consumption in server rooms and data centres is essential to detect energy sav-ing potentials and evaluate the effectiveness of efficiency measures. Monitoring concepts should be designed with care to ensure that right data is collected, supporting effective measures. The following aspects are to be considered [1]:
•
Required accuracy and resolution of data•
Breakdown of data collection, ability to collectdata from all desired devices
•
User friendliness and ease of integration of data across devices and time scales•
Scalability for mass deployment and multi-site capability•
Adaptability to new measurement needs•
Data analysis options and integration withcon-trol systems
•
Ability to detect problems and notify data cen-tre operators•
Power usage tool:http://estimator.thegreengrid.org/puee
•
PUE reporting toolhttp://www.thegreengrid.org/en/Global/Content/ Tools/PUEReporting
•
PUE Scalability Metric and Statistics Spread-sheethttp://www.thegreengrid.org/library-and-tools.aspx ?category=MetricsAndMeasurements&range= Entire%20Archive&type=Tool&lang=en&paging=All# TB_inline?&inlineId=sign_in
•
PUE and DCiE Data Centre Efficiency Measure-menthttp://www.42u.com/measurement/pue-dcie.htm
capabilities (Source ASHRAE):
•
Reliable data collection and data storage at the required rates and accuracy•
Normalization of data from different devices, interfaces and protocols•
Data storage for long measurement periods•
Analysis and visualization of data in form of tables and graphs•
Scaling of the architecture with the data centre expansionKey aspects to be taken into account when choosing the devices for the monitoring system among others are instrument range, resolution and accuracy.
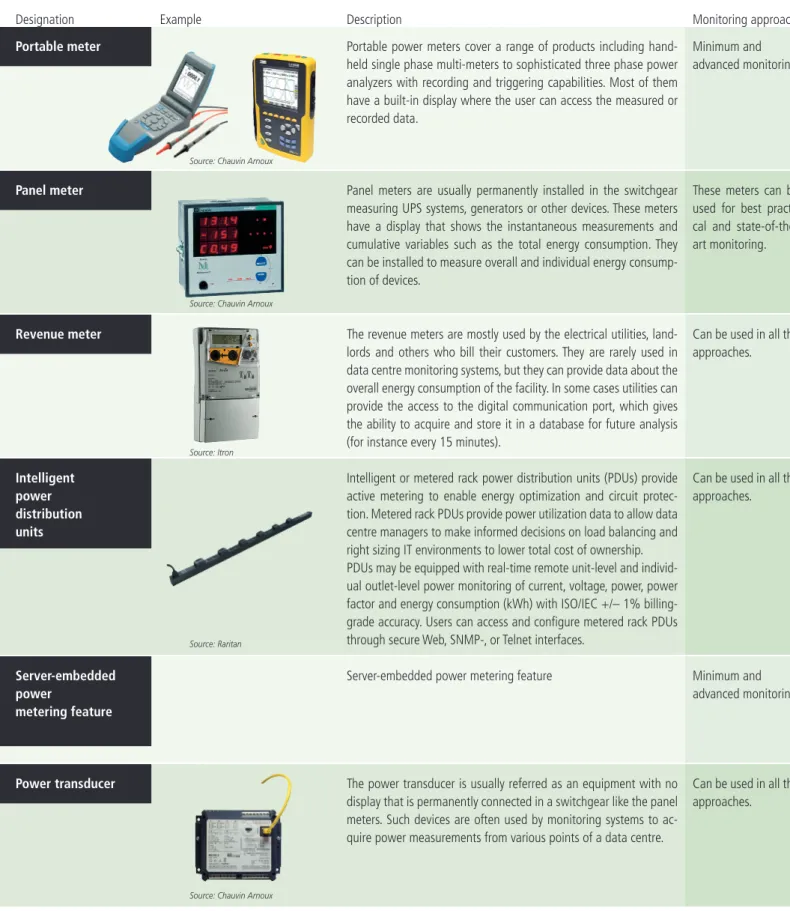
Tab. 1.1Examples for energy metering devices
Example Description Monitoring approaches
Designation
Portable power meters cover a range of products including hand-held single phase multi-meters to sophisticated three phase power analyzers with recording and triggering capabilities. Most of them have a built-in display where the user can access the measured or recorded data.
Panel meters are usually permanently installed in the switchgear measuring UPS systems, generators or other devices. These meters have a display that shows the instantaneous measurements and cumulative variables such as the total energy consumption. They can be installed to measure overall and individual energy consump-tion of devices.
The revenue meters are mostly used by the electrical utilities, land-lords and others who bill their customers. They are rarely used in data centre monitoring systems, but they can provide data about the overall energy consumption of the facility. In some cases utilities can provide the access to the digital communication port, which gives the ability to acquire and store it in a database for future analysis (for instance every 15 minutes).
Intelligent or metered rack power distribution units (PDUs) provide active metering to enable energy optimization and circuit protec-tion. Metered rack PDUs provide power utilization data to allow data centre managers to make informed decisions on load balancing and right sizing IT environments to lower total cost of ownership. PDUs may be equipped with real-time remote unit-level and individ-ual outlet-level power monitoring of current, voltage, power, power factor and energy consumption (kWh) with ISO/IEC +/– 1% billing-grade accuracy. Users can access and configure metered rack PDUs through secure Web, SNMP-, or Telnet interfaces.
Server-embedded power metering feature
The power transducer is usually referred as an equipment with no display that is permanently connected in a switchgear like the panel meters. Such devices are often used by monitoring systems to ac-quire power measurements from various points of a data centre.
Minimum and advanced monitoring.
These meters can be used for best practi-cal and state-of-the-art monitoring.
Can be used in all the approaches.
Can be used in all the approaches.
Minimum and advanced monitoring.
Can be used in all the approaches. Portable meter Panel meter Revenue meter Intelligent power distribution units Server-embedded power metering feature Power transducer
Source: Chauvin Arnoux
Source: Chauvin Arnoux
Source: Itron
Source: Raritan
1.2 Measurement devices
A large number of types of measurement devices is available for measuring key variables such as energy consumption, temperature, flow rate and humidity.Some examples for energy measuring devices are presented in table 1.1 (left, on page 8). For further reading see the sources indicated in the follow-ing section or access the “Technology Assessment Report” available at the PrimeEnergyIT website.
Further Reading
ASHRAE (2010): Real-Time Energy Consump-tion Measurements in Data Centres, ASHRAE – American Society of Heating, Refrigerating and Air- Conditioning Engineers, 2010.
ISBN: 978-1-933742-73-1
Stanley, J. and Koomey, J. (2009): The Science of Measurement: Improving Data Centre Perfor-mance with Continuous Monitoring and Meas-urement of Site Infrastructure, Stanley John and Koomey Jonathan, October 2009
www.analyticspress.com/scienceofmeasurement.html Ton, M. et al (2008): DC Power for Improved Data Centre Efficiency,Ton, My, Fortenbery, Brian and Tschudi, William, Ecos Consulting, EPRI, Law-rence Berkeley National Laboratory, March 2008 http://hightech.lbl.gov/documents/data_centres/ dcdemofinalreport.pdf
The Green Grid (2008): Green Grid Data Centre Power Efficiency Metrics. White Paper 6, The Green Grid, White Paper 6. December 30, 2008 http://www.thegreengrid.org/Global/Content/white- papers/The-Green-Grid-Data-Centre-Power-Efficiency-Metrics-PUE-and-DCiE
Rasmussen N. (2009): Determining Total Cost of Ownership for Data Centre and Network Room Infrastructure, Neil Rasmussen, APC by Schneider Electric, White paper #6 – Revision 4
http://www.apcmedia.com/salestools/CMRP-5T9PQG_ R4_EN.pdf
Rasmussen N. (2010): Avoiding Costs From Oversizing Data Centre and Network Room Infra-structure, Neil Rasmussen, APC by Schneider Elec-tric, 2010. White paper #37 – Revision 6 http://www.apcmedia.com/salestools/SADE-5TNNEP_ R6_EN.pdf
Schneider Electric (2011):E-learning website (Energy University) that provides the latest infor-mation and training on Energy Efficiency concepts and best practice
www.myenergyuniversity.com
Webinar: „The Data Centre in Real Time: Moni-toring Tools Overview & Demon“
http://www.42u.com/webinars/Real-Time-Measurement-Webinar/playback.htm
References
[1] Stanley, J. and Koomey, J. (2009): The Science of Measurement: Improving Data Centre Performance with Continuous Monitoring and Measurement of Site Infrastructure. October 2009. [2] ASHRAE (2010): Real-Time Energy Con sump tion Measurements in Data Centres: ASHRAE- American Society of Heating, Refrigerat-ing and Air-ConditionRefrigerat-ing Engineers, 2010. ISBN: 978-1-933742-73-1.
2.1 Energy efficiency and
power management at the
server and component level
Energy efficiency of servers has been strongly im-proved in the last years, mainly due to develop-ment of effective power managedevelop-ment for hard-ware components. To date, server energy efficiency is assessed and declared based on Energy Star re-quirements and the SPECpower benchmark (SPEC: Standard performance evaluation corporation). The current ENERGY STAR requirements for enter prise servers [1] stipulate energy efficiency criteria for rack and pedestal servers contain-ing up to 4 processor sockets. The requirements define maximum levels for power consumption in On Idle Mode for 1- and 2-CPU socket serv-ers as well as criteria for power supply efficiency and power management features (see Table 2.1 and Table 2.4). The idle mode criteria are primarily useful as an efficiency indicator for low average load conditions close to idle operation. Such low loads on servers (e.g. < 15%) are still quite com-mon, although hardware consolidation to achieve higher load levels should be a general goal. Server energy efficiency at higher workloads and for consolidated systems is addressed with the SPECpower–benchmark, which however is fo-cused more on CPU-related efficiency and CPU intense workloads (see information below). A comprehensive Server Efficiency Rating Tool (SERT) addressing all major server hardware components at different load levels is currently in develop-ment by SPEC [2] and will be available in winter 2011/2012. The SERT tool will assess server ef-ficiency based on partial benchmarks for CPU, memory, storage and system (Table 2.2). The tool will support IT managers in selecting energy ef-ficient hardware for specific applications.Server equipment consumes about 30–40% of the total energy used in data centres and server rooms. Therefore, it is one of the primary areas to implement effective energy saving measures. Typical server equipment in common server rooms and data centres includes standard rack servers, blade servers, as well as pedestal servers and multi-node servers.
The energy efficiency potential is high and depending on the type of IT system and the measures applied, energy savings of 20–60% or even beyond can be achieved. The primary approaches for improving energy efficiency involve energy efficient hardware selection and system design, power management at all levels from the hardware component to the total system and last but not least hardware consolidation and virtualization.
The following chapter provides information on power saving technologies and options from the component to the system level. Energy efficiency issues and possible measures for improvement are provided from the server to the rack and data centre level. Two specific sections address blade server technology and server virtualization as potential efficiency strategies. Specific recommendations for best practice options are highlighted in boxes.
Category Number of
installed processors
Managed server Base Idle State Power Allowence (W) A 1 No 55 B 1 Yes 65 C 2 No 100 D 2 Yes 150
Tab. 2.1Energy Star Idle Power Criteria
Tab. 2.2Concept of SERT assessment tool Server
Benchmark result system CPU Benchmark result Memory Benchmark result Storage Benchmark result
D IO
2
Server Equipment
Bernd Schäppi, Thomas Bogner, Hellmut Teschner, Austrian Energy Agency
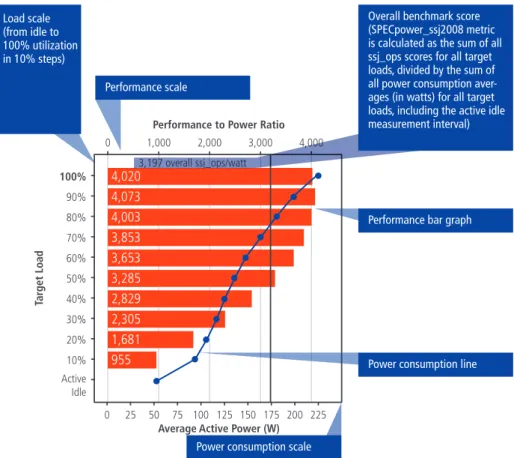
ent load levels. Thus servers can be compared at different load levels from idle to 100%. For pro-curement purposes the complete SPECpower in-formation (also containing detailed configuration information) should be requested from suppliers. Furthermore it should be considered that products are often tested in low configurations.
Recommendations for best practice
Energy efficiency criteria and benchmarks for hard-ware selection•
Use the efficiency criteria from Energy Star for procure-ment if applicable. For servers operated at low loads, Energy Star Vers.1 requirements for idle mode may serve as reasonable efficiency indicators. Requirements for power supplies can be used for any type of equipment.•
Request SPECpower_ssj2008 (and SPEC-SERT as soon asavailable) benchmarking results from manufacturers. For SPECpower, consider the following issues:
■ It is a CPU centric benchmark, thus most representative for CPU intense workloads.
■ Servers may have been tested at rather low configura-tion (thus check configuraconfigura-tion).
■ To arrive at robust interpretation, consider not only the overall score (overall operations per watt) but also the detailed benchmarking data.
Active Idle 0 25 50 75 100 125 150 175 200 225 3,653 3,285 2,829 1,681 955 2,305
Average Active Power (W)
Tar
get Load 50%
40% 30% 20%
10% Power consumption line
Power consumption scale
2.1.1 CPU efficiency
CPUs are the most energy consuming components in servers, thus energy efficient CPU models with effective power management can strongly support efficiency.
CPU energy consumption depends on the specific voltage and the clock frequency. Power manage-ment at CPU or core level therefore is based on Dynamic Voltage and Frequency Scaling (DVFS) or switch-off of cores. Energy consumption of CPUs is often compared on the basis of the thermal design power (TDP) that indicates the maximum power the cooling system in a server is required to dis-sipate. However, TDP provides only limited infor-mation, as overall efficiency also strongly depends on power management. Manufacturers offer spe-cific low power CPU versions that allow significant energy savings in practice, if the specific perfor-mance requirements can be met.
Energy efficiency of CPUs strongly depends on the effective implementation of power manage-ment. Common operating systems support power management based on the Advanced
Configura-tion and Power Interface (ACPI) specificaConfigura-tions for processor performance states and power con-sumption (P-States) and thermal management states (C-States). The new system and component controls enabled by ACPI Vs 3 provide higher-level power management engines allowing a finer grained power and performance adjusting based on demand. In many recent server models, prede-fined power profiles can be applied, e.g.:
■“High performance” (appropriate for servers
that run at very high utilisation and need to provide maximum performance, regardless of power costs)
■“Power saver mode” / “Minimum power
us-age” (applied to servers that are run at low utilization levels and have more performance capability than really needed, using this mode may provide incremental power savings)
■“Balanced power and performance”
Figure 2.2 shows the positive effects of modern CPU power management in benchmark results (SPECpower) for the server product family HP Pro-Liant DL 380: the ratio of idle power to full load power has been strongly reduced from genera-tion G5 to G7 of the specific server model. For the DL 380 G5 server, idle power (no load) was 33% (170 watts) lower than full load power (253 watts). For G7, it is about 75% lower compared to maximum power. This shows that new server technology is much more energy efficient at low load or idle operation, due to intelligent power management at CPU level. The computing perfor-mance for the specific server model on the other hand has been increased by more than a factor of three.
For hardware configuration in procurement, it is generally essential to check for concrete perfor-mance requirements to be met by the hardware
Example of SPECpower-benchmark for different server generations Active Idle 100% 0 1,000 3,197 overall ssj_ops/watt 2,000 3,000 4,000 0 25 50 75 100 125 150 175 200 225 4,020 4,073 4,003 3,853 3,653 3,285 2,829 1,681 955 2,305 90%
Performance to Power Ratio
Average Active Power (W)
80% 70% 60% 50% 40% 30% 20% 10%
fig 2.2
734 overall ssj_ops/watt 0 50 100 150 200 250Performance to Power Ratio
Average Active Power (W) 1,214 1,135 1,049 951 854 738 620 335 175 484 Active Idle 100% 0 250 500 750 1,000 1,250 90% 80% 70% 60% 50% 40% 30% 20% 10% Ta rg et L o ad Ta rg et L o ad Active Idle 100% 0 1,000 3,197 overall ssj_ops/watt 2,000 3,000 4,000 0 25 50 75 100 125 150 175 200 225 4,020 4,073 4,003 3,853 3,653 3,285 2,829 1,681 955 2,305 90%
Performance to Power Ratio
Average Active Power (W)
80% 70% 60% 50% 40% 30% 20% 10%
fig 2.2
734 overall ssj_ops/watt 0 50 100 150 200 250Performance to Power Ratio
Average Active Power (W) 1,214 1,135 1,049 951 854 738 620 335 175 484 Active Idle 100% 0 250 500 750 1,000 1,250 90% 80% 70% 60% 50% 40% 30% 20% 10% Ta rg et L o ad Ta rg et L o ad
components. Different types of server workloads set different requirements regarding hardware performance that should be considered for effi-cient hardware configuration. A rough indication of hardware performance requirements for differ-ent workloads is given in Table 2.3.
2.1.2 Power supply efficiency
The Energy Star program for servers [1] has set requirements for power supply efficiency defining levels for 10%, 20%, 50% and 100% load. The 80 PLUS Certification Scheme [3] also provides energy efficiency requirements for server power supplies but excludes the 10%-load level. For practical pur-poses and procurement, it is re commended to or-der power supplies that meet at least the 80 PLUS Gold level, which corresponds to 88% efficiency at 20% load and 92% efficiency at 50% load. Standard rack servers commonly operated at low loads are often equipped with over-provisioned redundant power supplies. This results in
signifi-Tab. 2.4Efficiency requirements for power supplies in the Energy Star programme and the 80 PLUS initiative [1, 3] Tab. 2.3Performance requirements of different server applications[5]
Category CPU RAM Hard disks IO
File/print server 0 + ++ + Mail server + + ++ 0 Virtualization server ++ +++ ++ ++ Web server + + 0 + Database server ++ ++ +++ + Application server ++ ++ 0 + Terminal server ++ ++ + +
Power Supply Type Rated Output
Power
10% Load 20% Load 50% Load 100% Load Energy Star Vs1 Multi-output (AC-DC & DC-DC) All Output Levels N/A 82% 85% 82%
Single-output (AC-DC & DC-DC) ≤ 500 W 70% 82% 89% 85%
>500–1,000 W 75% 85% 89% 85%
> 1,000 W 80% 88% 92% 88%
Energy Star Vs2 Draft Multi-output (AC-DC & DC-DC) All Output Levels N/A 85% 88% 85% Single-output (AV-DC & DC-DC) All Output Levels 80% 88% 92% 88%
80 PLUS Bronze All Output Levels N/A 81% 85% 81%
Silver All Output Levels N/A 85% 89% 85%
Gold All Output Levels N/A 88% 92% 88%
Platinum All Output Levels N/A 90% 94% 91%
cant energy losses due to a very low operating point of the equipment. Thus right sizing of power supplies is essential. It is supported for example by online power configuration tools offered by manufacturers and by tools for power capping assessment.
Some manufacturers (e.g. HP ProLiant G6 and G7 server series) provide specific hardware features to overcome unnecessary losses for redundant power
supplies. Such hardware offers an operation mode that allows use of only one power supply un-til load exceeds a certain threshold. The second power supply stays in standby maintaining redun-dancy. This mode provides full power redundancy in case of a power supply or circuit failure.
2.2 Power management at rack
to data centre level
Going beyond hardware components and single server units, power management at the system level is also important to optimize overall energy efficiency.
As indicated above, the majority of servers are still utilised at modest workloads, thus there is large potential for energy savings to be achieved by hardware consolidation (see next chapter) or by power management at system level. As for the component level, power management at higher levels adjusts performance and power draw to the actual demand and powers off or throttles re-sources if not needed. Table 2.5 shows the various approaches of power management at different levels [7]. Some of the options are addressed in the following sections and in later chapters.
2.2.1 Capacity planning and energy management
Server management software provides essential tools for secure server operation but also for holis-tic power management. Server management tools can effectively help to reduce energy consumption as they facilitate the implementation of energy policies throughout the server system and provide features like provisioning, monitoring and con-figuration management that can strongly support system efficiency. Major features commonly are:
•
provisioning•
monitoring•
deployment•
configuration management•
update control•
power management•
workload managementAll larger hardware suppliers offer powerful server management tools. IBM (Systems Director) and HP (Systems Insight Manager including Insight Dynamics) offer very comprehensive manage-ment solutions capable of integrating third party systems. Fujitsu (Server View Site) offers products with basic functionalities that can be integrated in established management consoles from other suppliers. DELL is using the Altiris Total Manage-ment Suite. Sun and Acer provide consoles for their own environments.
Energy Management Suites (e.g. IBM Energy Manager)
Among many other features, this type of tool supports monitoring and collecting power con-sumption data, managing power including setting power savings options and power caps as well as automating power-related tasks. The latter include configuration of metering devices such as PDUs and sensors, setting thresholds, creating and set-ting power policies, calculaset-ting energy costs. For further information on energy management suites, see below.
Tab. 2.5.Power management options from component to data centre level [7]
Component Level System Level Rack Level Data centre Level
• CPU (Package/core C-states, P-states, T-states, Thermal throttle) • Other components (D-states, L-states)
• S-states
• Platform-based power management • Workload schedulers
• Fan speed control
• System or node management • Application/load balancing • Chassis management
• Application/load balancing • Facilities and equipment monitors • Data de-duplication, etc.
• Multi-rack management, dynamic consolidation
Capacity planning tools
(e.g. HP Capacity Planner)
Capacity planners, among other features, support IT managers with increasing server utilisation, reducing energy consumption and enhancing ap-plication performance. They allow collection of uti-lisation data for CPU cores, memory, network, disk I/O and power. Furthermore, they support work-load planning or system changes and assessment of impact on resource utilisation. They also evalu-ate trends to forecast resource needs. For further information on capacity planning tools, see below.
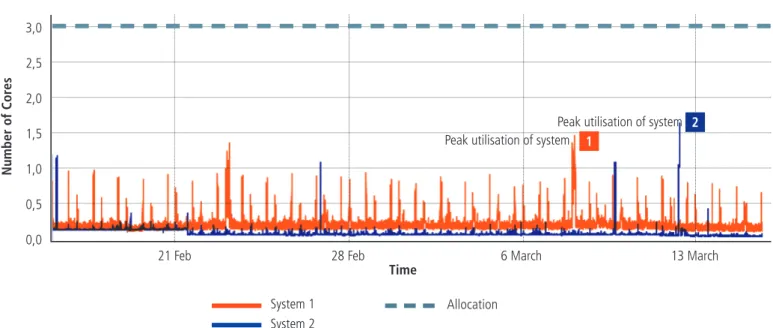
Based on utilisation logs, the HP tool for exam-ple provides a good decision basis for consolida-tion measures by assessing the resource demand for merged applications. Figure 2.3 shows the example of a comparison of the utilisation of two systems indicating that peak performance is occurring at different times and the average load would increase only modestly in case of hardware consolidation.
Fig. 2.3Comparison of CPU utilisation for “system 1” and “system 2” (see HP Capacity Planner) 3,0 2,5 2,0 1,5 1,0 0,5 0,0
21 Feb 28 Feb 6 March
System 1 System 2 Number of Cor es Allocation Time 2 1 13 March Peak utilisation of system
2.2.2 Power capping
Active allocation of power budgets to servers is also known as power capping. IT managers can specify power caps for servers according to real power requirements. Dynamic power capping re-duces the maximum power demand of the system and thus optimises power provisioning beyond the level typically supported by power configurators offered by manufacturers.
The concrete savings achieved in practice depend on the level of the cap. The caps should be set in a way that power peaks are capped but comput-ing performance is not visibly affected. Optimised
2.3 Specific power
manage-ment options for blade servers
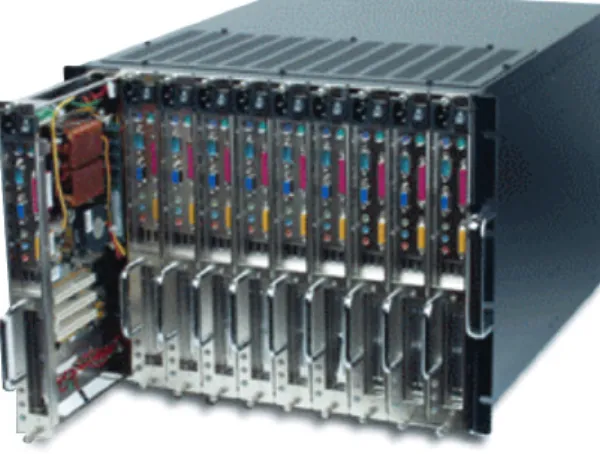
Blade server technology is deployed both in data centres and server rooms. The blade server market has been the fastest growing market segment in the last few years and it is therefore important that the technology is as energy efficient as possible. Blade chassis (see Figure 2.4.) typically include 7, 14 or more blade server modules, one or more management modules as well as KVM interfaces. Chassis support server-, storage- and network modules and may be optimised for specific ap-plications and user types. Compared to standard rack servers, blade technology allows a reduction of some hardware components like power sup-plies, network I/O and wiring which are shared by several servers in the common enclosure. Major benefits of blade systems are:•
High computing density and low space demand•
Reduced time for maintenance and upgradeof the system due to hot-plug replacement of modules and integrated management features
•
Slightly higher energy efficiency as compared torack servers if power management and cooling is optimised
RECOMMENDATIONS FOR BEST PRACTICE
Energy efficient DC planning and management• Use server management tools for capacity planning, workload and power monitoring and specific
power management. Detailed descriptions and recommendations on use of power management features are supplied with the technical documentation of the server management suites.• Use application and load balancing to optimise use of hardware resources.
• Use power capping to keep power demand at desired levels for the whole system.
• Benefit from optimised IT hardware resilience levels. Evaluate the level of hardware resilience
actu-ally justified in view of expected business impact of service incidents for each deployed service.• Decommission unused services and completely remove the hardware. Assess the options for
de-commissioning low business value services by identification of those services which do not justify the financial and environmental cost.
capping requires an assessment of the workload and power consumption pattern. For relatively uniform workloads, caps can be set at average server load without significantly affecting perfor-mance. As a rule of thumb, caps should not be set lower than about midway between minimum and maximum power consumption of the servers. Some management tools also provide the option of time dependent specification of capping that defines different caps for different periods in the day depending on load pattern, power costs etc.
However, if high blade densities are implemented, this results in high demand for infrastructure and cooling. High computing density increases power densities to 10–25 kW/rack. Consequently, stand-ard cooling in data centres and server rooms is often not sufficient and specific cooling concepts are required. Thus energy efficiency of a blade con-cept also strongly depends on the overall system design.
Dual-node and multi-node concepts are partly based on a similar philosophy as blade servers. In the multi-node concept, a fixed number of server units (commonly 2 or 4) is combined in one rack-mounted chassis. Similar to blades, the servers share powersupplies and fans, however there are few expansion options. Thus multi-node technol-ogy is an approach to implement higher comput-ing density at comparably low cost, often designed for purposes of small and medium enterprises. However, there are also special high performance dual-node servers available for example for blade systems which combine two server nodes in one blade. The main benefits of standard dual and multi-node systems are:
•
Lower cost and space demand as compared to standard rack servers•
Slightly lower energy consumption due to shared power supplies and fansRECOMMENDATIONS FOR BEST PRACTICE
Selection of blade technology based on clear decision criteria• Define and assess the main reasons for implementing blade technology in
the data centre, e.g. space restrictions.
• Assess the benefits that are expected in comparison to rack technology
and check if expectations are realistic.• Check if virtualization may be an alternative solution considering the
defined objectives.• Evaluate the expected Total Cost of Ownership (TCO) and energy efficiency
compared to other options (based on information provided by suppliers).Fig. 2.6 Blade power supply efficiency [3]
2.3.1 Blade chassis and blade components
Larger power supplies are often more efficient, thus a lower number of larger power supplies in blade systems can increase energy efficiency compared to rack servers. However efficiency in practice also depends on the power demand in relation to the power supply capacity. Figure 2.6 shows the efficiency curve of a platinum labelled power supply [3] of 2,990 W rated power for a blade chassis indicating efficiencies between 92% and 95% across the load range. Efficient power supplies for blades should reach energy efficiency levels above 90% between 20% and 100% load.
For new product generations of blade and multi-node servers, some manufacturers provide several power supply models with different rated power that allow right-sizing according to the power de-mand. Power supply selection is supported by on-line power configurators offered by manufacturers. Fewer and more efficient power supplies, more efficient fans and extended energy management options in the blade chassis offer higher energy efficiency as compared to standard rack servers in principal. However, efficiency in practice strongly
0% 25% 50% 75% 100% 125%
Efficiency of the Power Supply
Loading (% of Rated Output Power)
70% 80% 90% 100% 60% 50% 40% 30% Ef fi ci en cy ( % )
fig 3.7
depends on the configuration of the chassis as well as on the use of the power management options. Chassis configured with only a few blades will clearly be less efficient, due to over-provision-ing of coolover-provision-ing, power and network capacity. For approximate comparison of the energy efficiency of blade servers versus standard rack servers, a fully configured blade system may be considered. Such a rough comparison based on energy efficiency data published by Dell is shown in Figure 2.7. Dell has published SPECpower-data (SPECpower_ssj2008) for blade systems and com-parable rack servers in 2010 (www.spec.org). The SPEC results show a maximum performance of 3,885 ops/watt at 100% load for the blade system and 3,739 ops/watt for the rack server system,
ample compared to virtualization. Similar to rack servers, there is also the option to combine blade hardware with virtualization, which allows for strong improvement of energy efficiency. Challenges related to high heat densities at rack and row level are addressed in section 2.3.2 below.
Modern blade chassis contain management hard-ware and softhard-ware that in combination with re-mote access controllers in the server blades allow a power inventory and power management of the individual blades. Specific management cards sup-port a hardware and power demand inventory of the different blades. The remote access controller communicates the power budget information to the chassis management card that confirms the availability of power from the system level, based indicating that the performance per watt or the
energy efficiency at maximum load is 4% better in the blade system than in the rack solution. The dif-ference increases to about 8% for low loads (10% load) and to 11% for idle operation.
Although this simple comparison must not be over interpreted (as SPECpower does only assess part of the server efficiency), it suggests that blade systems, even if fully configured and optimised for testing, show only slightly better energy efficiency than standard rack servers, especially at high loads. The difference is more significant at low load levels indicating a better overall power man-agement in the blade system at low load. Thus, blade solutions seem to offer only limited potential for increasing energy efficiency for
ex-100% 0 1,000 2,000 3,000 4,000 3,885 3,911 3,873 3,733 3,502 3,158 2,754 1,653 940 2,255 3,739 3,725 3,697 3,572 3,337 2,999 2,623 1,549 868 2,125 90% 80% 70% 60% 50% 40% 30% 20% 10% Active Idle Active Idle
3,093 overall ssj_ops/watt 2,938 overall ssj_ops/watt
0 1,000 2,000 3,000 4,000
Performance to Power Ratio Performance to Power Ratio
Average Active Power (W) Average Active Power (W)
100% 0 0 25 50 75 100 125 150 175 200 225 250 1,000 2,000 3,000 4,000 90% 80% 70% 60% 50% 40% 30% 20% 10% Ta rg et L o ad Ta rg et L o ad
fig 3.8
Fig. 2.7SPECpower_ssj2008 for a Dell M610 Blade server and R610 1U rack server. The blade system includes 16 blades with identical processor configuration as the rack server (2 x Intel Xeon 5670, 2.93GHz). SPEC (2010, www.spec.org)
upon a total chassis power inventory. The CMC can set power policies at the system level and actual power consumption at each server module is monitored ensuring that instantaneous power consumption does not exceed the budgeted amount.
The basic functions of the power management in automatic mode are normally not visible for the system administrator. However, priorities for each server module can also be set manually, for exam-ple by selecting the lowest priority blades as the first to enter any power saving mode.
In blade chassis, dynamic power capping can be used even more effectively than for standard rack servers, since the dynamic power cap can be speci-fied across multiple servers. Power caps can be dy-namically adjusted by the onboard administrator and the service processor. Blades running lighter workloads receive lower caps. Since workload intensity and dynamics are normally different for the different blades, power peaks occur at differ-ent times. Consequdiffer-ently, the overall cap for the chassis can be set lower compared to the sum of individual caps for single blades. HP has calculated power savings and reduced TCO for a blade centre where power supply design was based on power capping. Maximum power and power provisioning cost was reduced by about 20% as compared to the approach without power capping [HP2011].
2.3.2 Blade system – power and cooling issues
In practice, design of efficient blade server systems is often an underestimated challenge, especially if large high-density systems are implemented. The main challenges are:
•
Sufficient cooling capacity and appropriate cooling design to cope with high heat densities•
Sufficient power capacity and distribution (localPDU capacity, power wiring etc.)
Traditional cooling concepts often allow only 2-3kW/rack, which is 10 times less than the power of a fully populated blade rack. This means that standard cooling concepts of data centres and server rooms are often not appropriate for larger blade systems and have to be modified.
RECOMMENDATIONS FOR
BEST PRACTICE
Consider procurement criteria for selecting energy efficient blade hardware
• Define the workloads and expected workload
levels to be run on the blade systems.
• Compare costs and energy efficiency of blade
systems from different vendors.
• Request product information from suppliers
regarding.■ Total Cost of Ownership (TCO) . ■ Overall energy efficiency (e.g. SPECpower_ssj2008, SPEC-SERT as soon as available). ■ Energy efficient hardware components,
e.g. efficiency and right sizing of power supplies.
■ Management tools especially addressing power management and optimization of system design.
• Select equipment offering highest energy
efficiency for the workload types and levels you are addressing and adequate power management options.RECOMMENDATIONS FOR BEST PRACTICE
Use of management tools to optimize energy efficiency of blade systems• Use management tools and intelligent network and power devices for monitoring of power
con-sumption and load for your blade system.• Analyse options to balance and manage loads and power consumption within and across blade
chassis and racks.• Use power capping and power balancing features of blade chassis.
• Do a first order estimation on power/cooling capacity demand based on power calculators offered
by manufacturers.• Assess real power demand with available management tools for complete duty cycles and set
pow-er caps according to peak load. Adjust powpow-er and cooling to fine-tune system based on powpow-er caps.Table 2.6 shows typical options for the design of different blade densities depending on business requirements and constraints such as infrastruc-ture and cooling capacity. Different blade density levels allow the following options for cooling con-cepts [Rasmussen 2010]:
•
Spreading the heat load of blade chassis to different racks: Individual blade chassis are mounted to different racks to spread heat load. For this concept, the percentage of blade chas-sis in the total system has to be very low.•
Dedicating cooling capacity: Excess coolingcapacity is specifically dedicated to the blades. For this approach the percentage of blades in the system has to be relatively low, as only the existing cooling capacity is used.
•
Installing supplemental cooling: Supple mental cooling is provided for the blade racks. Power density per rack can be up to 10kW. The approach allows for good floor space utilisation and high efficiency.infrastructure and cooling. Density specification should take into account both spatial and tempo-ral variability, e.g. different local power densities in data centres regarding blade racks and standard racks and variation over time where density may increase. Thus, power density has to be specified either at rack or at row level. For larger systems the row level is more appropriate, since cooling and power distribution is mainly row-based. As far as possible, it is recommended that density specifications are defined for a rack or row. They should be left unchanged for the time of operation of the specific rack or row. Thus, implementation of a new technology with different density level should be done in a new rack or row. However, there are also alternatives to this approach allow-ing some variation of power densities in installed racks or rows:
•
Adding hot pluggable UPS modules•
Using hot swappable rack PDUs•
Adding cooling capacity with rack-mounted devices•
Definition/design of high-density area: Specific area in the data centre is dedicated to blades (high density row or zone). High efficiency and high floor space utilisation. Density up to 25kW. Area has to be planned and re-designed.•
Design of high density centre: High densityblade racks throughout the data centre. An ex-treme and rather uncommon approach, which for most situations leads to significant costs and strong underutilisation of infrastructure. In existing data centres, there are often certain limits for the deployment of blade technology de-fined by the specific infrastructure. For example, a standard raised floor system may not allow a higher power density than 5kW per rack. Proper specification of power and heat density is an im-portant prerequisite to allow energy-, space- and cost-efficient system design.
Another essential point regarding energy effi ciency at the system level is to avoid over-provisioning of
Tab. 2.6Configuration of blade systems at rack level and related requirements for cooling [after Rasmussen 2010]
No Chassis/rack
Spreading load
across racks Dedicating cooling capacity
Additional cooling High density area High density centre
1 Possible in most DCs Possible in most DCs Possible in most DCs Not cost efficient Not cost efficient 2 Rarely practical Possible in most DCs Possible in most DCs Not cost efficient Not cost efficient 3 Not possible Possible in most DCs Possible in most DCs
depending on specific solution
Maximum for optimised efficient raised floor systems
Not cost efficient
4 Not possible Rarely practical Depending on specific solution
Hot air scavenging systems
Hot air scavenging, room redesign
5 Not possible Not possible Not possible Hot air scavenging
systems
Hot air scavenging, room redesign
2.4 Server virtualization
Server virtualization offers great potential for energy savings. The technology allows for the con-solidation of workloads on less physical hardware, thereby strongly reducing power and cooling de-mand. Overall virtualization offers a number of advantages for the effective design of IT systems in server rooms and data centres , as for example:
•
Reduction of hardware and space requirements via deployment of virtual machines (VMs) that can be run safely on shared hardware, increas-ing server utilisation from 5–15% to 60–80%.•
Test and Development Optimisation – Rapidlyprovisioning test and development servers by reusing pre-configured systems enhancing de-veloper collaboration and standardizing devel-opment environments.
•
Reducing the cost and complexity of business continuity (high availability and disaster recov-ery solutions) by encapsulating entire systems into single files that can be replicated and re-stored on any target server.Established virtualization platforms like VM-Ware, Microsoft Hyper-V and Citrix XEN offer many features like high availability, failover, dis-tributed resource scheduling, load balancing, automated backup functions, distributed power management, server-, storage- and network VMotion etc.
The primary technology options for server virtual-ization include:
•
Physical partitioning•
Virtualization based on an underlying operating system•
Application virtualization e.g. Microsoft Termi-nalserver, Citrix XenApp•
Hypervisor-based virtualization:■ VMware ESX
■ Citrix /Open-Source: XENServer 5
■ Microsoft Hyper-V
Considering the market which is dominated by only a few products, the following chapter focuses on the hypervisor-based products: VMware ESX, Microsoft Hyper-V and Citrix XEN Server. The market leading virtualization platforms VM-Ware ESX/ESXi/Vsphere4, Microsoft HyperV and Citrix XEN offer support for most common stand-ard guest operating systems. They provide man-agement consoles for administration of smaller server environments as well as data centre level administration.
VMware was the first product on the market in 2001. Its architecture predates virtualization-aware operating systems and processors such as Intel VT and AMD-V. VMware ESX/VSphere4 offers powerful administration tools like VMotion of virtual machines across servers, storage VMotion, storage overprovisioning, desktop and network virtualization, virtual security technology, and it delivers a complete virtualization platform from desktop through data centre up to cloud computing.
Microsoft Hyper-V Server contains the Windows Hypervisor, Windows Server driver model and vir-tualization components. It provides a small foot-print and minimal overhead. It plugs into existing IT environments, leveraging existing patching, provisioning, management, support tools, and processes. Some of the key features in Microsoft Hyper-V Server 2008 R2 are live migration, cluster shared volume support and expanded processor and memory support for host systems. Live migra-tion is integrated with Windows Server 2008® R2 Hyper-V™. Hyper-V™ live migration can move running virtual machines without downtime. Depending on user requirements, Citrix XENServer may offer a cost effective way of implementing virtualization, since basic elements like the bare hypervisor, resilient distributed management ar-For the definition of densities for rows, it has been
recommended to define a maximum ratio of peak to average power of 2 for typical row designs. Where double average power is exceeded by spe-cific racks, IT loads should be redistributed within the row or to other rows. Overall, it obviously makes sense to distribute higher density racks in the row. Power and cooling management systems can be used to define rules for deploying installed capacities e.g. allowing a rack to exceed average power only if the power demand of a neighbour rack is significantly below average.
An important issue is how to deal with future de-velopments regarding future needs for IT exten-sion. It is clearly not advisable to implement infra-structure covering maximum future capacity from the beginning, as this would mean over-capacity and high costs over a longer period of time. It is generally recommended to install all piping and wiring for full expansion of capacity but to install the power and cooling equipment at later stages based on specific demand. This approach allows to prepare all the basic infrastructure of the building but to implement the specific equipment accord-ing to power and coolaccord-ing demand of the IT when needed.
chitecture, XENServer management and conver-sion tools come for free. Advanced management and automation features like virtual provisioning services, distributed virtual switching, XENMotion, live migration, live memory snapshots and revert, performance reporting and dynamic workload balancing make the XENServer comparable to the other two products. However, these features are part of the advanced commercial editions. BMC Software, Eucalyptus Systems, HP, IBM, Intel, Red Hat, Inc. and SUSE announced the formation of an Open Virtualization Alliance, a consortium committed to fostering the adoption of open vir-tualization technologies including Kernel-based Virtual Machine (KVM). The consortium comple-ments the existing open source communities managing the development of the KVM hypervisor and associated management capabilities, which are rapidly driving technology innovations for customers virtualizing both Linux and Windows® applications. The consortium intends to accelerate the expansion of third party solutions around KVM and will provide technical advice and examples of best practice.
2.4.1 Energy saving potential of virtualization
Virtualization is one of the most powerful technol-ogies for reducing energy demand in data centres and server rooms. Consolidation of server hard-ware by concentrating workload on a lower num-ber of physical servers often allows energy savings of 40% to 80% and sometimes more, depending on the specific case. Current technology provides the possibility to implement virtualization with consolidation factors of at least 10–20, depending on the specific systems and requirements. Figure 2.8 shows the example of a server con - soli dation by virtualization in the German Federal Ministry for the Environment. The specific meas-ures allowed energy savings of about 68%. The
case involved a reduction of hardware to 2 physi-cal servers running VMware ESX [4].
Another example from IBM [5] for a virtualization project involving blade server technology suggests energy savings of more than 90% if all relevant measures at hardware and infrastructure level are considered.
Such examples illustrate that consolidation by virtualization is one of the major options to signifi-cantly increase energy efficiency in data centres. However, as for the other IT based approaches the full saving potential can only be accessed if the infrastructure including power supply and cooling is addressed in parallel.
Reduction of energy demand by virtualization in a case study [4] 5000 Old New 4500 4000 3500 3000 2500 2000 1500 1000 500 0 Po w er [ W at t] ESX1 Server NSeries Controler NSeries Storage IT NSeries FC Switch Access Control Intranet Help Desk Inventory Server Software Packaging Logging Server Certificate Server VMware2 Help Line Novatime System Monitoring Terminal Server CMF IT Controlling
4 Rack Fan & KVM 4 Rack Monitor Conference Proxy Exchange FE Exchange Exchange Office DC Office DC Root DC SMS SPS MS SQL File Server SAN-Enclosure VMware1
fig 3.9
2.4.2 Requirements and tools for virtualization planning
Virtualization in data centres should be based on a virtualization strategy that involves an evalua-tion and identificaevalua-tion of appropriate server can-didates.
For such an evaluation, data on performance, system utilisation, end-of-service timelines, busi-ness area and application specification is col-lected. Once the candidates for virtualization have been identified, application specifications and machine load are analysed. Performance evalu-ation is conducted to assess among others the following requirements as a basis for hardware selection:
•
CPU performance•
Required memory•
Disk I/O intensity•
Network requirements•
OS configurationSeveral applications can typically be consolidated to a single physical server, which is immune to hardware failure and power interruptions while possessing the ability to load-balance. To achieve this goal, host servers may contain dual power supplies, mirrored hard drives and teamed network interface cards. For a centralized storage solution, a Storage Area Network (SAN) with full fault- tolerant capabilities can be used. Load balancing can further be supported by virtual machine migration between physical servers.
Depending on the type of workloads, a consoli-dation ratio between 10:1 and 20:1 can be con-sidered. Regarding memory requirements, many virtualization environments offer the feature of memory over provisioning. By means of this feature the sum of memory allocated to all virtual machines can exceed the available physical mem-ory by a factor of 2 to 3.
Virtualization is rarely done for energy saving pur-poses only. Thus although high energy savings are normally guaranteed, successful virtualization pro-jects typically require thorough planning, which also involves ROI and TCO calculations.
Summing up the relevant cost factors, the TCO for the new virtual server deployment is calculated. A short-term and long-term ROI calculation can be done to assess time-related costs.
The key to successful ROI calculation is to under-stand virtualization costs. The obvious expenses for virtualization projects are hardware, software (incl. licensing) and labour. Virtualization may in-volve buying of new, more powerful servers, up-grade of storage, network and security etc. Costs for staff training and management are an addi-tional issue. All these aspects have to be factured into the ROI calculation.
Different software tools available on the market support virtualization planning as well as ROI and TCO calculation. For example, the Assessment and Planning (MAP) Toolkit from Microsoft sup-ports planning for migration including TCO and ROI calculation. The MAP-Toolkit is an inventory, assessment, and reporting tool that can assess IT environments for various platform migrations and virtualization without the use of software agents. MAP’s inventory and readiness assessment
ports generate specific upgrade recommendations for migration to Windows Vista and Windows Server 2008 operating systems and also for vir-tualization. It provides recommendations on how physical servers can be consolidated in a Micro-soft Hyper-V virtualized environment. In addition the Microsoft Integrated Virtualization ROI Tool supports the calculation of potential power cost savings with Hyper-V prior to deployment. The tool provides support for examining current production and development servers, desktop and application virtualization opportunities by quantifying poten-tial savings, service level benefits, investments and ROI.
The TCO/ROI methodology offered by VMware (available as an online tool) allows to compare TCO savings, required investments and business benefits of virtualization solutions. It is based on standard financial techniques, VMware field and customer data and user metrics. Based on user-specific data, key figures like savings, investments, ROI, NPV savings, TCO opportunities and payback periods are calculated. Where specific user data is not available, statistical data from industry is pro-vided and may be used for calculations.
2.4.3 Power management in virtualized environments – virtual server migration
Current software solutions for server virtualization support the migration of virtual machines and a temporary shut-down of hosts to reduce power demand. One example providing such features is VMwareVsphere4 (Distributed Power Manage-ment DPM). DPM monitors the resource use of the running virtual machines in the cluster. If there is excess capacity, DPM recommends to move some virtual machines between hosts and to put some hosts into standby mode to save power. In case of insufficient capacity, DPM powers on standby hosts again.
Power management can be operated in either manual or automatic mode. In automatic mode virtual machines are migrated and hosts are moved into or out of standby mode automatically. Automatic settings can be overridden on a per-host basis and power management can also be enabled by a scheduled task.
The goal of VMware DPM is to keep the utilisation of ESX hosts in the cluster within a target range. DPM must meet the following requirements to be an effective power saving solution:
•
Accurate assessment of workload resource de-mands. Overestimating can lead to less than ideal power savings. Underestimating can re-sult in poor performance and violations of DRS resource level SLAs.•
Avoiding powering servers on and off too fre-quently even if running workloads are highly variable.•
Rapid reaction to sudden increase in workload demands so that performance is not sacrificed when saving power.•
Selection of the appropriate hosts to power on or off. Powering off a larger host with numer-ous virtual machines might violate the target utilisation range on one or more smaller hosts. • Redistribution of virtual machines intelligentlyafter hosts are powered on and off by seam-lessly leveraging DRS.
RECOMMENDATIONS FOR BEST PRACTICE
Effectively assessing and selecting virtualization solutions:• Develop a virtualization strategy and assess servers to select good candidates for virtualization.
• Assess requirements regarding CPU performance, memory, Disk I/O intensity, Network requirements,
OS configuration.
• Consider the appropriate virtualization ratio and mix of workloads (1:6 to 1:20 depending on
work-load characteristics).• Check products from different suppliers regarding required features for your specific purposes;
con-sider licensing policies, power management features and price. The different main products on the market have different advantages depending on the specific application needs.• Do TCO and ROI calculations to identify the benefits of reduced cost for power supply and cooling.
Models provided by suppliers shall be refined according to the needs of the specific organisation.• Consider power management options allowing VM migration and temporary shut-down of server
hardware.
• Consider changed requirements for cooling and power supply (reduced and dynamically changing
power and cooling demand) and check options of some redesign for cooling.The basic way to use DPM is to power on and shut down ESX hosts based on typical utilisation patterns during a workday or week. For example, services such as email, fax, intranet, and database queries are used more intensively during typical business hours from 9 a.m. to 5 p.m. At other times, utilisation levels can dip considerably, leav-ing most of the hosts underutilised. Their main work during these off hours might be performing backup, archiving, servicing overseas requests etc. In this case consolidating virtual machines and shutting down unneeded hosts reduces power consumption.
The following approaches may be used to manu-ally adjust DPM activity:
•
Increasing the Demand-Capacity-Ratio Target: to save more power by increasing host utilisa-tion (consolidating more virtual machines onto few hosts) the value for the Demand-Capacity-RatioTarget could be increased from default (e.g. from 63% to 70%).•
Using VMware DPM to force the powering on of all hosts before business hours and then selec-tively shut down hosts after the peak workload period. This is a more proactive approach that would avoid any performance impact of waiting for VMware DPM to power on hosts in response to sudden spikes in workload demand. Each ESX host’s resource utilisation is calculated as demand/capacity for each resource (CPU and memory) where demand is the total amount of the resource needed by the virtual machines currently running and capacity is the total amount of the re-source currently available on the host. Thus power management of hosts is executed depending on CPU and host’s memory resource utilisation com-pared to the defined utilisation range. For each host evaluated for a power-off recommendation DPM compares costs, taking into account an es-timate of the associated risks with a conservative projection of the power-savings benefit that can be obtained.2.4.4 Cooling and infrastructure for virtu-alized systems
While significantly reducing overall power de-mand, virtualization especially in larger systems may cause increased rack power density. Power management by migration of virtual machines furthermore leads to dynamic spatial change of power and heat density, thus locally increasing the demand for power and cooling. Appropriate power and cooling concepts have to be used to meet the demand of virtualized environments and to avoid hot spots.
If the total power and cooling capacity is not adapted to the lower power demand, PUE will worsen after virtualization. Virtualization can reduce cooling load in a data centre to very low levels which can cause negative effects. Thus right- sized power and cooling is crucial for exploiting energy saving potentials. It is also essential to reduce fixed losses by considering the following measures:
•
Scaling down power and cooling capacity to match the load•
VFD fans and inverter pumps that are controlled by cooling demand•
Using equipment with higher efficiency•
Cooling architecture involving shorter air paths(e.g. row based)
•
Capacity management system to adopt capacity to demand•
Blanking panels to reduce in-rack air mixingHeat density before and after virtualization [5]
Migrating high-density loads > Unpredictable cooling Constant loads > Stable cooling
In a conventional environment involving tradi-tional raised floor, room-based cooling can be configured to adequately cool hot spots by rear-ranging vented floor tiles. Changing requirements due to the dynamic migration of virtual servers, however, also require dynamic cooling solutions. A solution to this challenge is to position cooling units within the rows and get them equipped to sense and respond to temperature changes. Plac-ing coolPlac-ing units close to the servers allow short air paths between cooling and the load. Dynamic power variation in virtualized environments is a major reason for moving towards row- or rack- based cooling.
RECOMMENDATIONS FOR BEST PRACTICE
Energy efficient management of virtualized systems:• Implement a strict policy for implementing and managing virtualised servers. Avoid uncontrolled
server sprawl.• Use virtual machine migration tools to shut down hardware at times of low loads. Use automatic
power management settings for the start and develop own customised settings in a subsequent stage based on the typical operation patterns.• Reduce cooling according to demand and implement equipment for dynamic local cooling if
needed. Address the demand for dynamic spatial changes.• Adapt IT processes and workflows regarding deployment of virtual machines, data recovery/
backup processes, patch administration, availability considerations.Accurate information about demand for power and cooling capacities is crucial in order to re-spond to changing load profiles over time. Capac-ity management provides instrumentation for real time monitoring and analysis of power-, cooling- and physical space capacities and enables the ef-fective and efficient use throughout the data cen-tre. Areas of available or dangerously low capacity can be identified. Capacity management systems should be able to handle the following issues:
•
Change of load density and location –Virtual-ization can create hotspots e.g. by VM migra-tion.
•
Dynamic system changes – Maintaining system stability may become a challenge if multiple parties are making changes without centralized coordination.•
Interdependencies – Virtualization makes the shared dependencies and secondary effects in the relationship between power, cooling and space capabilities more complex.•
Lean provisioning of power and cooling – During virtualization the power and cooling load goes down and rises again as new virtual machines are created. This can be handled by usage of scalable power and cooling systems.Further reading
HP (2011): HP Power capping and HP Dynamic power capping for ProLiant servers. Hewlett Packard Development company.
SPEC (2011): Server Efficiency Rating Tool (SERT) TM Design Document. 3rd draft. Standard Perfor-mance Evaluation Cooperation
Rasmussen, N. (2010): Strategies for deploying blade servers in existing data centres. White paper 125. APC Schneider Electric
80 PLUS (2011): 80 PLUS power supplies. www.plugloadsolutions.com
Schäppi B. et al (2009) Energy and cost savings by energy efficient servers. IEE E-Server best prac-tice cases. Brochure 2009
IBM (2011) Server Management suite, Module Active Energy Manager
www-03.ibm.com/systems/software/director/aem/ HP (2011) Server managment suite «Systems In-sight Manager» www.hp.com
VMware DPM: Information Guide: VMware Dis-tributed Power Management Concepts and Use. www.vmware.com
VMware TCO: VMware ROI TCO Calculator, Overview and Analysis.
http://roitco.vmware.com/vmw/
References
[1] EPA (2010): Energy Star ENERGY STAR® Program Requirements for Computer Servers (vers 1.1)
[2] SPEC (2010): SPEC power and performance. Benchmark methodology 2.0. Standard Perfor-mance Evaluation Cooperation
[3] 80 PLUS (2011): 80 PLUS power supplies. www.plugloadsolutions.com
[4] Schäppi B. et al (2009): Energy and cost savings by energy efficient servers. IEE E-Server best practice cases. Brochure 2009
[5] BITKOM (2010): Bitkom/Beschaffungsamt des Bundesministeriums des Innern, Leitfaden Produktneutrale Leistungsbeschreibung x86-Serv-er, 2010
[5] Comtec Power: Overcoming the Challenges of Server Virtualization. www.comtec.com
[6] VMware TCO: VMware ROI TCO Calculator, Overview and Analysis.
http://roitco.vmware.com/vmw/
[7] The Green Grid (2010): White paper Nr. 33 “A roadmap for the adoption of power-related features in servers”, Pflueger, J., et al., The Green Grid, 2010
![Fig. 1.1 Simple schematic with the key data centre subsystems [Source: ASHRAE [2]].](https://thumb-us.123doks.com/thumbv2/123dok_us/9241381.2410168/6.892.176.693.747.1149/fig-simple-schematic-data-centre-subsystems-source-ashrae.webp)


![Tab. 2.3 Performance requirements of different server applications [5]](https://thumb-us.123doks.com/thumbv2/123dok_us/9241381.2410168/13.892.61.720.803.1158/tab-performance-requirements-different-server-applications.webp)
![Tab. 2.5. Power management options from component to data centre level [7]](https://thumb-us.123doks.com/thumbv2/123dok_us/9241381.2410168/14.892.39.838.788.928/tab-power-management-options-component-data-centre-level.webp)
![Fig. 2.6 Blade power supply efficiency [3]](https://thumb-us.123doks.com/thumbv2/123dok_us/9241381.2410168/17.892.491.796.639.935/fig-blade-power-supply-efficiency.webp)
