Program Budget
INDEX
MAYOR’S INTRODUCTION 1
CHIEF EXECUTIVE OFFICER’S SUMMARY 2
BUDGET PROCESS 11
1. LINKAGE TO COUNCIL PLAN 12
2. SERVICES, INITIATIVES AND SERVICE PERFORMANCE INDICATORS 15
3. BUDGET INFLUENCES 30
4. ANALYSIS OF OPERATING BUDGET 37
5. ANALYSIS OF BUDGETED FINANCIAL POSITION 44
6. ANALYSIS OF BUDGETED CASH POSITION 47
7. ANALYSIS OF CAPITAL BUDGET 49
8. STRATEGIC RESOURCE PLAN AND KEY FINANCIAL INDICATORS 57
9. RATING STRATEGY 61
10. LONGER TERM STRATEGIES 66
OVERVIEW TO APPENDICES 68 APPENDIX A 69 APPENDIX B 82 APPENDIX C 96 APPENDIX D 98 APPENDIX E 100 APPENDIX F 123 APPENDIX G 126 APPENDIX H 129 APPENDIX I 136 APPENDIX J 141 APPENDIX K 143
MAYOR’S INTRODUCTION
The 2015/16 budget is the third budget of this Council term and consolidates Council’s financial position with the lowest rate rise in nine years, continued low debt and operating costs maintained at current levels.
The budget focuses on achieving the Council’s vision, Campaspe – a vibrant place to live, grow and visit, with a thriving, diverse and healthy lifestyle.
The budget is in line with the 15-year long term financial plan whilst remaining firmly focused on the short and medium term needs of our community and responding appropriately to key pressures and challenges.
Community feedback on affordability was top of mind for Council in the development of this budget, in particular a desire for lower rate increases raised by our ratepayers over the past few years. Accordingly, Councillors have been working with the organisation to identify and implement savings and efficiency initiatives. This work has achieved over $1.6 million of identified savings allowing Council to reduce the 6% rate increase set out in the long term rating strategy, down to 5%, while continuing to support the important long term objectives.
Council has been keenly focused on asset renewal since 2007, seeking to close the gap in annual funding required each year. The budget contributes a further $399,000 to this goal. However, there is still a need to address the asset renewal backlog that is forecast to grow to approximately $24 million in 10 years.
Council is mindful of the introduction of rate capping by the Victorian Government in 2016/17. Council recognises that rate capping will impact the implementation of long term financial strategies such as the asset renewal funding strategy and financial sustainability review. Council has retained its commitment to these important initiatives in this budget while recognising that in future financial years, they will need to be reviewed along with general service delivery.
Council continues its commitment to the transformation of its operations based on the implementation of new corporate information and communication technology (ICT) systems. The iNspire program, which implements Council’s adopted ICT strategy, will see the deployment of the OneCouncil solution across the organisation. This allows standardised systems and tools across operations to achieve greater efficiencies and savings. Council is also pleased that through the delivery of the iNspire program, customers will be able to access Council services through a modern online interface, at times and places that are convenient to them. These improvements will start being available to the community by the end of 2015. The large scale Capital Works program is similar to recent years, with this budget supporting the delivering of $25 million worth of works on the ground. Important road network funding from the Commonwealth Government through the Roads to Recovery program has been increased, with an additional one-off payment boosting this contribution to $4.094 million, from $2.015 million in 2014/15. This increase has been welcomed as the Victorian Government has ceased the Country Roads and Bridges program, reducing road funding to Council by $1 million compared to last year.
The budget supports a number of community initiatives, identified or informed by the 20-year strategic plan - Campaspe: Our Future, as well as the Council Plan and other strategic plans. This budget allocates funding for a number of streetscapes and amenity projects, such as the Kyabram Allan Street fountain.
Further improvements have been made to this document to continue to align with the local government model budget, a Victorian Government best practice guide, to provide the community with an improved understanding of Council’s financial management.
CR LEIGH WILSON MAYOR
CHIEF EXECUTIVE OFFICER’S SUMMARY
Council has prepared a budget for the 2015/16 year which seeks to balance the demand for services and provision of infrastructure with the community’s capacity to pay. The overview provides a quick look at the key features of the budget in terms of rate increase, operating result, service levels, cash and investments, capital works, financial position, financial sustainability and the strategic objectives of Council.
Council’s annual budget seeks to meet the needs of the upcoming year as well as supporting the pursuit of long term important priorities. In doing so, Council has in mind the ratepayers of today and the circumstances that will be inherited by ratepayers in the future.
In response to the financial challenges facing Victorian councils of the freezing of the Financial Assistance Grants for 2014/15, 2015/16 and 2016/17 by the Federal Government and the affordability concerns raised by our community, Councillors and officers commenced work in early July 2014 on savings and efficiency initiatives.
While the rigorous and constructive work undertaken by Councillors and officers in the pursuit of savings has delivered a positive result, further work needs to be done to ensure that Council can continue minimising cost increases for the community, particularly in light of the State Government’s introduction of rate capping in the 2016/17 financial year and the removal of Country Roads and Bridges program.
Accordingly, we will continue our pursuit of cost reductions and savings in the year ahead as well as vigorously reviewing Council services and the method and resources used in their delivery.
Of the 5% rate increase, half ($0.761 million) pertains to matters other than the annual increase in Council’s existing operational costs. This includes Council’s commitment to lifting its funding to meet the annual asset renewal requirement ($399,000) and meeting new mandated growth and compliance matters ($362,000). Taking these matters into account, shows our cost management is enabling Council to address these important priorities whilst keeping the impact on our ratepayers to a minimum.
Once again Council is seeking to deliver a large capital works program exceeding $25 million. This scale of delivery is similar to recent years and we are well positioned to successfully put these projects “on the ground” for our community. Council has reaffirmed its strategic direction through Campaspe: Our Future and the Council Plan. Our organisation remains focused on supporting Council in achieving its objectives. We have a strong commitment to customer service and cost management which will be critical in future years.
I thank our Councillors and Council staff for the ongoing commitment and their hard work in preparing this budget.
Rates
It is proposed that general rates increase by 5% for the 2015/16 year, raising total rates of $32.495 million. The 5% increase is lower than the previous eight years and in line with that foreshadowed in Council’s Long Term Financial Plan (LTFP) and Strategic Resource Plan. The rate increase for the 2014/15 year was 6%.
Council has also assumed an additional $100,000 to be received via supplementary rates throughout the year. Supplementary rates are receivable when new rateable land or land improvements are identified throughout the year and are not raised at the time of generating annual rate notices.
The amount of rates raised allows Council to maintain service levels and deliver a significant capital works program.
Net Result
Net Surplus/(Deficit)
The expected net result for the 2015/16 year is a surplus of $6.961 million, which is an increase of $6.803 million from the 2014/15 forecast surplus of $0.158 million. Significant external capital funding ($6.746 million for 2015/16) makes comparison at a net surplus level difficult as the amount of external funding varies year on year. The forecast adjusted underlying result (after accounting for one off items) for 2014/15 is a surplus of $0.052 million against a 2015/16 budget deficit of $1.870 million which is discussed in detail below.
Adjusted Underlying Net Result
Council is committed to achieving benefits from implementation of the ICT Strategy and ongoing Financial Sustainability Reviews (including the Rural Road Review). These benefits are anticipated to be significant and are central to Council returning to an operating surplus in the future but are not fully reflected in the above graphs. The adjusted underlying net
Recurrent EBITDA
In order to respond to increasing challenges identified within the operating result, Council has chosen to use Recurrent EBITDA (earnings before interest, tax, depreciation and amortisation) as a measure of underlying financial sustainability which better represents core operations. This approach is illustrated in Appendix A.5 (page 74) with the inclusion of a Performance Statement for Council.
Recurrent EBITDA is showing steady growth over the forward plan period. Maintaining this growth is critical to financial sustainability and is a key target in setting the budget.
Service Delivery
The net cost of services delivered to the community for the 2015/16 year is expected to be $46.071 million (refer to Section 2 for further detail). The net cost of services is the cost to Council net of user fees and grants directly linked to service delivery. The percentages shown in the graph illustrate the growth in the net cost each year. Based on the current long term financial plan assumptions, net cost to Council will continue to increase. The net cost of service delivery is funded
15,343 15,542 16,291 17,681 18,991 8,000 10,000 12,000 14,000 16,000 18,000 20,000 F2014/15 B2015/16 SRP2016/17 SRP2017/18 SRP2018/19 $0 00 's B 46,079 46,071 46,755 47,757 48,911 0 10,000 20,000 30,000 40,000 50,000 60,000 F2014/15 B2015/16 SRP2016/17 SRP2017/18 SRP2018/19 N et C os t $ m ill io n s 0 1.48% 2.14% 2.42%
Unallocated Cash
Unallocated Cash refers to the cash available at year end after all Council obligations are met. It is useful to consider Council’s Unallocated Cash position in conjunction with the expected net surplus/(deficit) which includes a number of non-cash and one off items. The position over the previous three years is illustrated above.
Council has developed the 2015/16 budget with a view to achieving a cash balanced outcome. The large variance between 2013/14 and 2014/15 is driven mainly by the changes to the Grants Commission payment received within those financial years.
Accumulated Unallocated Cash
Accumulated Unallocated Cash refers to the accumulation of prior year Unallocated Cash.
Accumulated Unallocated Cash comprises the prior year closing balance plus the forecast Unallocated Cash for the current financial year, including interest income contribution, less any progressive allocations made by Council through 2014/15.
2,693 1,070 3,158 2,449 2,201 1,783 947 760 0 1,000 2,000 3,000 4,000 5,000 A2012/13 A2013/14 F2014/15 B2015/16 $0 00 's
Cash and Investments
Cash and investments are expected to decrease by $1.471 million during the year to $24.493 million as at 30 June 2016 due to continued high level of capital works delivered.
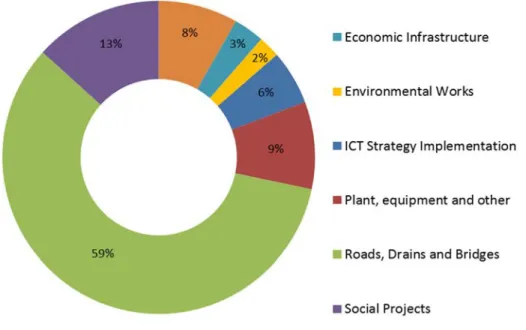
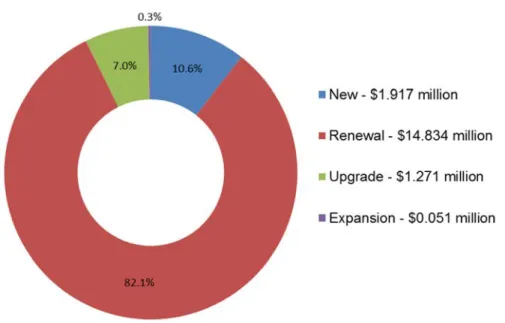
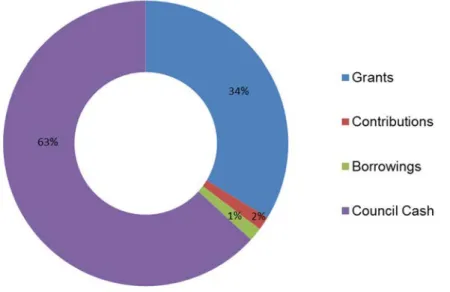
Planned Capital Works Spend
The capital works program estimated spend for the 2015/16 year is $25.072 million of which $7.355 million relates to projects commenced in the 2014/15 year. The carried forward component is fully funded from previous budgets. The planned 2015/16 expenditure represents another significant delivery program in line with the prior years.
The 2015/16 budget includes a $19.095 million commitment to works to be directly funded within Council’s Capital Works Program. Council has maintained its commitment to renewing existing assets where they support ongoing services. The 2015/16 budget includes $15.627 million of new funding allocated to asset renewal projects in accordance with Council’s Asset Renewal Funding Strategy. This includes $4.094 million in Federal Government Roads-to-Recovery funding. Council has enhanced its capital works program this year by introducing a prioritisation matrix to assess project candidates for new and upgrade works. This enhancement is in response to an internal audit recommendation.
Council’s budget and future financial planning is based on planning capital expenditure at a level that exceeds the new funds allocated to capital projects in the same year. This is able to be achieved by allocating direct-funding as well as drawing on previously allocated cash already held for those projects and other related strategies.
Asset Renewal Funding Strategy
This is the ninth consecutive budget in which Council has implemented its adopted strategy to incrementally provide additional funding to the renewal of assets. The methodology is based on allocating renewal funding equal to a target percentage of Average Annual Asset Consumption (AAAC), The AAAC is a financial term that reflects the average rate at which Council’s asset base deteriorates in condition over a year. Council also uses a six year average increase in order to achieve a smooth rise.
This budget sees an increase of $0.896 million in allocated funding by Council bringing the total asset renewal allocation to 87.5% of Average Annual Asset Consumption (including external contributions). In addition there is an element of extra renewal funding due to Council’s decision in 2014/15 to include a 0.5% rate increase specifically to address Council’s asset renewal backlog which is also included in the graph above.
External contributions relate to Roads to Recovery, $4.094 million. Future years sees a reduction in external contributions resulting in less than 20% of the annual asset renewal demand being provided externally. This was a base premise of the asset renewal funding strategy. If external funding does not increase in future years, the 100% gap will not be met. However Council is on track to achieve 80% council contribution by 2020/21 in accordance with the strategy and financial principle 4. This strategy is planned to be reviewed in 2015/16.
Council has established strong financial principles for funding renewal projects and has ensured that savings or unexpended funds from renewal projects are returned to the asset renewal reserve. These unallocated renewal funds can then be allocated to the delivery of other high priority asset renewal projects and are typically brought out onto high priority renewal projects throughout the year.
Asset Renewal Backlog
The Asset Renewal Backlog (unfunded assets at intervention) chart above is based on the value of assets that have been identified or estimated to be at intervention at this point in time together with forecasts for the value of assets reaching intervention in each of the next 10 years.
The column chart data shows the value of assets expected to require renewal each year while the line chart data indicates the forecast annual renewal funding allocation.
The difference between the top of each column and the corresponding line data point is the value of assets that require renewal that are not able to be funded in a given year. The value of these unfunded assets requiring renewal is often referred to as the asset renewal backlog and, at July 1 2015, this is forecast to be $16.72 million. Based on the current long term financial plan the asset renewal backlog in July 2025 is forecast to grow to approximately $23.99 million. In the 2014/15 budget this backlog was forecast to be 51.6 million by July 2020/23. The significant change is due to improved condition data analysis, asset data corrections and reclassifying of assets.
Council is progressively collating additional and improved data and completing condition assessment on all of its assets. Financial Position (working capital)
Net current assets (working capital) will reduce by $2.118 million to $14.180 million as at 30 June 2016. This is mainly 36 33 27 30 33 36 39 43 45 47 49 51 0 10 20 30 40 50 60 70 80 $ M il li o n 1 July in Year
Total Assets at Intervention ($M) - Start of Year Annual Renewal Allocation ($M)
Debt Management
New borrowings are included in this budget and relate to the ICT Strategy implementation of $0.516 million.
The 2015/16 budget sees Council continuing its low debt level, at $8.608 million, being 26.5% of Rate Revenue (a commonly referred to industry indication, with the recommended prudential guideline to be within 60%). After taking into account Council’s Accumulated Unallocated Cash of $3.309 million, Council’s Net Debt is $5.299 million, or 16% of Rate Revenue.
Council Expenditure Allocations
The above chart provides an indication of how Council allocates its expenditure across the main services that it delivers. It shows how much is allocated to each service area for every $100 that Council spends.
$8.73 $17.79 $7.28 $0.68 $2.51 $6.32 $13.54 $28.68 $7.18 $7.28 Commercial
Community and Family Services Corporate Support
Debt Management Economic Development Governance
Recreation Roads and Bridges Satutory Services Waste and Environmental Services
Long Term Financial Plan
Council’s budget is developed in the context of the Long Term Financial Plan which is driven by objectives contained in Council’s Financial Planning Principles. The Long Term Financial Plan and Financial Planning Principles are reviewed during budget development and periodically throughout the year to provide Council the most relevant forward planning tools.
The Long Term Financial Plan spans the next 15 years and is provided as Appendix K (page 143).
This budget has been developed through a rigorous process of consultation and review and management endorses it as financially responsible and balances the upcoming year and Council’s long term requirements and objectives. Council has a significant responsibility for the stewardship and governance of the assets entrusted to it and this is embodied in the 2015/16 budget.
The key items and principles have been included in this summary, with more detailed budget information available throughout the document 2015/16 budget.
JASON RUSSELL
BUDGET PROCESS
This section lists the budget processes to be undertaken in order to adopt the Budget in accordance with the Local Government Act 1989 (the Act) and Local Government (Planning and Reporting) Regulations 2014 (the Regulations). Under the Act, Council is required to prepare and adopt an annual budget for each financial year. The budget is required to include certain information about the rates and charges that Council intends to levy as well as a range of other information required by the Regulations which support the Act.
The 2015/16 budget, which is included in this report, is for the year 1 July 2015 to 30 June 2016 and is prepared in accordance with the Act and Regulations. The budget includes financial statements being a budgeted Comprehensive Income Statement, Balance Sheet, and Statement of Changes in Equity, Statement of Cash Flows and Statement of Capital Works. These statements have been prepared for the year ended 30 June 2016 in accordance with the Act and Regulations, and consistent with the annual financial statements which are prepared in accordance with Australian Accounting Standards. The budget also includes information about the rates and charges to be levied, the capital works program to be undertaken, the human resources required, and other financial information Council requires in order to make an informed decision about the adoption of the budget.
In advance of preparing the budget, Officers firstly review and update Council's long term financial projections. The preparation of the budget, within this broader context, begins with Officers preparing the operating and capital components of the annual budget during February and March. A draft consolidated budget is then prepared and various iterations are considered by Council at informal briefings during March and April. A ‘proposed’ budget is prepared in accordance with the Act and submitted to Council in May for approval ’in principle’. Council is then required to give ‘public notice’ that it intends to ‘adopt’ the budget. It must give 28 days’ notice of its intention to adopt the proposed budget and make the budget available for inspection at its offices and on its internet web site. A person has a right to make a submission on any proposal contained in the budget and any submission must be considered before adoption of the budget by Council. To assist interested persons to understand the budget and make a submission if they wish, Council officers undertake a community engagement processes including a public information session, focus groups and other techniques. The final step is for Council to adopt the budget after receiving and considering any submissions from interested parties. The budget is required to be adopted by 30 June and a copy submitted to the Minister within 28 days after adoption. The key dates for the budget process are summarised below:
Budget Process Timing
Officers review Council’s Financial Planning Principles January 2015 Officers update Council’s Long Term Financial Plan February 2015 Officers prepare operating and capital budgets February - April 2015 Council considers proposed budget at informal briefings April 2015
Proposed budget submitted to Council for approval May 2015 Public notice advising intention to adopt budget May 2015 Budget available for public inspection and comment May/June 2015
Community engagement process undertaken May/June 2015
Submission period closes (28 days) June 2015
Submissions considered by Council June 2015
Budget presented to Council for adoption June 2015
Copy of adopted budget submitted to the Minister July 2015
1. LINKAGE TO COUNCIL PLAN
This section describes how the Program Budget 2015/16 links to the objectives of the Council Plan 2013-2017 within an overall planning framework. This framework assists Council to consider the long term, medium term and short term objectives in its decision making.
1.1
STRATEGIC PLANNING AND REPORTING FRAMEWORK
The Strategic Resource Plan (SRP), included in the Council Plan, is a rolling four year plan that outlines the financial and non-financial resources that Council requires to achieve the strategic objectives described in the Council Plan. The Annual Budget is then framed within the Strategic Resource Plan, taking into account the services and initiatives included in the Annual Budget which contribute to achieving the strategic objectives specified in the Council Plan. The diagrams below depict the planning and accountability framework that applies to local government in Victoria.
The timing of each component of the planning framework is critical to the successful achievement of the planned outcomes. The Council Plan, including the Strategic Resource Plan, is required to be completed by 30 June following a general election and is reviewed each year in advance of the commencement of the Annual Budget process.
1.2 OUR PURPOSE
Campaspe: Our Future is a long-term strategic plan for the future of our community which has been developed in direct response to community input. Our community has described its vision for the future as follows:
We want to be strong, supportive, vibrant and sustainable.
The plan sets out what the community, business, industry, Council and others can do to deliver the future the community wants, recognising that the realisation of the vision will also be affected by external factors, such as the economy and state and federal government decisions.
For Council, the plan will inform the development and implementation of all strategic and operational plans to ensure all Council activities are delivering on the community’s vision for the future.
The Council Plan 2013-2017 reinforces Council's commitment to listening and discussing with the community the things that matter and how Council can make a difference. We approach ongoing consultation seriously to ensure the community’s views, ideas and aspirations are integrated into our forward planning and everyday activities, as well as in the evaluation of these activities and Council’s services.
Council’s Vision: To be a vibrant place to live grow and visit, with a thriving, diverse and healthy lifestyle.
Vision What it means
Thriving We have a great opportunity, with prosperous businesses and happy communities
Diverse Our varied communities and environments make Campaspe a place for all kinds of people
Healthy We are active, connected and well and care for our natural, urban and rural surroundings
Our Mission: We will improve the lives of people in our community.
Our values What it means
Our Community We seek to understand and realise our community’s aspirations, balancing individual and overall benefit.
Our Reputation We are known as leaders who address important issues, using a constructive approach and who can be relied upon to honour our commitments.
Our Future We demonstrate sustainability in our decisions for the benefit of today and tomorrow..
Our People We achieve great things for our organisation and our community by caring for and supporting our people.
1.3 STRATEGIC OBJECTIVES
Council has structured its strategic objectives within the three community outcomes of Prosperity, Place and People. Additionally, objectives are articulated for the organisation which ultimately supports the delivery of the Council Plan objectives.
Community
Outcomes
Description
Prosperity
The Shire of Campaspe is committed to supporting and promoting a vibrant and thriving economy. Through strong support and partnership with businesses in such areas as tourism, building development, agriculture, food processing and manufacture, Council seeks to assist and drive a prosperous environment.
Place
The Shire of Campaspe is endowed with an abundance of beautiful historic buildings and attractive townships. We have a pride in heritage aspects of our Shire and the appearance of our public places and facilities. Council adopts environmentally sound practices to protect and enhance our unique environment, whilst our land use management must be wisely planned and implemented.
People
Supporting a vibrant and diverse community, Council actively encourages community participation and engagement in the arts and cultural life of the Shire. Community involvement is encouraged in planning and evaluating Council activities and the long term vision of the Shire. Council services strive to provide quality services in the areas of most need and enhance the wellbeing of the community. Council also provides support to many agencies involved in service delivery.
Organisational Support
The organisation aligns its resources to the objectives of the Council Plan. It strives to achieve cost-effective service delivery that meets the needs of the community. Many service areas are highly visible to our community, but there is equal commitment from staff that support internal customers as they go about their day-to-day business delivering to the community. In all things the organisation has a commitment to building a prosperous Campaspe community now and into the future.
2. SERVICES, INITIATIVES AND SERVICE PERFORMANCE INDICATORS
This section provides a description of the functions / services and initiatives to be funded in the Budget for the 2015/16 year and how these will contribute to achieving the strategic objectives specified in the Council Plan as set out in Section 1. It also includes a number of initiatives, major initiatives and service performance outcome indicators. The Strategic Resource Plan (SRP) is part of and prepared in conjunction with the Council Plan. The relationship between these components of the Budget and the Council Plan, along with the link to reporting in the Annual Report, is shown below.
2.1
PROSPERITY
2.1.1 Functions / Services
Council supports the prosperity of its community at many levels. It advocates on behalf of industry as it faces change, brings businesses together through facilitating network opportunities, and links businesses to opportunities to export outside of the region.
Functions Description Revenue
(Expenditure) (Net Cost) Economic
Development
Assists in creating an environment that supports existing business and new enterprise through the provision of information, assistance, referral and support. Council services also aid improved communication links, knowledge sharing and partnerships by facilitating forums, business networks and discussion.
1 (820) (819) Tourism and Events Development
Assists in facilitating and supporting the growth of a sustainable tourism and events sector, through advocacy, strategic partnerships and strategic planning for tourism growth.
0 (1,218) (1,218) Economic
Infrastructure
To ensure appropriate infrastructure is available to facilitate economic development of business and industry including direct ownership and management of the Echuca Aerodrome, Echuca and District Livestock Exchange, and the Port of Echuca Precinct, moorings and marinas.
601 (734) (133)
Commercial Activities
Ensures that Council’s commercial enterprises and commercially leased facilities are being managed in an efficient and effective manner, achieving the outcomes nominated by Council.
7,132 (5,405) 1,727
2.1.2 Initiatives
The following are some planned initiatives through the Program Budget that directly relate to Council’s objectives for Prosperity:
Council Plan Link Initiatives
Prosperity Objective 1:
Industry and businesses are attracted and supported to invest, grow and diversify
Establishment of the Investment Attraction Manager role to attract private investment to the municipality
Prosperity Objective 2:
Our primary and secondary agricultural sectors are strong and viable
Completion of strategic rural land use projects
Prosperity Objective 3:
Campaspe is a desired tourist destination Commencement of the Echuca Riverfront Development Prosperity Objective 4:
Campaspe attracts and retains new residents
Active participation in regional opportunities that showcase the Shire of Campaspe to potential residents
2.1.3 Performance Indicators
The following performance indicator will be reported on within the Performance Statement of the 2015/16 annual report:
Function Indicator Performance measure Computation
Economic Development
Economic activity
Change in number of businesses (Percentage change in the number of businesses with an ABN in the municipality)
[Number of businesses with an ABN in the municipality at the end of the financial year less the number of businesses at the start of the financial year / Number of businesses with an ABN in the municipality at the start of the financial year] x100
2.2 PLACE
2.2.1 Functions / Services
Council supports the physical environments of its community at many levels. Council is responsible for the building, management and operation of a vast range of infrastructure (roads, bridges, drains, etc) and facilities (libraries, halls, stadiums, etc). To do this Council needs skills and expertise across a variety of functions.
Biodiversity protection and responding to climate change are major challenges being tackled at local, regional and national levels. The Council Plan also identifies the promotion of environmentally sustainable practices as real ways of improving the Campaspe environment.
Functions Description Revenue
(Expenditure) (Net Cost) Strategic Asset
Management
Maintains an overview of Council’s assets and plans for their future in an integrated and prioritised manner in order to optimise their value and service potential.
0 (1,390) (1,390) Property
Maintenance
Maintains Council’s facilities in a prioritised and integrated manner. This includes not-for-profit leased and direct managed facilities. This includes ensuring that Council owned buildings comply with Essential Services legislation.
219 (1,743) (1,524)
Parks and Gardens Includes the maintenance of garden beds, broad acre mowing, toilet and BBQ maintenance. In addition, the arboriculture team
undertakes inspection, pruning, planting and removal of trees and assesses relevant planning permit applications.
0 (4,141) (4,141)
Statutory Land Use Planning
Processes all planning applications, provides advice and makes decisions about development proposals that require a planning permit, as well as representing Council at the Victorian Civil and Administrative Tribunal where necessary.
219 (1,263) (1,044)
Building Control Provides statutory building services to the community including processing building permits, essential services inspections, audits of building works and investigations of complaints and illegal works.
237 (862) (625) Road Services Includes planning and design for setting road service levels as well
as, renewing, constructing and maintaining Council’s roads, bridges, drains and footpath network.
501 (19,555) (19,054) Waste and Recycling Manages Council’s landfills and transfer stations, as well as the
kerbside garbage, recycling and garden organics collections from all households and some commercial properties.
5,419 (4,864) 555 Environmental
Services
This function supports environmental works throughout the Shire including Landcare and salinity control and provides advice to internal and external parties regarding conservation and environmental support measures.
5 (331) (326)
2.2.2 Initiatives
The following are some planned initiatives through the Program Budget that directly relate to Council’s objectives for Place:
Council Plan Link Initiatives
Place Objective 1:
Transport networks enable easy access to localities
Participation in Loddon Mallee integrated transport strategy Ongoing advocacy of Railing Ahead project
Place Objective 2:
Land use planning meets current and future needs
Complete the Small Town Structure Planning project
Place Objective 3:
Community infrastructure contributes to our long-term social and economic fabric
Replace the flooring at Echuca Stadium
Place Objective 4:
Towns are attractive, with future
requirements and unique features clearly understood by Council
Commence Kyabram fountain / streetscape project Implement Ogilvie Ave landscaping project (stage 1)
Place Objective 5:
The natural environment is protected and enhanced
Partnership with Moira Shire and City of Greater Shepparton to develop landscape guidelines
2.2.3 Performance Indicators
The following performance indicators will be reported on within the Performance Statement of the 2015/16 annual report:
Function Indicator Performance measure Computation
Statutory planning
Decision making
Council planning decisions upheld at VCAT (Percentage of planning application decisions subject to review by VCAT and that were not set aside)
[Number of VCAT decisions that did not set aside Council’s decision in relation to a planning application / Number of VCAT decisions in relation to planning applications] x100 Roads Satisfaction Satisfaction with sealed local roads
(Community satisfaction rating out of 100 with how Council has performed on the condition of sealed local roads)
Community satisfaction rating out of 100 with how Council has performed on the condition of sealed local roads.
Waste collection Waste diversion
Kerbside collection waste diverted from landfill (Percentage of garbage, recyclables and green organics collected from kerbside bins that is diverted from landfill)
[Weight of recyclables and green organics collected from kerbside bins / Weight of garbage, recyclables and green organics collected from kerbside bins] x100
2.3
PEOPLE
2.3.1 Functions / Services
Many of Council’s functions directly support our community. A large part of the workforce spend their time face to face with the community as they look after children, greet customers in person or on the phone and link people to essential information.
Functions Description Revenue
(Expenditure) Net Cost Aged and Disability
Services
Services for the aged and people with disabilities including meals on wheels, personal care, home maintenance, transport and senior citizens club support.
4,370 (5,555) (1,185) Family Services Family oriented services including preschools, maternal and child
health and long day care. Approximately 2,000 children access children's services across long day care, kindergarten and maternal and child health services.
3,622 (4,425) (803)
Library Services Provides public library services across the Shire via the Regional Library (located in Echuca) and branches in Kyabram, Rochester, Rushworth and Tongala. The development of “Community Hubs” over the past four years has seen the libraries, Council service centres and in some cases community groups co-locate in the one building. The depreciation cost of buildings associated with these combined activities is located in this function.
439 (2,146) (1,706)
Community Programs
Varied ongoing and time limited programs including youth development activities, health promotion, rural access, housing support, arts and cultural. It provides support to venues, facilitates groups and target populations to achieve defined outcomes and program objectives.
260 (650) (390)
Recreation Management and use of aquatic facilities, sporting grounds, pavilions, playgrounds or spaces utilised for recreational pursuits. These tasks are achieved directly or through the support of volunteer committees and contractors. 1,653 (5,913) (4,260) Community Planning
Supports communities to identify their future opportunities and challenges and building capacity to plan to address these at a community level. Includes development of community plans by communities across the Shire
0 (373) (373)
Call Centre and Service Centres
Service information, payment of Council rates and accounts as well as visitor information is available through the service centres. Council owned and managed facilities, including meeting rooms and recreation facilities, may be booked through this function. Five customer service centres are operated throughout the municipality (Echuca, Rushworth, Tongala, Rochester and Kyabram).
0 (201) (201)
Functions Description Revenue (Expenditure)
Net Cost Emergency
Management
Supports the provision of Municipal Emergency Coordination Centres, undertakes statutory functions of Municipal Emergency Resource Coordinator, Municipal Recovery Manager and Municipal Emergency Management Committee and the preparation of a Municipal
Emergency Management Plan.
106 (395) (289)
Environmental Health
Protects the community’s health and wellbeing. It conducts food safety inspections, manages the immunisation process, and works to rectify any public health concerns relating to unreasonable noise and odour emissions, housing standards and pest controls.
292 (976) (684)
Local Laws Provides regulation and enforcement of the general Local Law and relevant State legislation aimed at maintaining the safety and amenity of the community (including parking enforcement). It provides the staff at school crossings throughout the municipality to ensure all
pedestrians, but mainly school aged children, are able to cross the road safely. It provides animal control services including animal registration, dog and cat collection service and a regional pound.
1,620 (2,022) (402)
2.3.2 Initiatives
The following are some planned initiatives through the Program Budget that directly relate to Council’s objectives for People:
Council Plan Link Initiatives
People Objective 1:
Services support our communities’ health and wellbeing
Complete Hydrotherapy Pool Feasibility Study Implementation of the Campaspe Pre-School Review People Objective 2:
Communities are vibrant, happy and proud with strong arts, culture and heritage
Completion of building works at Lockington Heritage Centre
People Objective 3:
The identity and diversity of our communities is strengthened and celebrated
Support opportunities to recognise Australia’s heritage through Campaspe’s Community Grants Program, such as WW1 Centenary Events
People Objective 4:
Young people reach their full potential Participate in National Youth Week activities
Participate in local career expo and other school initiatives
2.3.3 Performance Indicators
The following performance indicators will be reported on within the Performance Statement of the 2015/16 annual report:
Function Indicator Performance measure Computation
Home and Community Care
Participation Participation in HACC service
(Percentage of the municipal target population that receive a HACC service)
[Number of people that received a HACC service / Municipal target population for HACC services] x100
Participation in HACC service by CALD people (Percentage of the municipal target population in relation to CALD people that receive a HACC service)
[Number of CALD people who receive a HACC service / Municipal target population in relation to CALD people for HACC services] x100
Maternal and Child Health
Participation Participation in the MCH service
(Percentage of children enrolled who participate in the MCH service)
[Number of children who attend the MCH service at least once (in a year) / Number of children enrolled in the MCH service] x100
Participation in MCH key ages and stages visits by Aboriginal children
(Percentage of Aboriginal children attending the MCH key ages and stages visits)
[Number of Aboriginal children who attend the MCH service at least once (in a year) / Number of Aboriginal children enrolled in the MCH service] x100
Libraries Participation Active library members
(Percentage of the municipal population that are active library members)
[Number of active library members / municipal population] x100
Function Indicator Performance measure Computation Aquatic
Facilities
Utilisation Utilisation of aquatic facilities
(The number of visits to aquatic facilities per head of municipal population)
Number of visits to aquatic facilities / Municipal population
Animal Management
Health and safety
Animal management prosecutions
(Number of successful animal management prosecutions)
Number of successful animal management prosecutions
Food safety Health and safety
Critical and major non-compliance notifications (Percentage of critical and major
non-compliance notifications that are followed up by Council)
[Number of critical non-compliance notifications and major non-compliance notifications about a food premises followed up / Number of critical non-compliance notifications and major non-compliance notifications about food premises] x100
2.4 ORGANISATIONAL SUPPORT
2.4.1 Functions / Services
Council requires a range of support functions in order to deliver its services for the community. These functions must ensure the organisation has the necessary tools, and observes important governance standards, but also continues to lift its performance to enhance effectiveness and efficiency.
Functions Description Revenue
(Expenditure) Net Cost Councillors, Chief
Executive and Executive Team
Council and executive leadership and management functions, ensuring clear policy, direction and effective operations across the organisation, this function includes all direct and indirect costs and support functions to Council and executives.
26 (1,662) (1,636)
Strategic Planning Responsible for Council’s corporate planning activities as required by legislation, and developing Council’s planning activities to ensure that they are consistent and integrated, as well as considerate of community planning activities.
2 (789) (787)
Communications and Civic Events
Responsible for the management and provision of advice on external communication, in consultation with relevant stakeholders, on behalf of Council. Additionally this function organises Council’s Civic Events, provided for the community and guests.
0 (802) (802)
Financial Services Provides financial based services to both internal and external customers including the management of Council’s finances, payment of salaries and wages to Council employees, procurement, fleet management, raising and collection of rates and charges and valuations of properties throughout the municipality.
217 (1,446) (1,229)
Information Management
Provides, supports and maintains reliable and cost effective information, communications and computing services, facilities and infrastructure to support staff in the delivery of services to the community.
0 (800) (800) Organisation
Development
Provides Council with strategic and operational organisation development support. It develops and implements strategies, policies and procedures through the provision of human resources and industrial relations services. 50 (551) (501) Grants Management
Administers Council’s in-bound and out-bound grants, ensuring all obligations are met. This function also manages the Community Grants Program to support partnership opportunities.
0 (363) (363) Governance and
Compliance
Provides a range of governance, statutory and risk management
functions. This includes the coordination of Council meetings, provision of legal support services, compliance with legislation (including the Local Government Act), management of insurance, WorkCover premiums and processes claims and insurer’s audits.
12 (1,680) (1,668)
2.4.2 Initiatives
The following are some planned initiatives through the Program Budget that directly relate to Council’s objectives for Organisational Support:
Council Plan Link Initiatives
Organisation Support Objective 1: With our stakeholders, partners and community, we hold shared goals and understand each other’s obligations, activities and achievements
Ongoing partnership with Murray River Group of Councils Continued delivery of community planning program
Organisation Support Objective 2: Service delivery reflects community needs and is efficient and effective
Complete Stage 2 Service Planning for half of Council’s identified services
Organisation Support Objective 3:
Council continues to have the resources to provide services needed by our
communities
Implement the iNspire Program as per the 2015/16 program delivery plan
Review Asset Renewal Funding Strategy to support Council’s ability to provide assets that are necessary for ongoing service delivery Organisation Support Objective 4:
Council’s governance processes visibly meet stakeholder needs and statutory obligations
Corporate website redevelopment to support improved governance allowing easier access for stakeholders to Council’s meeting agendas and minutes, videos of Council meetings, statutory documents including the Council Plan, Strategic Resource Plan, Budget and Annual Report, and adopted policies and strategies.
Organisation Support Objective 5: Enhance our ability to achieve outcomes through relationships and reputation
Establish the Customer Service Liaison role
2.4.3 Performance Indicators
The following performance indicators will be reported on within the Performance Statement of the 2015/16 annual report:
Function Indicator Performance measure Computation
Governance Satisfaction Satisfaction with Council decisions
(Community satisfaction rating out of 100 with how Council has performed in making decisions in the interests of the community)
Community satisfaction rating out of 100 with how Council has performed in making decisions in the interests of the community
2.5 RECONCILIATION TO UNDERLYING SURPLUS
Rate revenue and Grants Commission funding is managed through Organisational Support; however it has been shown separately as it is used to support Council as a whole. This provides a true reflection of the net cost to Council of Organisational Support.
Net Cost to Council within this section excludes non-recurrent operational projects either funded directly by Council or via external grants.
* Grants Commission Funding yet to be confirmed
2.6 PERFORMANCE STATEMENT
The performance indicators detailed in the preceding pages will be reported on within the Performance Statement which is prepared at the end of the year as required by section 132 of the Act and included in the 2015/16 Annual Report. The Performance Statement will also include reporting on prescribed indicators of financial performance (outlined in section 8) and sustainable capacity, which are not included in this budget report. The full set of prescribed performance indicators are audited each year by the Victorian Auditor General who issues an audit opinion on the Performance Statement.
Net Cost
(Revenue) Expenditure Revenue
$’000 $’000 $’000 (443) (8,178) 7,735 (27,549) (34,148) 6,600 (10,293) (22,655) 12,363 (7,786) (8,093) 307 (46,071) (73,075) 27,004 (46,071) 32,495 11,205 Capital Grants 6,746 Asset Sales 1,281 805 500 53,032 6,961 Service / Function Organisational Support Total services / functions Prosperity
People Place
Grants Commission *
Total funding sources Surplus for the year Interest
Deficit before funding sources General Funding sources Rates and charges
2.7 MAJOR INITIATIVES
Amongst the many funded initiatives detailed in the preceding pages, Council has identified five Major Initiatives. These are detailed in the following table and will be reported in the Annual Report in the form of a statement of progress in the report of operations within the Performance Statement.
Council Plan Link Major Initiative
Prosperity Objective 3:
Campaspe is a desired tourist destination Commencement of the Echuca Riverfront Development Place Objective 2:
Land use planning meets current and future needs
Complete the Small Town Structure Planning project
Place Objective 4:
Towns are attractive, with future
requirements and unique features clearly understood by Council
Commence Kyabram fountain / streetscape project
People Objective 2:
Communities are vibrant, happy and proud with strong arts, culture and heritage
Completion of building works at Lockington Heritage Centre
Organisation Support Objective 2: Service delivery reflects community needs and is efficient and effective
Complete Stage 2 Service Planning for half of Council’s identified services
Organisation Support Objective 3:
Council continues to have the resources to provide services needed by our
communities
Implement the iNspire Program as per the 2015/16 program delivery plan
2.8 SERVICE OUTPUTS
The 2015/16 budget has been developed on the basis of Council delivering services to the volume / output assumptions listed below. These planned outputs are based on actuals delivered in previous years, 2014/15 forecast outputs and changes to service delivery based on Council decisions.
Service Service
Aged and Disability Services Road Services
Home care (hours delivered) 22,299 Gravel roads graded (km) 2,000
Personal care (hours delivered) 8,343 Footpaths maintained (m2) 950
Respite care (hours delivered) 2,364 Potholes repaired (m2) 1,200
Planned Activity Groups (hours delivered) 17,170 Road resealed (km) 45
Meals on wheels (meals provided) 25,000 Road resheeted (km) 160
Shoulders resheeted (km) 60
Campaspe Community Children's Centre
Average utilisation 94% Community Facilities
Total days of care 18,255 Recreation reserves maintained 31
Halls maintained 25
Rochester and District Child Care Centre Playgrounds maintained 40
Average utilisation 84%
Total days of care 5,170 Environmental Health Services
Immunisation vaccinations 5,500
Library Services Registered food businesses 680
Library program participation 17,000 Food premises inspections 700
Library loans 280,000 Food sampling analysis 75
Library membership 15,000
Waste Management
Aquatic Facilities (annual attendance) Weekly waste collection services 17,750
Echuca War Memorial Aquatic Facility 160,000 Fortnightly kerbside recycling services 17,750
Rochester 9,000 Fortnightly green waste services 5,400
Tongala 4,000 Avg weekly household waste generation (kg) 9.8
Kyabram 11,000 Annual garbage collected kerbside (tonnes) 9,150
Rushworth 3,500 Annual garbage collected transfer (tonnes) 3,833
Colbinabbin 2,000 Annual garbage collected sweeper (tonnes) 1,000
Stanhope 2,000 Annual recyclables collected (tonnes) 4,700
Lockington 2,500
Local Laws
Caravan Park Dog registrations 8,600
Visitor numbers 28,565 Cat registrations 2,400
Site night occupancy - Cabins 7,720 Animal infringements 250
Site night occupancy - Sites 28,470 Parking infringements 6,500
Port of Echuca Statutory Planning
Wharf entry ticket sales 24,870 Applications received and dealt with 500
Planning permits audited 400
Echuca Paddlesteamers Complaints received and dealt with 200
Cruise only ticket sales 34,500
Charters conducted 32 Customer Service
Total calls taken 70,000
Livestock Exchange Total service centre visits 37,000
Number of cattle sold 32,250
Number of horses sold 3,600 Building
Property information requests provided 1,840
Quarry Essential services audits 100
Tonnes crushed 273,000 Reports and consents 70
Tonnes sold 249,000 Municipal Building Surveyor (permits issued) 250
3. BUDGET INFLUENCES
This section sets out the key budget influences arising from the internal and external environment within which Council operates.
3.1 SHIRE OF CAMPASPE SNAPSHOT
The Shire of Campaspe is strategically located in north central Victoria, about 180 kilometres north of Melbourne. The Shire of Campaspe is bounded to the north by the Murray River, to the south by the Box Ironbark State Forests, to the east by the Goulburn Valley and in the west by the Patho Plains.
The Shire is located in the heart of one of the richest and most diverse agriculture and food processing areas in Victoria. Its climate, history, cultural heritage, natural assets and location in relation to major urban centres provide the Shire with extensive opportunities. The Shire encompasses a total land area of over 4,500 square kilometres.
Population
With an estimated residential population of 36,357 people we value our dynamic and diverse communities, where people feel safe and supported regardless of age, background or abilities.
At the most recent Census the age structure of the Shire of Campaspe compared to Regional Victoria showed a similar proportion of pre-schoolers but a higher proportion of people post retirement. Overall, 24.5% of the population was aged between 0 and 17, and 25.8% were aged 60 years and over.
The Loddon Mallee North Regional Growth Plan 2013 recognised that population growth in the region is intensifying in regional centres, including Echuca Moama, and greatly outstripping any increases in inland towns and rural settlements. Echuca is the main service provider in the Shire of Campaspe and together with Moama is currently experiencing significant residential growth. Echuca forms an important industrial, community, health, recreational, transport and tourism hub for northern Victoria and southern New South Wales and is a significant tourist destination.
The Regional Growth Plan also recognised that other urban localities will continue to accommodate some growth including Kyabram, Tongala, Rushworth and Rochester. These towns will continue to provide services and support to surrounding rural communities and offer affordable housing alternatives for commuters to Bendigo, Echuca and Shepparton.
Both Echuca and Kyabram recorded population increases between the 2006 and 2011 Census and are projected to continue to grow. The estimated residential populations of Echuca and Kyabram at the 2011 Census were 13,652 and 7,371, respectively. All other areas across the Shire generally recorded decreases in population between the two census periods.
Who are we?
Analysis of the country of birth of the population in Shire of Campaspe in 2011 compared to Regional Victoria shows that there was a smaller proportion of people born overseas as well as a smaller proportion of people from a non-English speaking background.
Overall, 6.3% of the population was born overseas, and 2.8% were from a non-English speaking background, compared with 10.6% and 5.5% respectively for Regional Victoria.
The dominant non-English speaking country of birth in Shire of Campaspe was Italy, where 0.5% of the population, or 194 people, were born.
Between 2006 and 2011, the number of people born overseas increased by 232 or 11.2%, and the number of people from a non-English speaking background increased by 141 or 16.0%.
The largest changes in birthplace countries of the population in this area between 2006 and 2011 were for those born in: • Philippines (+77 persons)
• New Zealand (+76 persons) What do we do?
Approximately three quarters of Campaspe’s employed residents work within the municipality. The three most popular occupations were:
• Managers • Labourers
• Technicians and Trades Workers
In combination these three occupations accounted for 48% of the employed resident population.
Campaspe comprises a smaller proportion of high income individuals and households compared to Regional Victoria, with 29% of all households considered low income households, earning less than $500 per week.
Approximately 40% of the employed resident population are employed in three industry sectors: • Manufacturing
• Agriculture, Forestry and Fishing • Health Care and Social Assistance
Within Campaspe Agriculture, Forestry & Fishing employs 13% of the residential population in comparison to 8% across regional Victoria. Whilst manufacturing represents 15% of persons employed.
Tourism is another important industry generating employment, with 10% of total employment generated through tourism, accommodation and food services.
The largest changes in the jobs held by the resident population between 2006 and 2011 were for those employed in: • Agriculture, Forestry and Fishing (-525 persons)
• Health Care and Social Assistance (+333 persons) • Manufacturing (-122 persons)
How do we live?
In 2011 Campaspe had 14,298 private dwellings. Campaspe residents predominately reside in private dwellings (88%) with a smaller percentage living in medium density dwellings and high density flats and apartments. Wide price variations exist across the Campaspe.
Analysis of the monthly housing loan repayments of households in Shire of Campaspe compared to Regional Victoria shows that there was a smaller proportion of households paying high mortgage repayments ($2,600 per month or more) and a larger proportion of households with low mortgage repayments (less than $1,000 per month).
Analysis of the family types in Shire of Campaspe in 2011 compared to Regional Victoria shows that there was a similar proportion of couples with young children, older children, and one-parent families. Across the Shire of Campaspe in 2011 there was a lower proportion of Lone Person Households (26%) and a higher proportion of Couples without Children (30%) compared to Regional Victoria.
The largest changes in family types in Shire of Campaspe between 2006 and 2011 were: • Couples with children (-294 households)
• Lone person (+271 households)
• Couples without children (+199 households) • One parent families (+167 households) Education
Educational Qualifications are one of the most important indicators of socio-economic status.
Analysis of the qualifications of the population in Shire of Campaspe in 2011 compared to Regional Victoria shows that there was a smaller proportion of people holding formal qualifications (Bachelor or higher degree; Advanced Diploma or Diploma; or Vocational qualifications) and a larger proportion of people with no formal qualifications.
Overall, 36% of the population held educational qualifications, and 53% had no qualifications, compared with 40% and 48% respectively for Regional Victoria.
There were no major differences between Shire of Campaspe and Regional Victoria's highest qualifications achieved data in 2011.
The largest changes in the qualifications of the population in Shire of Campaspe between 2001 and 2006 were in those with:
• Vocational qualifications (+756 persons) • No qualifications (-736 persons)
Social and Economic Wellbeing
The Social Economic Indexes For Areas (SEIFA) index of disadvantage consists of four indexes – which have been the same since 2001.
• Index of Disadvantage
• Index of Advantage/Disadvantage • Index of Economic Resources • Index of Education and Occupation
Each index measures general “disadvantage” in a community or a broad aspect of disadvantage, and they are designed to have an average of about 1,000, with lower numbers being more disadvantaged and higher numbers less. Various Census characteristics are used in calculating the indexes included such as incomes, education levels, occupations, rent and mortgage payments, family structure and unemployment.
SEIFA scores are not comparable over time but is great in summarising disadvantage into a single number, and useful if you need to rank areas to determine priority areas for programs or services.
The Shire of Campaspe scores 964.07 on the SEIFA index, indicating it is more disadvantaged than the Victorian average of 997.01 but less disadvantaged than the national average of 960.31. The level of disadvantage varies across the Shire
Budget Implications
As a result of this municipal profile there are a number of budget implications in the short and long term:
• The large geographic area means that assets and some services must be provided across multiple locations. This means a larger asset base than other more consolidated communities, and increased costs of service provision.
• The availability and affordability of water to the agricultural section of our economy as a result of ongoing water reform is an important factor. Council continues to monitor the issue, work with relevant agencies and advocate where required.
3.2 EXTERNAL INFLUENCES
In preparing the 2015/16 budget, a number of external influences have been taken into consideration. These influences are expected to impact the financial position of Council in the budget period and they include:
• Consumer Price Index (CPI) increases on goods and services of 1.7% through the year to December quarter 2014 (ABS release 28 January 2015). State-wide CPI is forecast to be 2.5% for the 2015/16 year (Victorian Budget Papers 2014/15).
• Australian Average Weekly Earnings (AWE) growth for Public Sector full-time adult ordinary time earnings in the 12 months to May 2014 was 3.1% (ABS release 14 August 2014). The wages price index in Victoria is projected to be 3.50% per annum in 2015/16 and the subsequent two years (Victorian Budget Papers 2014/15). Council must renegotiate a new Collective Agreement during the 2015/16 year for commencement on 1 July 2016. • Reduction $0.143 million in Victoria Grants Commission funding compared to the prior year. 2014/15 allocation
included $0.062 million prior year under-allocation and $0.035 million disaster recovery funding.
• Cost Shifting occurs where Local Government provides a service to the community on behalf of the State and Federal Government. Over time the funds received by local governments do not increase in line with real cost increases. Examples of services that are subject to Cost Shifting include school crossing supervision, Library services and Home and Community Care for aged residents. In all these services the level of payment received by Council from the State Government does not reflect the real cost of providing the service to the community. • The Victorian State Government has announced that local government rates will be capped from 2016/17.
Depending on the level at which rates are capped, Council will need to continue to undertake reviews of services and service levels that are provided to the community with the aim of reducing the level of rate payer subsidy for services undertaken by Local Government on behalf of the State and Federal Government.
• Councils across Australia raise approximately 3% of the total taxation collected by all levels of Government in Australia. In addition Councils are entrusted with the maintenance of more than 30% of the all Australian public assets including roads, bridges, parks, footpaths and public buildings. This means that a large proportion of Council’s income must be allocated to the maintenance and replacement of these valuable public assets in order to ensure the quality of public infrastructure is maintained at satisfactory levels.
• The Fire Services Property Levy will continue to be collected by Council on behalf of the State Government with the introduction of the Fire Services Property Levy Act 2012.
• Additional costs built into this budget in excess of $0.80 million in response to regulatory, legislative and Council based decisions including:
• EPA Landfill pollution abatement notice $0.09 million • Contributions to developer works $0.20 million • DDA Strategy implementation $0.21 million • Drainage Policy implementation $0.30 million
3.3 INTERNAL INFLUENCES
As well as external influences, there are a number of internal influences which have had significant impact on the budget for 2015/16. These include:
• Ensuring financial sustainability and delivering a balanced budget for the Long Term Financial Plan period whilst achieving Council’s objectives
• Maximising returns from profit generating enterprises • Target to maintain moderate overall expense growth
• Maximising fees and charges growth and minimising cost growth to moderate impact on rates and ensure net cost to Council for non-statutory services is minimised
• Council decisions around the use of surplus cash throughout the year resulting in the ability to meet unforeseen obligations
• No reliance on interest income to fund recurrent operations • Commitment to closing the asset renewal gap
• Borrowings in relation to the ICT Strategy implementation ($0.516 million)
• Employee Enterprise Agreement – current agreement commenced in February 2013 (expires February 2016) in line with budgeted assumptions.
3.4 FINANCIAL PLANNING PRINCIPLES
The Financial Planning Principles were formally adopted by Council at the Council meeting of 15 May 2012 and are provided in full detail at Appendix I (page 136).
Council’s Financial Planning Principles are:
1. Council to meet obligations prior to allocating discretionary items 2. Council to maintain commitment to the Asset Renewal Funding Strategy 3. Council to prioritise renewal funds based on asset condition assessments 4. Council to accelerate the closure of the asset renewal gap to 10 years
5. Council to assign unexpected windfalls or project benefits to asset renewal as one-off allocations 6. Council not to rely on interest income in setting the recurrent budget
7. Council to manage its debt in accordance with established guidelines
8. Council to ensure an accumulated unallocated cash balance of $0.5 million each year 9. Council to fund annual requirements only
10. Council to seek to implement a cost recovery model 11. Council to utilise 15 year long term financial planning 12. Council’s budget targets to be agreed and met each year
13. Council to focus on core operations by reporting and budgeting against EBITDA
14. Council to direct savings from Financial Sustainability: Rural Roads back to Rural Roads 15. Council to hold funds in reserves in accordance with established guidelines
16. Council maintain a multi-year Funding Program Schedule and endorse this annually as part of the budget process.