Paper ID #24639
Interactive Physical Experiments in an Advanced Undergraduate Structural
Dynamics Course
Charles D. Facciolo, Daedalus Structural Engineering
Charles Facciolo is a project engineer with Daedalus Structural Engineering where he is currently focused on high-end residential design. He received his bachelor’s degree in architectural engineering with a minor in construction management from California Polytechnic State University - San Luis Obispo. Charles is working to continually broaden his engineering knowledge in order to become a well rounded structural engineer who can provide unique solutions to challenging problems.
Dr. Anahid Behrouzi, California Polytechnic State University - San Luis Obispo
Anahid Behrouzi is an assistant professor of architectural engineering at California Polytechnic State University - San Luis Obispo. She has been involved with STEM education beginning in 2003 as a volunteer and summer instructor with the North Carolina Museum of Life and Science. She has been engaged with undergraduate/graduate course delivery in the topic areas of engineering problem-solving and structural engineering at North Carolina State University (2008-2011), the University of Illinois at Urbana-Champaign (2012-2015), Tufts University (2015-2016), and Cal Poly - San Luis Obispo (2016-present). She has a BS in civil engineering and BA in Spanish language & literature from North Carolina State University, and a MS/PhD in civil engineering from the University of Illinois at Urbana-Champaign.
c
Interactive Physical Experiments in an Advanced
Undergraduate Structural Dynamics Course
Abstract
This paper describes a number of physical models and hands-on lab activities incorporated in an advanced undergraduate structural dynamics lecture and laboratory course pairing offered within the Architectural Engineering department at California Polytechnic State University – San Luis Obispo. These course modifications were designed and implemented in the Winter 2018 quarter to enable students to:
Collect acceleration data during free or forced vibration tests using a smartphone accelerometer application to generate data plots in Matlab;
Conduct free vibration tests on various single-degree of freedom (SDOF) systems to investigate effects of varying mass, stiffness/height, material type, and damping type (pendulum or sloshing damper) on structural period and damping behavior;
Observe and analyze data from forced vibration tests using a small-scale shake table or eccentric mass shaker for various SDOF systems, diaphragms, and multi-story frames to understand natural frequency, dynamic amplification, and mode shapes; and
Execute a parametric study using Matlab interface that animates modal and time history response of a rigid diaphragm to illustrate impacts of changing mass, geometry, or stiffness.
Students were surveyed at the end of the Winter 2018 quarter, and their responses with regards to the new physical experiments/demonstrations were largely positive. In general, they indicated that observing the dynamic response of physical structural models; collecting and processing data; and comparing the results to theoretical predictions was engaging and encourages them to develop their engineering intuition, rather than memorize equations or procedures.
Introduction
It is uncommon for a course in advanced structural dynamics, with a focus on earthquake engineering concepts, to be required in the undergraduate civil/architectural engineering curriculum. The exclusion of this class is the result of one or more of the following factors:
technical complexity of course topics,
lack of modern textbooks that serve to adequately explain challenging concepts,1
limited perceived necessity based on the majority of undergraduate student career paths, availability of course at the graduate level for interested students, and/or
instruction underscores the importance of incorporating hands-on experimentation coupled with data analysis and/or computer simulation to not only help students develop their intuition, but also their confidence in conducting engineering calculations. Some examples of the instructional efforts related to physical and virtual experiments follow.
Physical Experiments
One of the most ubiquitous physical demonstrations for a structural dynamics class with earthquake engineering focus is a set of lumped mass models consisting of a cylindrical metal mass atop a threaded rod fixed to a movable base plate. These lumped mass models are constructed with variable mass weights or heights to demonstrate how ground motions with distinct frequency content impact structures in different ways. This model is typically used for observational purposes, rather than for an experiment, as there is no applied instrumentation that allows students to engage in data processing and analysis.2
An experiment that is utilized in many dynamics lab courses is a simple spring-mass system where students conduct a static stiffness test and weigh the mass to calculate the natural frequency of the system.3 Helgeson4 expands on this idea by utilizing a piezoelectric
accelerometer to capture free vibration test data so students can experimentally determine natural frequency and damping values to compare with results from their Matlab Simulink simulations. This is a prime example of how to transition students from using straightforward analytical equations to higher level thinking required for developing their own computational models. Small-scale steel frames are another popular experimental specimen to utilize in teaching structural dynamics. Typically a set of these are constructed and consist of at least a 1-story and 2+ - story model. Common test scenarios for free, impact, or harmonic forced vibration include: bare frame; additional of mass at each story; viscous, friction, or beam dampers; and/or base isolation. Instrumentation often includes piezoelectric accelerometers, strain gauges, and linear variable differential transformer (LVDT) sensors located at each floor level to enable the conduct of a Fast Fourier Transform (FFT) and determination of mode frequencies, shapes, and damping ratios.2-5 Tito-Izquierdo et al.3 and Helgeson4 had students develop computer models of the multi degree-of-freedom steel frame system to compare experimental and predicted values (software used was Matlab Simulink and the FEM software VisualAnalysis v5.5, respectively).
Several lab activities link the topics of structural dynamics and structural health monitoring. Riley et al.6 describes free vibration tests on wood 2x4 cantilever beams with 0%, 25%, and 50%
cross-section reduction to represent varying levels of damage. Using an iPhone with an internal triple-axis accelerometer and the iSeismometer application, students analyzed acceleration time history data to correlate damage level to dynamic properties like natural frequency/period and damping ratio. Similarly, Tito-Izquierdo et al.3 summarized dynamic tests of one reinforced
Virtual Experiments
Student assessments of the demonstrations and experiments described in the previous section indicate these hands-on activities are engaging and educational for their students. However, cost and time constraints can be limiting when conducting physical parametric studies especially for non-linear systems. In these scenarios, virtual experiments are an attractive alternative.
Jacquot et al.7 describes a Matlab script that animates a variety of beam vibration problems. Students can modify boundary conditions (pin-pin, pin-fix, fix-free, fix-fix), loading (point or distributed load), and input excitation (free vibration, unit impulse, unit step, cosine harmonic function). They can then examine the overall deflected shape of the beam at various points in time, or select individual points along the beam for which to plot displacement, velocity, or acceleration time histories. This simulation tool has a low barrier to entry with respect to prior knowledge, cost, and speed of use when compared to most finite element modelling tools that would enable a similar parametric study. To be clear, these ideas have been explored
experimentally using an aluminum cantilever beam with rotating eccentric mass4 and simply
supported aluminum beam subject to unit impulse3, but it is not reasonable to try and examine each parameter available in the Matlab program through physical testing.
Gao et al.8 summarizes an online Java tool that allows students to investigate the response of a multi-story framed structure equipped with various structural control techniques such as a tuned mass damper, hybrid mass damper, linear or non-linear base isolation. Users can change the input parameters for each of these control methods to observe an animation of how baseline and control system behave when subjected to one of four earthquake motions. The tool displays displacement, velocity, and acceleration for any selected point along each structure; response spectra; and indication of performance gains from the baseline. This virtual lab is particularly useful since the physical model would be expected to undergo some level of nonlinear behavior in order to engage the structural control systems, necessitating replacement or repair of the model. Other considerations would be the time and cost to develop and test a wide range of tuned mass dampers, hybrid mass dampers, or base isolation; not to mention, the specific area
knowledge to teach students how to model each control system in their computer simulation. Course Details
The undergraduate Architectural Engineering (ARCE) program at California Polytechnic State University – San Luis Obispo (Cal Poly) places a significant focus on earthquake engineering as the vast majority of students are hired directly into West Coast structural design and construction firms. The industry expectation that young engineers have proficiency in this topic area, and the seismic design requirement for Professional Engineer (PE) licensure in California, are motivating factors in offering both structural dynamics and earthquake engineering to undergraduates. The junior-level ARCE 412: Dynamics of Framed Structures and accompanying ARCE 354:
Numerical Analysis Laboratory course pairing is the subject of this paper.
structural analysis software, typically RISA-3D or SAP2000, based on instructor preference. Outside of the ARCE department, students are also required to take the ME 212: Engineering Dynamics course related to particle and rigid body motion. This array of pre-requisite classes prepare students for the tasks of developing stiffness and matrix matrices for a variety of
structural systems and to understand the basic input excitations that produce structural vibrations.
The ARCE 412/354 courses meets for a ten week quarter with three lecture sessions of 50 minutes (maximum 32 students) and a laboratory session of three hours (maximum 16 students). The curriculum is intended to lay the foundation for the subsequent ARCE 483: Seismic Analysis and Design course and draws on content from the Chopra Dynamics of Structures, 5th ed. textbook (portions of Chapters 1-6, 9-10, and 12-13).9 Topic areas include:
Introduction to Structural Dynamics and Review of Direct Stiffness Method Single Degree-of-Freedom (SDOF) System: Free Vibration
SDOF System: Forced Vibration (Harmonic/Periodic) Numerical Evaluation for Arbitrary Forced Vibration
Earthquake Response and Development of Response Spectra based on SDOF
Multiple Degree-of-Freedom (MDOF) System: Development of Stiffness/Mass Matrices MDOF: Free Vibration
MDOF: Modal Analysis
MDOF: Earthquake Analysis via Response Spectrum and Response History Analyses The overarching objective of the lecture is for students to become confident in developing a mathematical model to describe system response for free vibration and various types of forced vibration, particularly earthquake ground motions. The lab is intended to expose students to numerical analysis techniques that support the solution of structural dynamics problems
(numerical integration as well as solution of ordinary differential equations, nonlinear equations and symmetric eigenproblems).
In previous iterations of ARCE 412/354, the instruction method included lectures with example calculations and homework problem sets requiring hand solution, while in lab, there were Matlab programming activities implementing the numerical solution methods. There were only two physical models used in the classes, a set of lumped mass models of varying heights similar to that described in Kukreti and Baseheart2 and the triangular frame model introduced in the
subsequent section of this paper. The first demonstration was primarily observational, and the latter involved only a timer and ruler to approximate the structure’s period and damping from free vibration test results. While these activities inform students’ intuition and ability to visualize dynamic response, it is limited considering the total 55 hours of class/lab time. The research team posited that improvements to existing hands-on experiments and addition of new activities in ARCE 412/354 would better prepare students for the subsequent ARCE 483 course. There students designed and instrumented base-isolated K’Nex structures for shake-table testing10,
instrumented buildings on campus to conduct ambient and ultra-low forced vibration tests, and compared experimentally obtained modal frequencies and shapes of the buildings to ETABS models they had created.11-13
an educator standpoint, efforts were made to keep physical models relatively easy to fabricate using machine shop equipment, low cost, and portable. From an educational standpoint, the goal of modifying the course was to expose students to physical experiments to foster their: (i) engineering intuition and calculation abilities, (ii) proficiency in data acquisition applications available on smart phones, (iii) data post-processing, analysis, and visualization skills in Matlab, (iv) writing thoughtful reflections in lab reports based on observations and quantitative data results, and (v) teamwork. Also, the hope was to engage and excite students in the course topic. Description of Physical / Virtual Experiments
The course activities are summarized below in the order they were covered in class. Additional details related to course instruction (lab handouts), model fabrication (materials, budget, drawings), and sample solutions are presented in the full research project report.14 Additional
teaching resources, such as sample data and Matlab files, are available to architectural/civil engineering instructors upon email request from the faculty co-author.
Implementation of Smartphone Accelerometer Applications
The majority of the physical experiments in this section utilize a smartphone tri-axis
accelerometer application as a data acquisition (DAQ) tool, as it is a relatable and available platform to most students.6 In developing the ARCE 412/354 activities it was already known that students would receive extensive exposure to professional grade, piezoelectric accelerometers in the subsequent ARCE 483 course. The selection of the smartphone accelerometer application was to train and expose students to a tool they typically have on hand throughout their daily lives and could use to readily collect acceleration data outside of the classroom. Some examples the instructor suggested to students were when they ride their bikes or skateboards to school, when their washer vibrates due to a clothing imbalance during the spin cycle, or when they felt building vibrations due to traffic, construction, or earthquakes.
In the course, two free applications were introduced for the different smart phone operating systems: “Accelerometer” application by DreamArc for iOS15 and “Physics Toolbox
Accelerometer” by Vieyra Software for Android16. Both applications allow users to calibrate the
accelerometer readings; select which directions of motion should be visualized and recorded (x-,-y-, or z-axis) during the experiment; and export data to a number of filetypes for post-processing (csv, json, xml). A brief instruction guide was developed for using the iOS accelerometer
application, importing data into Matlab, and providing basic Matlab plotting instructions to complete data analysis and visualization tasks.14
Single Degree of Freedom System: Free Vibration
The experimental set-up consists of a steel plate with vertical mounting tab. The steel base-plate was designed to be sufficiently heavy to avoid rocking without the need for clamping to a table-top. Each column specimen has two holes at each end: at the base to thread onto the mounting tab and secure with a wing nut, and at the free end to affix the phone mount. The base plate, specimens and phone mount were fabricated with a water jet cutter. After cutting the 24-gauge steel sheet metal pattern for the phone mount, it was folded origami-style. The
experimental set-up and detailed renderings of individual components are shown in Figure 1. In this lab activity, student groups were assigned a column specimen material type and they measured dimensions, mass, and estimate material properties of those specimens to analytically determine the stiffness, natural circular frequency, and period for the SDOF fixed-free systems. The group then downloaded the smartphone accelerometer application, set up the experiment as shown in Figure 1, started recording data, and conducted a free vibration test. Once oscillations had attenuated, data collection was terminated, and students emailed themselves the data as a comma separated values (.csv) file. They imported the acceleration data into Matlab to plot the acceleration time history for each cantilever, like those shown in Figure 2, and determine the period which they compare with the values from hand calculations. Students shared data between groups to make compare dynamic response of other specimen materials. In their lab report, they commented on differences in response based on member height and material, and potential sources of error between analytical and experimental results. Note that the topic of damping and logarithmic-decrement method had not yet been covered as this lab occurred in the first week of the quarter, but they did comment on damping related to how quickly the oscillations attenuate.
Figure 1. SDOF System
Figure 2. Sample free vibration plots for steel column specimens
Damping Approaches: Triangular Frame Model
In previous academic quarters, the triangular model shown in Figure 3 was utilized to conduct free vibration tests to estimate the period of this structure by using a stopwatch to measure the time it takes to complete twenty cycles of motion, and the damping ratio by determining the number of cycles required for the displacement amplitude to decrease from 3 to 1-inches. The major update to the triangular model was an attachment for pendulum mass and sloshing liquid dampers to demonstrate the effects of different damping mechanisms. The update had three fabrication components: (i) upper mount which can hold slotted masses or a plastic container filled with water as well as phone mount, (ii) lower mount with a pendulum that can be
locked/unlocked and loaded with slotted weights at various heights, and (iii) five slotted weights. As before all metal components were cut using the water jet cutter. A rendering of the
experimental set-up and photograph of the upper/lower mount are shown in Figure 3.
Figure 3. Triangular frame model a) Rendering of experimental set-up
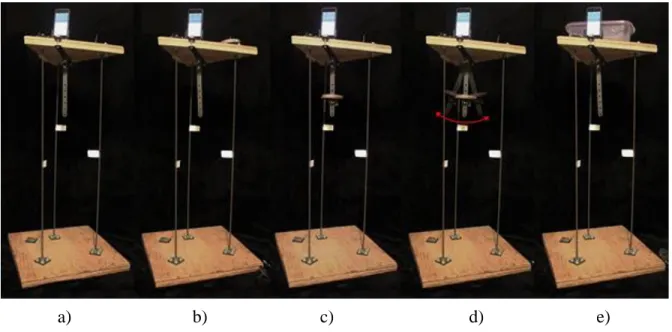
Student groups were instructed to conduct a free vibration test and collect acceleration data/video for one of the scenarios in Figure 4: (a) locked pendulum with no slotted weights, (b) locked pendulum with slotted weights fixed on the top of the structure, (c) locked pendulum with slotted weights on pendulum, (d) unlocked pendulum with slotted weights on pendulum, and (e) plastic container filled with water equivalent to weight of slotted weights (a measuring cup indicating the volume of water equivalent to one slotted weight is provided). Students were given a table of values summarizing weight of each components to determine the mass for the five scenarios. Once the data were recorded, students plotted the acceleration time history in Matlab and implemented the logarithmic-decrement method to determine the damping ratio and associated damping coefficient for conditions (a-b). Students used mass, calculated stiffness, and damping coefficient values to develop an equation of motion for damped free vibration and to plot the idealized displacement time history. Lastly, students commented on the damping values they calculated as well as trends they observed in the damped scenarios.
Figure 4. Test configurations for triangular frame model
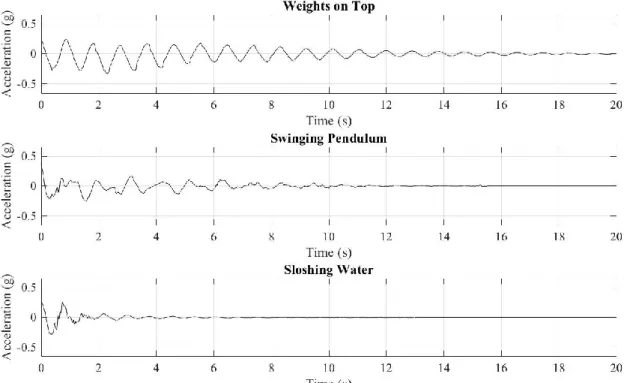
Figure 5 shows the measured acceleration time histories for three cases with essentially identical additional mass except how it is applied: slotted metal weights fixed to the upper mount (internal damping only), slotted metal weights hanging from an unlocked pendulum (internal + pendulum damper), or water (internal + sloshing damper). Students were able to observe the more rapid attenuation of oscillatory motion with the swinging mass pendulum and sloshing water, though the response amplitude was less periodic/predictable cycle-to-cycle. This is an attempt to capture the type of nonlinear control systems presented in virtual laboratory examples from Gao et al.8
Figure 5. Triangular frame model response for various damping approaches
Single Degree of Freedom System: Harmonic Forced Vibration
This activity used the steel column specimens described in “SDOF System: Free Vibration” to introduce students to the concept of dynamic amplification of static displacements due to a harmonic force input. Students first observed a frequency sweep for the 12- and 22- inch steel column models on a Quanser Shake Table II and helped identify resonant frequencies based on observed deformations. Students then used acceleration data collected prior to class of a
frequency sweep for the 22-inch steel specimen to experimentally determine natural frequency and damping ratio of this system. Figure 6 shows the two harmonic test set-ups on the shake table for the in-class portion and the frequency sweep data collection conducted prior to class. Note the orange clamps serve as additional mass for the SDOF system.
Figure 6. SDOF system shake table tests
To elaborate, the process of recording acceleration data for the frequency sweep was time intensive (upwards of two hours); therefore, it was not possible for students to record and analyze the data in a single three-hour lab session. To address this, the acceleration data were recorded by the authors beforehand, and the raw acceleration data was given to the students in a single Excel file. To perform the frequency sweep the following steps were executed:
determine approximate resonant frequency resonant based on observed response (1 Hz), select a total of 15-20 input frequency targets approaching resonance (0.5 to 3 Hz), input a single frequency target into the shake table,
collect at least 20-30 seconds of data with the smart phone accelerometer tool,
plot measured acceleration time history as well as peak acceleration (per time history) versus frequency to insure there were no erroneous readings,
repeat data collection if there are erroneous results
when results are accurate for the given frequency, continue to next frequency input, and when all frequencies have accurate results, compile acceleration time history data for
each frequency into an organized spreadsheet to provide students.
Students then determine the maximum value for the acceleration time history associated with each frequency to develop the experimental dynamic amplification curve of peak accelerations versus frequency as shown in Figure 7. Via peak picking they can determine the natural
frequency and using half-power bandwidth method they can calculate the damping ratio. Details on this process can be found in the full research project report.14
Figure 7. Experimentally determined dynamic amplification curve
Multiple Degree of Freedom System: Rigid Diaphragm (Physical Model)
One type of multiple degree of freedom (MDOF) structure explored in the course was a single-story rigid diaphragm structure with various configurations. Students derived the stiffness matrix by first determining the lateral stiffness of each wall, brace, and/or column, and implementing the direct stiffness method by applying a unit displacement to each DOF to resultant force; a similar logic was used to find the mass matrix. Once stiffness and mass matrices were known; students solved the eigenvalue problem to determine eigenvalues (natural frequencies) and eigenvectors (mode shapes).
Students find it straightforward to solve the eigenvalue problem, yet have difficulties
understanding that the response of a MDOF system is a combination of its modal responses. If a structure is oscillating at one of its natural frequencies, then the motion is harmonic, and the deformation pattern takes on the mode shape. However, earthquake ground motion excitations cause arbitrary displacements and therefore the structural response is described by the product of the mode shapes and modal displacements (the latter incorporates a modal participation factor that weights the contribution of each mode).
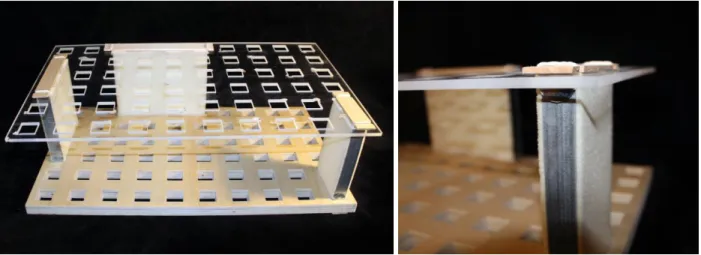
To help clarify these concepts, the single story diaphragm model shown in Figure 8 was
constructed. It consists of a rigid plexiglass diaphragm, foam shear walls, and a wood base plate. The plexiglass diaphragm and wood base plate each have a grid of cut-out square sockets to allow the shear walls to be arranged in any configuration. The shear walls and diaphragm connections were designed to prevent buckling while also exhibiting negligible out-of-plane stiffness and uplift. This diaphragm model was used in a lecture demonstration where a small unidirectional mass shaker was placed on top of the model, and the input frequency was increased until the natural frequency associated with one of the modes was reached. This was repeated for each of the modes which required for the shaker to be placed in different
orientations to clearly activate the different mode shapes.
Figure 8. MDOF rigid diaphragm system
Multiple Degree of Freedom System: Rigid Diaphragm (Virtual Experiment)
As indicated in Jacquot et al.7 and Gao et al.8 parametric experimental tests in structural
dynamics courses require considerable time and resources. A virtual model can be distributed to students to experiment as a homework exercise and can illustrate structural dynamics concepts difficult to physically model without specialized testing equipment. The example in the rigid diaphragm model discussed below is a MDOF system’s response to multi-directional ground motion; this cannot be achieved with the uni-directional shake tables or shakers available at Cal Poly and most other teaching institutions.
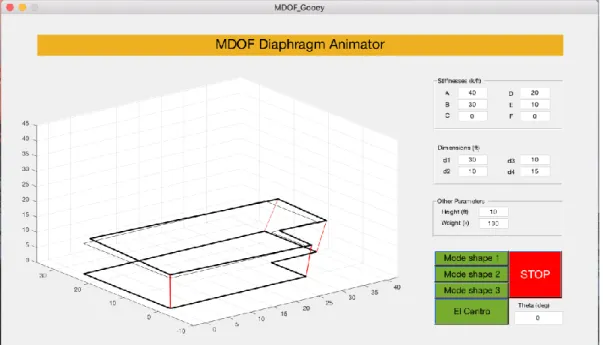
The MATLAB virtual diaphragm model, shown in Figure 9, is integrated into a homework assignment to complement the physical rigid diaphragm model demonstration conducted during lecture. The virtual model allowed students to change the mass and geometric configuration of the diaphragm as well as the locations, heights, and stiffness of columns, and automatically calculates the mass/stiffness matrices and mode shapes. It also determines the displacement time histories to produce animations of each mode shape and the response to the El Centro ground motion. The MATLAB scripts, functions, figures (Newmark’s Linear Acceleration Method used for numerical integration, El Centro ground motion data, and visual interface), and instructions are available to architectural/civil engineering instructors upon email request from the faculty co-author.
Figure 9. Rigid diaphragm virtual experiment
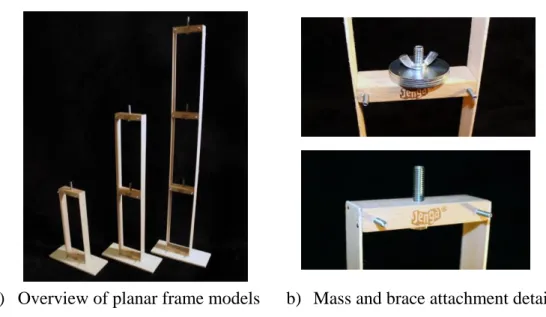
Multiple Degree of Freedom System: Planar Frames
portal frame models were developed to use on the shake table to explore resonance and mode shapes. At each story level there is a vertically oriented threaded rod to place washers to provide additional mass, and horizontal threaded rods to accommodate braces to increase the story stiffness.
Figure 10. Planar frame models
Summary of Student Assessment
All sixteen students enrolled in the W18 quarter provided consent for participation in the research study and completed a end-of-quarter survey with 23 multiple choice and 7 free response questions on the effectiveness of the lab activities, physical models, and
demonstrations.
General Multiple Choice Survey Questions
The general five-point Likert scale questions posed in the survey are summarized in Figure 11. Note that that rating scale is 5 =Strongly Agree, 1 = Strongly Disagree, unless otherwise noted. Also, not all students responded to every question (missing one respondent on Q3).
Q1. How well does the instructor coordinate the use of physical demonstrations or models in the course? (5 = Very Well, 1 = Poorly). Average Score = 4.19
Q2. The physical demonstrations or models provided a valuable visual reference when completing in class exercises, homework, or exams. Average Score = 4.13
Q3. Hands-on experiments, demonstrations, or models used in ARCE 354 were helpful in understanding structural dynamics concepts. Average Score = 4.33
Q4. The use of smart phones in lab (ie. accelerometer application) made data collection more interesting and accessible to me. Average Score = 4.19
Figure 11: Distribution of Student Responses to General Multiple Choice Questions
(5 = Strongly Agree, 1= Strong Disagree)
The responses were predominately positive or very positive for every question. Considering this was the first iteration of course with the new experimental/virtual experiments this was seen as a success. The co-authors identified several areas to improve the physical models and instructions on software usage (smart phone accelerometer application and Matlab) that were implemented in the Spring 2018 (S18) offering. In particular, the authors suspect that 25% of students indicated negative or neutral responses to use of the smart phone accelerometer application due to
difficulties using the application as data was truncated or did not save, and students had to re-record the data.
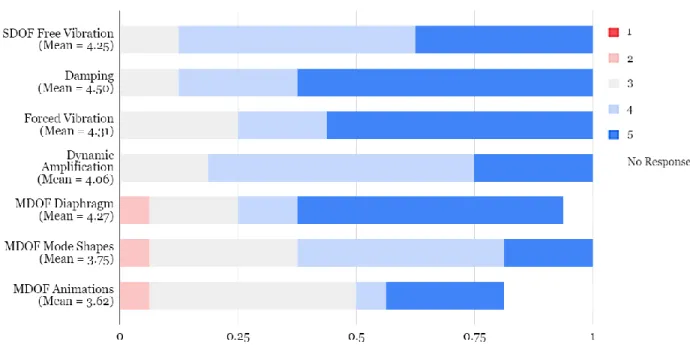
Specific Multiple Choice Questions
The following five-point Likert scale questions posed in the survey are on particular physical/ virtual experiments. Note the scale is 5 = Effective/Interesting, 1 = Ineffective/Uninteresting.
SDOF Free Vibration: Collecting acceleration data for SDOF of diff. materials/heights Damping: Collecting data with triangular model (sloshing/tuned-mass damper)
Forced Vibration: Conducting frequency sweep on column models using shake table Dynamic Amplification: Processing frequency sweep data to create an Rd curve
MDOF Diaphragm: Experimenting with a mass shaker on the diaphragm model MDOF Mode Shapes: Testing 3 story portal frame models on shake table (*video) MDOF Animations: Experimenting with MATLAB GUI to visualize mode shapes
Three clarifications on the list presented above:
1. The activity described in the section “SDOF System: Harmonic Forced Vibration” was divided into two questions as students experimented with the shake table without recording any acceleration data and then were given an Excel file with the acceleration time histories for a range of forcing frequencies to process with Matlab.
2. The MDOF Mode Shapes for portal frame refers to two videos of frequency sweeps (conducted by Professor Oh-sung Kwon while at Missouri S&T)18-19 rather than the
models described “MDOF System: Planar Frames” as there was not time to implement an experimental test with these models at the end of the W18 quarter.
Figure 12: Distribution of Student Responses to Specific Multiple Choice Questions, (5 = Effective/Interesting, 1 = Ineffective/Uninteresting)
The responses are generally positive, with only three negative responses total; however, there are a number of neutral responses. The questions here are ordered chronologically, and as the quarter progresses the rigor and speed of the course continues to increase. Furthermore, some of the later MDOF activities are observational (or optional), rather than hands-on experiments conducted by the students themselves. This may explain the trend seen in Figure 12, where the responses are mostly positive for the earlier lab activities, and wane slightly in later activities.
Free Response Questions
The survey included seven free response questions, three of which ask specifically about the physical models, lab activities, or demonstrations discussed in this document. The following list summarizes the general student sentiment on the new physical/virtual experiments incorporated in the W18 offering of ARCE 412/354:
Much of student understanding came from physically doing or seeing things, and the experiments were a welcome complement to learning they gained by practicing calculation problems in homework.
Lab activities increased their engagement with class topics, and students indicated that the hands-on activities were genuinely enjoyable as well. Some students indicated the desire for more activities or more time allocated for these types of activities.
There were a few student suggestions for modifications to the physical models to improve the conduct of experiments and accuracy of data acquisition.
Specific student quotes that focus on the benefits of the new course activities:
“I loved [the physical models, demonstrations, and/or experiments]! Visually seeing the concepts we discussed was incredibly beneficial because I am a visual learner.”
“The [physical models, demonstrations, and/or experiments] we had were very interesting. Just seeing how systems reacted really helped me in solving my calcs with more understanding.”
“I found that that lab experiments were very helpful in explaining concepts. Keep these! Or even create more”
“The homeworks and hands-on experiments [have been the most beneficial aspects of this course]. I found that the homework helped a lot with understanding the roles of variables and the experiments helped me with visualizing what is happening in my calcs.”
“Hands-on experiments [and] anything that is related to reality & industry [have been the most beneficial aspects of this course].”
Additional student quotes ranging from strongly positive to constructive feedback to improve physical experiments can be found in the full research project report.14
Lessons Learned
Beyond improving students’ intuition related to course concepts and associated calculation approaches, the instructor noted that students seemed more engaged in the small team, hands-on experiments than prior labs and more interested in ARCE 412/354 overall. After analyzing the student feedback responses and reflecting on instruction of this iteration of the structural dynamics course, the authors would like to provide the following lessons learned:
Students’ educational and personal experiences in structural dynamics are enriched
through visual and physical engagement with the models in lab experiments. Surveys in ARCE 412/354 indicate opportunities where students conduct their own test, collect data, and analyze results as most effective in building their structural engineering intuition and enjoyment of the topic. A near second is watching the instructor conduct a live physical demonstration that they can interact with, and the least effective is having students watch a video of a physical demonstration.
Students seek to connect their theoretical learning with the real world. Incorporating physical experiments into the course gives students the opportunity to use the equations taught in class to predict the behavior of a physical model, which they can compare to the experimental results. This comparison of theoretical and experimental results is not only engaging, but it makes students more confident that those equations are valid.
Students are able to create more descriptive lab reports when posed with an experimental rather than simply coding or calculation activity on a given topic. Previous to the new experiments, student reports were primarily a summary of their Matlab code and outputs. With the experimental activities, the lab reports have evolved to include experimental set-up photos and drawings, tables and graphs summarizing
Regular homework and testing is also important to ensure that students retain
theoretical material underlying the physical/virtual experiments. Lab activities are not meant to be a substitute for sample problems in lectures or homework, but rather a supplement. Students find that the analysis practice through calculations in assigned problems is critical to gaining a mastery of course concepts.
In implementing physical experiments in a structural dynamics course, time
management during lab instruction is critical. The critical comments received from students indicate there were not enough experiment set-up materials or activities to engage all group members throughout the lab activity. This could be resolved by building additional specimens/set-ups or more deliberate scheduling of lab tasks.
In the first time classroom implementation of physical models, construction quality of models and clear accompanying instructions are paramount. Student comments about construction quality and lab instructions were verbally solicited and noted at the end of each new lab activity. By the subsequent offering in S18, modifications had already been made to address these issues.
Acknowledgements
The authors would like to thank the skilled technicians and student assistants in the California Polytechnic State University – San Luis Obispo (Cal Poly) College of Architecture &
Environmental Design (CAED) shop for helping with model fabrication, including: Vincent Pauschek, Tim Dieu, David Kempken, and Jack Hazen. Thanks also go to Peter Laursen for providing his structural dynamics knowledge as the authors developed the physical/visual
experiments and for lending his small-scale eccentric mass shaker for the rigid diaphragm model demonstration. Finally, thanks to all the students that participated in this research study. The research in this paper was completed under IRB Approval No. 2018-075-CP from Cal Poly.
References
[1] Estrada, H., and Lee, L. (2009). Challenges of Teaching Earthquake Engineering to Undergraduates. Proceedings of the 2009 American Society of Engineering Education Conference.
[2] Kukreti, A.R., and Baseheart, M. (2002). Development of Small Scale Models for K12 and Undergraduate Students to Demonstrate Earthquake Effects on Building Structures and Aseismic Design Procedures. Proceedings of the 2002 American Society of Engineering Education Conference.
[3] Tito-Izquierdo, J., Gomez-Rivas, A., Feng, W., and Pincus, G. (2006). An Experiment Based Structural Dynamics Course for Engineering Technology Students. Proceedings of the 2006 American Society of Engineering Education Conference.
[4] Helgeson, R. (2006). An Interdisciplinary Vibrations/Structural Dynamics Course for Civil and Mechanical Students with Integrated Hands-on Laboratory Exercises. Proceedings of the 2006 American Society of Engineering Education Conference.
[6] Riley, C.R., Millar J.D., Lozano, S., and St. Clair, S. Using Mobile Devices to Teach Structural Dynamics and Structural Health Monitoring. Proceedings of the 2016 American Society of Engineering Education Conference. [7] Jacquot, R., Anderson, J., and Walrath, D. (2009). Damped Beams: A Versatile Matlab Script for the Animation of a Variety of Beam Vibration Problems. Proceedings of the 2009 American Society of Engineering Education Conference.
[8] Gao, Y., Yang, G., Spencer, B.F., and Lee, G.C. (2005). Java-powered Virtual Laboratories for Earthquake Engineering Education. Computer Applications in Engineering Education, 13(3), 200-212.
[9] Chopra, A.K. (2016). Dynamics of Structures, 5th Ed. Pearson Education.
[10] Estes, A.C., McDaniel, C.C., and Zavala, A. (2016). Enhancing an Upper Division Structural Dynamics Course Using K’nex Toys. Proceedings of the 2016 American Society of Engineering Education Conference.
[11] McDaniel, C.C., and Archer, G (2009). Developing a Feel for Structural Behavior. Proceedings of the 2009 American Society of Engineering Education Conference.
[12] McDaniel, C.C., and Archer, G. (2010). Improving Student Understanding of Structural Dynamics using Full-scale, Real-time Excitation of Buildings. Proceedings of the 2010 American Society of Engineering Education Conference.
[13] Archer, G., McDaniel, C.C., and Ramos, P.D. (2013). The Bridge House: A Living Dynamics Laboratory. Proceedings of the 2013 American Society of Engineering Education Conference.
[14] Facciolo, C., and Behrouzi, A. (2018). Hands-On Activities to Increase Student Engagement in Undergraduate Structural Dynamics Course. Report, DigitalCommons@CalPoly. https://digitalcommons.calpoly.edu/arcesp/61/ [15] DreamArc. (2016). Accelerometer (2.1.0). Mobile Application software. Retrieved from
https://itunes.apple.com/US/app/id499629589?mt=8
[16] Vieyra Software. (2017). Physics Toolbox Accelerometer (1.4.6). Mobile Application software. Retrieved from https://play.google.com/store/apps/details?id=com.chrystianvieyra.android.physicstoolboxaccelerometer&hl=en_US [17] UCIST. Instructional Shake Tables: University Consortium on Instructional Shake Tables (UCIST).
https://engineering.purdue.edu/UCIST/default.html
[18] Kwon, O-S (2008). MDOF System Forced Vibration. YouTube video. 28 October 2008. https://www.youtube.com/watch?v=OaXSmPgl1os