Gajul M.Det al IJSRE Volume 05 Issue 06 June 2017 Page 6533 Volume||5||Issue||06||June-2017||Pages-6533-6539||ISSN(e):2321-7545 Website: http://ijsae.in
Index Copernicus Value- 56.65 DOI: http://dx.doi.org/10.18535/ijsre/v5i06.06
Characterization of Groundwater using water quality index and GIS techniques of
Balatira watershed, Atpadi taluka, Sangli district, Maharashtra.
Authors
Gajul M.D1, Mujawar.K.C2, Prabhakar.P3
*School Of Earth Science,Solapur University,Solapur 413255
**Deptt of Civil Engineering, NBSCOE, Singhad Campus,Kegaon,Solapur 413255.
ABSTRACT
Groundwater, the most indispensable resource required for drinking. The resource cannot be optimally used and sustained unless the quality is assessed. Water Quality Index is one of the most effective tool for demarcating groundwater quality and its suitability for drinking purposes . The spatial distribution of groundwater quality in semiarid region of Sangli District is derived using the WQI and GIS techniques. The Balatira watershed covering an area of 278 Km2 forms a part of Krishna river watershed falling in drought effected Atpadi taluka in Sangli district of the state. It is bound by North Latitudes 17o 18’ and 17o 28’ and East Longitudes 74o42’ and 75o 00’ forming part of the toposheets 47O/11 and 47O/15. In the present study water samples from 35 wells are obtained for four seasons i.e pre-monsoon and post-monsoon period during 2014 and 2015. To determine the physicochemical parameter of groundwater samples namely Ec, TDS, pH , Ca, Mg, Na, K , SO4, HCO3 and Cl. Based on the founded physicochemical parameters, the water quality index has been computed for each well location. The derived water quality index of study area ranged from 61 to 650. The spatial variations of water quality index are generated from the sample wells location point layer by using spatial interpolation techniques of GIS environment. The examination of WQI for the Balatira watershed indicates a range from the class: unsuitable to good categories. On further examination, it is observed that the WQI for pre monsoon 2014 and 2015 have deteriorated quality compared to post monsoon 2014 and 2015. The influence of rain appears to improve water quality by way of dilutions of the chemical components.
Keywords: GIS, Physicochemical parameters, WQI, Balatira watershed
INTRODUCTION:
Gajul M.Det al IJSRE Volume 05 Issue 06 June 2017 Page 6534 different physico-chemical characteristics. These parameters change widely due to various types of pollution, seasonal fluctuation and groundwater extraction etc. The WQI is an effective tool to express water quality that offers a simple, stable, reproducible unit of measure and communicates the information on overall quality of water to the concerned citizens.
STUDY AREA:
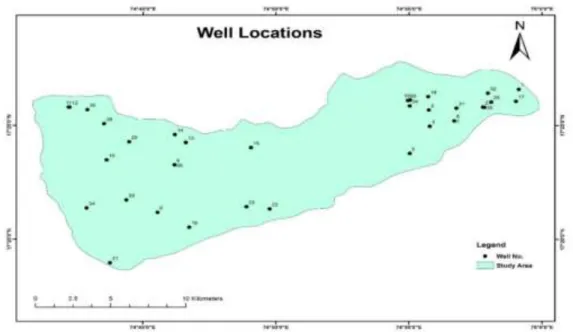
Balatira watershed is located in Atpadi taluka in north eastern part of Sangli district. In forms parts of Survey of India topographic sheets 47O/ 11 and 47O/ 15. It is bound by North latitudes 17o18‟ and 17o28‟ and East longitudes 74o42‟ and 75o0‟ covering an area of about 278 Km2 (see figure 1). The Balatira watershed is designated as BM 113 by GSDA and is a tributary of Man river. The area comprise of volcanic rock of Deccan trap with alternating layers of compact massive basalt and vesicular amygdaloidal basalts formed during the Cretaceous- Eocene times. „Aa‟ and „pahoehoe‟ lava flows of varying thickness constitute the lithology of the study area.
Figure 1.1 Location map of Balatira watershed, Sangli district, Maharashtra
MATERIAL AND METHODOLOGY:
Gajul M.Det al IJSRE Volume 05 Issue 06 June 2017 Page 6535 The concept of Water Quality Index (WQI) to represent gradation in water quality was first proposed by Horton (1965). WQI indicates a single number like a grade that expresses the overall water quality at a certain area and time based on several water quality parameters. WQI reflect a composite influence of contributing factors on the quality of water for any water system (Kakatti 2007). The water quality assessment may give clear information about the subsurface geologic environments in which the water is presents (Raju et al, 2011). The present study was carried out for quality analysis based on physico-chemical parameters of groundwater.
Figure 1: Illustrates locations of identified observation wells sampled in Balatira watershed.
WQI calculation: The water quality index (WQI) was calculated based on several key parameters of groundwater chemistry. To calculate the WQI, the weight has been assigned for the physico-chemical parameters according to the parameters, relative importance in the overall quality of water for drinking purpose. Using the physico-chemical data of groundwater samples of Balatira watershed the water quality index is calculated by the method proposed by Ravikumar et al, 2013. To calculate the WQI three steps are as follows:
In the first step, each of the all parameters has been assigned a weight (wi) according to its relative importance in the overall quality of water for drinking purposes. The assigned weight ranges from 1 to 5. The maximum weight of 5 has been assigned for nitrate and TDS, 4 for pH, EC, SO4, 3 for HCO3, Cl, 2 for Ca, Na, K and weight 1 assigned for magnesium (Vasanthavigar et al. 2010).
Second step, Relative weight (Wi) is computed from the following equation: Wi= wi/Σwn
Where (Wi) is the Relative Weight, (wi) is the Weight of each parameter and “n” is the number of parameters.
In the third step, a quality rating scale (qi) for each parameter is assigned by dividing its concentration in each water sample by its respective standard according to the guidelines laid down in the IS:10500(2012)and the result is multiplied by 100:
qi = (Ci/Si) x 100
Where qi is the quality rating, Ci is the concentration of each chemical parameter in each water sample in mg/l, and Si is the BIS (Bureau of Indian standards, 1998) water standard for each chemical parameter in mg/l except for conductivity (lS/cm) and pH. For computing the Water Quality Index (WQI), the SIi is first determined for each chemical parameter, which is then used for determine the WQI as per the following equation.
Gajul M.Det al IJSRE Volume 05 Issue 06 June 2017 Page 6536 Where SIi is the Sub Index of Ith parameter, qi is the rating based on concentration of ith parameter and n is the number of parameter.
RESULTS AND DISCUSSION:
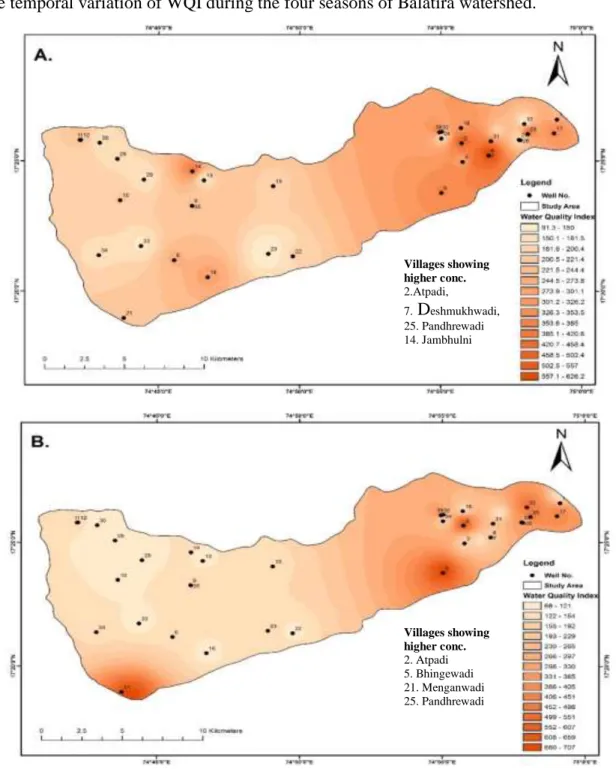
The WQI has been calculated from the data given in table 4.2 to 4.5 for the 35 samples collected from observation wells of Balatira watershed. The water quality index so calculated is given in the table 4.26 for pre-monsoon and post-monsoon seasons of the years 2014 and 2015. The figure 4.50 a & b and 4.51 c and d illustrate the temporal variation of WQI during the four seasons of Balatira watershed.
Figure 4.50: Maps showing the spatial distribution of WQI in groundwater samples from Balatira watershed during 2014 (A- pre-monsoon and B- post-monsoon)
Villages showing higher conc.
2.Atpadi,
7. Deshmukhwadi, 25. Pandhrewadi 14. Jambhulni
Villages showing higher conc.
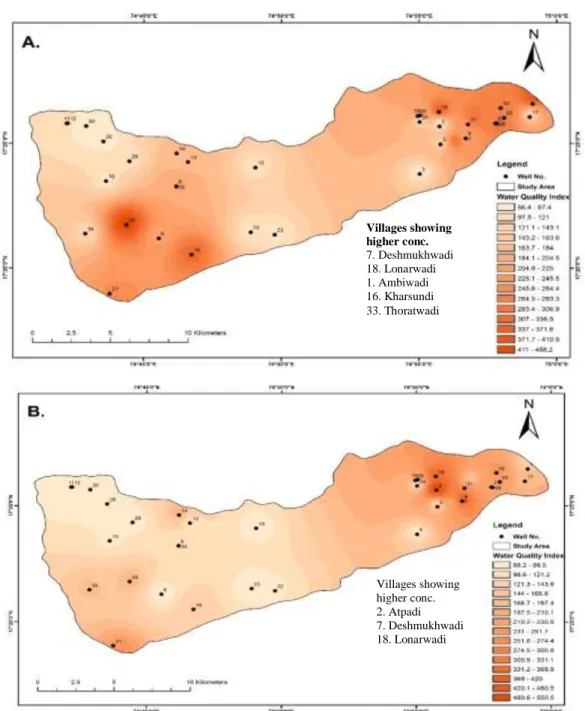
Gajul M.Det al IJSRE Volume 05 Issue 06 June 2017 Page 6537 Figure 4.51: Maps showing the spatial distribution of WQI in groundwater samples from Balatira watershed during 2015 (A- pre-monsoon and B- post-monsoon)
Table 4.26: Water Quality Index from Balatira watershed.
Sample no. Pre-monsoon 2014 Post-monsoon 2014 Pre-monsoon 2015 Post-monsoon 2015
1 237 123 383 131
2 495 650 80 554
3 290 163 130 119
4 457 121 302 219
5 357 711 89 89
6 251 139 212 71
7 629 196 216 375
8 474 630 550 262
9 295 117 86 61
10 202 93 89 88
11 182 126 119 66
12 232 132 90 81
Villages showing higher conc.
7. Deshmukhwadi 18. Lonarwadi 1. Ambiwadi 16. Kharsundi 33. Thoratwadi
Gajul M.Det al IJSRE Volume 05 Issue 06 June 2017 Page 6538
13 145 99 170 104
14 383 123 179 196
15 185 130 97 73
16 294 94 335 144
17 348 413 125 167
18 317 130 357 364
19 151 166 243 263
20 498 512 228 179
21 216 710 263 253
22 184 107 90 92
23 91 134 92 71
24 103 110 85 74
25 437 519 263 237
26 97 112 385 175
27 208 475 217 242
28 172 68 72 92
29 145 86 98 76
30 153 98 56 68
31 184 116 302 164
32 117 499 283 254
33 137 86 459 191
34 171 136 118 174
35 142 193 325 158
Figure 4.52: Illustrate water quality index for four seasons of Balatira watershed.
The WQI of the representative 35 samples were grouped under 5 class intervals as excellent ( WQI = less than 50), good ( WQI = 50 -100), poor (WQI= 100- 200), very poor (WQI= 200 – 300) and unsuitable (WQI = greater than 300). It is interesting to notice that the quality of water has improved in the watershed for the class – good from the first season ( pre-monsoon 2014) to fourth season (post-monsoon 2015).
CONCLUSION:
The category of good WQI has shown progressive rise in number percentage of samples from 6% to 20 % samples in 2014 and 33% to 37% samples in 2015. Consequently the unsuitable category having greater
2
7
12 13
15 19 6 12 9 0 9 7
10 9 9
3 0 5 10 15 20
Pre-monsoon 2014 Post.monsoon 2014 pre-monsoon 2015 Post-monsoon 2015
No. of S am pl es
Water Quality Index
Gajul M.Det al IJSRE Volume 05 Issue 06 June 2017 Page 6539 than 300 WQI has fallen from 28% to 26% samples during 2014 and from 25% to 9% samples during 2015. The increase in recharge structures such as percolation tanks, villages tanks, nala bunding etc. during 2014 has certainly benefitted in improving the WQI of groundwater for potability in the Balatira watershed. The details of the samples in each of the class interval is shown in the tables 4.27a, b, c and d for the four seasons and a consolidated representative is illustrated as in figure 4.52.
The spatial distribution map indicating temporal variation in WQI for Balatira watershed during four seasons is illustrated in figure 4.50 and 4.51. In pre-monsoon 2014, the higher contours values are noticed at Atpadi, Deshmukhwadi, Pandhrewadi and Jambhulni villages and in post-monsoon are at Atpadi, Bhingewadi, Pandhrewadi and Menganwadi villages are unsuitable for drinking purpose. In pre-monsoon 2015, the higher WQI values are observed at Lonarwadi, Ambiwadi, Kharsundi and Thoratwadi villages and in post-monsoon the groundwater samples from Atpadi, Deshmukhwadi and Lonarwadi villages shows higher contour values which are unsuitable for drinking purpose.
REFERENCES :
1. Ravikumar, P., Mohammad Aneesul Mehmood and R. K. Somashekar (2013). Water quality index to determine the surface water quality of Sankey tank and Mallathahalli Lake, Bangalore urban district, Karnataka, India. Appl Water Sci, DOI 10.1007/s13201-013-0077-2.
2. Vasanthavigar, M., K. Srinivasamoorthy, K. Vijayaragavan, R. Ganthi, S. Chidambaram, P. Anandhan, R. Manivannan & S. Vasudevan, (2010). Application of water quality index for groundwater quality assessment: Thirumanimuttar sub-basin, Tamil Nadu, India. Environ Monitoring Assess, DOI 10.1007/s10661-009-1302-1.
3. Mohrir A. Ramteke D.S.,Moghe C.A., Wate S.R. and Sarin R. 2002. Surface and Groundwater Quality Assessment in Bina region", IJEP.Vol.22(9).
4. Shrivastava, K.B.L., Mishra, S.P. and Mallick, N. (2014). Ground Water Quality Assessment of Birsinghpur Area, Satna District, Madhya Pradesh, India. Journal of Innovative trends in Science, Pharmacy & Technology, 1(1): 125-133.
5. Giriyappanavar, B.S. and Patil, R.R. (2013) – Monitoring water quality of two lake of Belgaum district (Karnataka) with special reference to phytoplankton‟s
6. Jena, V., Dixit, S. and Gupta, S., (2013), Assessment of Water Quality Index of Industrial Area Surface Water Samples, International Journal of Chemical Technology and Research, 5(1), pp 278-283.