Dr Sonam Bansal et al JMSCR Volume 06 Issue 07 July 2018 Page 333
Study of Effect of Age and Gender on ECG Pattern in Normal Paediatric
Population of Rajasthan
Authors
Dr Sonam Bansal
1, Dr Manish Agarwal
2*, Dr Kavita Yadav
3,
Dr Yogesh Yadav
4Dr Raghuveer Choudhary
51
MSc Medicine (Physiology) Student, Dept. of Physiology, DR. S.N. Medical College, Jodhpur, Rajasthan 2
Resident, Dept. of Pediatrics, SMS Medical College, Jaipur, Rajasthan 3
PhD Scholar, Dept. of Physiology, SMS Medical College, Jaipur, Rajasthan 4
Assistant Professor, Dept. of Pediatrics, SMS Medical College, Jaipur, Rajasthan 5
Associate Professor, Dept. of Physiology, DR. S.N. Medical College, Jodhpur, Rajasthan *Corresponding Author
Dr Manish Agarwal
Resident, Dept. of Pediatrics, SMS Medical College, Jaipur, Rajasthan, India
Abstract
Background: The most cardiologists who care for adults have no or minimal experience with electrocardiograms (ECGs) recorded in infants. So far, this has had no practical implications because only seldom are they requested to examine a neonatal ECG. To established or find out normal developmental, age and sexes related changes in ECG pattern with their normal variation, facilitate the evaluation of the ECG in children by producing clear, easily understandable graph and tables, established data bank of ECG from normal children that will serve as normal limit/reference value for screening and eventually diagnostic interpretation of ECG and find out peak age at which child's heart attained adult ECG variant.
Material and Methods: The present study was conducted on healthy or apparently healthy 200 subjects of paediatric age groups population (Birth to 14 years) of either sex. Those who attended the post natal wards, immunization clinics and hospitals of Jodhpur district and the students of various schools were the subjects of this study. The age was confirmed by hospital record, birth certificate and school records. Periodically visit to child health centers was done for a physical-clinical examination and ECG recording.
Results:In our study the mean value of the R-wave amplitude in V6 for children aged 8-12 years is 1.2mv as compared to PR Rijnbeek, et al 2001, 2•09 mV and 1•68 mV in the study of Davignon et al. Higher R-wave amplitudes in V6 were also presented by Macfarlane et al, who found a mean R-R-wave amplitude in V6 of 1•9 mV for children aged 5-12 years.
Conclusion:In our study the incidence of congenital heart disease is 5/1 000 live birth, may be still lower than the developed country. Significant sex differences could be demonstrated for amplitude measurements and QRS duration. ECG parameters are useful for the interpretation of paediatric ECG, in circumstance of western Rajasthan.
Keywords:ECG, QRS duration.
www.jmscr.igmpublication.org Impact Factor (SJIF): 6.379
Dr Sonam Bansal et al JMSCR Volume 06 Issue 07 July 2018 Page 334
Introduction
Interpretation of pediatric electrocardiograms (ECGs) can be challenging for the Emergency Physician. Part of this difficulty arises from the fact that the normal ECG findings, including heart rate, rhythm, axis, intervals and morphology, changes from the neonatal period through infancy, childhood, and adolescence. These changes occur as a result of the maturation of the myocardium and cardiovascular system with age. Along with these changes, up to 20% of pediatric ECGs obtained in the acute setting may have clinically significant abnormal findings, including the variety of congenital heart diseases seen in children.1 interpretation of ECGs in children; including heart rate, rhythm, axis, intervals and morphology, change from the neonatal period through infancy, childhood, and adolescence. The age-related findings and alterations on the normal pediatric ECG, associated with pediatric cardiac diseases, including the congenital heart diseases seen in children. The electrocardiogram (ECG) is a graphic recording of electric potentials generated by the heart the signals are detected by means of metal electrodes attached to the extremities and chest wall and are than amplified by sensitive voltmeter, such as the electrocardiograph. It is a quick, non invasive, inexpensive and highly versatile test. The normal heart rate in neonates varies between 91-166 beat /min and attain the normal adult value 60-119,(85) beat /min at the age of 12-14 years. The heart rate >140 beat / min (85-125) in 2 year of age and >160 beat /min (110-150) in infants is significant, but less than 200 beat/min is considered as sinus tachycardia. The heart rate < 60 beat / min in children at 2 year of age and <80 beat / min in infants is considered as sinus bradycardia.
Established or find out normal developmental, age and sexes related changes in ECG pattern with their normal variation. Facilitate the evaluation of the ECG in children by producing clear, easily understandable graph and tables. established data bank of ECG from normal children that will serve as normal limit/reference value for screening and
eventually diagnostic interpretation of ECG. find out peak age at which child's heart attained adult ECG variant.
Material and Methods
The present study was conducted on healthy or apparently healthy 200 subjects of paediatric age groups population (Birth to 14 years) of either sex. Those who attended the post natal wards, immunization clinics and hospitals of Jodhpur district and the students of various schools were the subjects of this study. The age was confirmed by hospital record, birth certificate and school records. Periodically visit to child health centers was done for a physical-clinical examination and ECG recording. The children with previously known cardiovascular abnormalities were excluded from the study. The total population was divided into five age groups, similar to the grouping used by Tarek Ahmed et al 1984.2 All children up to 1 month of age were combined in one group, because of the relatively small sample size. Each group is subdivided to made subgroup according to sex, male/female. For each child, weight, height, physical and clinical examination was done prior to record the ECG. Data for weight and height corresponded well with the WHO / API growth standard. The study was approved by the local ethics committee. All the subjects, his or her attendants were explained the purpose of this study and each subject was carefully and completely examined with a full history (present + past history) of illness.
Results & Discussion
Dr Sonam Bansal et al JMSCR Volume 06 Issue 07 July 2018 Page 335 for children aged 5-12 years. the upper limits of
normal of the R-wave amplitude in V6 are substantially lower in our study, e.g. 1.7 mV for children aged 5-8 years compared to PR Rijnbeek et al 20013, is 3.14 mV and 2•65 mV in the study of Davignon et al.4 Notably, the upper limit of normal of the R-wave amplitude in V3R, V2 and especially V 4 is lower in almost all age groups. For instance, Davignon et al4 report an upper limit of normal of 4•5mV in V4 for children aged 3-5 years, and 3•27 m V reported by PR Rijnbeek, et al 20013, are quite higher as compared to 2.9 mV in our study. R-wave amplitudes in V4 larger than 3•5 mV are exceptional in our material. S-wave amplitudes are considerably lower than the reported by PR Rijnbeek, et al 20013, and quite similar as compared to Davignon et al4 in V6 for all age groups, and in V 4 after 3 years of age. In the other precordial leads the S-wave amplitude is comparable in most age groups. These findings suggest that the amplitude criteria for ventricular hypertrophy should be adjusted. Influence of sex differences on the paediatric ECG has been reported III a number of studies (Strong WB
19725, Macfarlane PW 19946, Pearl W 19967, Walker CHM, 19618 and Rautaharju PM 19929). However, to our knowledge this is the first study that examined sex differences in amplitude measurements for children in all age groups in Rajasthan. In our study, amplitudes of the Q, Rand S waves are higher for boys than for girls especially during adolescence.
The ECGs of healthy children change markedly from birth to young adulthood. Knowledge of the normal variation of ECG measurements with age is essential for proper interpretation of the paediatric ECG. Previous studies that determined normal limits for the paediatric ECG had discrepancy in their normal limits: In this study, ECGs were recorded at a relatively low sampling rate, ECG measurements were taken manually, or normal limits were presented only for a limited set of parameters, as in study of Devignon et al 19794. While in some other studies, the normal limits of ECG parameters were based on computerized analysis of a large set of ECGs recorded at a high sampling rate, thus obviating some discrepancy with previous studies.
Table 1: Mean p wave amplitude with age and sex
Table 2: PR Interval (sec.) in lead II
Age Group Sex Min 2%ILE Mean 98%ILE Max No. sub.
0 – 1 mnth M 0.06 0.64 0.09 0.118 0.12 10
F 0.06 0.06 0.09 0.17 0.18 10
>1m – 1 yr M 0.06 0.06 0.095 0.138 0.14 10
F 0.04 0.045 0.10 0.176 0.18 10
>1yr – 4 yr M 0.1 0.1 0.129 0.156 0.16 10
F 0.06 0.06 0.1 0.156 0.16 10
>4yr – 6 yr M 0.12 0.12 0.134 0.16 0.16 10
F 0.08 0.083 0.128 0.16 0.16 10
>6 yr – 14 yr M 0.12 0.12 0.132 0.156 0.16 10
F 0.12 0.12 0.136 0.16 0.16 10
Age Group P wave duration(sec.) in Lead II P wave amplitude(mV) in Lead II
Sex Min 2%ILE Mean 98%ILE Max. Min 2%ILE Mean 98%ILE Max No. sub.
0-1mnth M 0.05 0.05 0.07 0.1 0.1 0.15 0.15 0.19 0.25 0.25 10
F 0.04 0.04 0.06 0.08 0.08 0.05 0.06 0.13 0.19 0.2 10
>1m- 1yr M 0.03 0.03 0.06 0.08 0.08 0.1 0.1 0.135 0.19 0.2 10
F 0.05 0.05 0.07 0.084 0.084 0.15 0.15 0.176 0.24 0.25 10
>1yr-4 yr M 0.06 0.06 0.078 0.1 0.1 0.1 0.1 0.148 0.24 0.25 10
F 0.06 0.06 0.084 0.178 0.2 0.1 0.1 0.146 0.2 0.2 10
>4yr- 6yr M 0.06 0.06 0.08 0.1 0.1 0.1 0.1 0.109 0.144 0.15 10
F 0.06 0.06 0.08 0.1 0.1 0.1 0.1 0.115 0.158 0.16 10
>6yr-14yr M 0.06 0.06 0.08 0.1 0.1 0.1 0.1 0.115 0.15 0.15 10
Dr Sonam Bansal et al JMSCR Volume 06 Issue 07 July 2018 Page 336
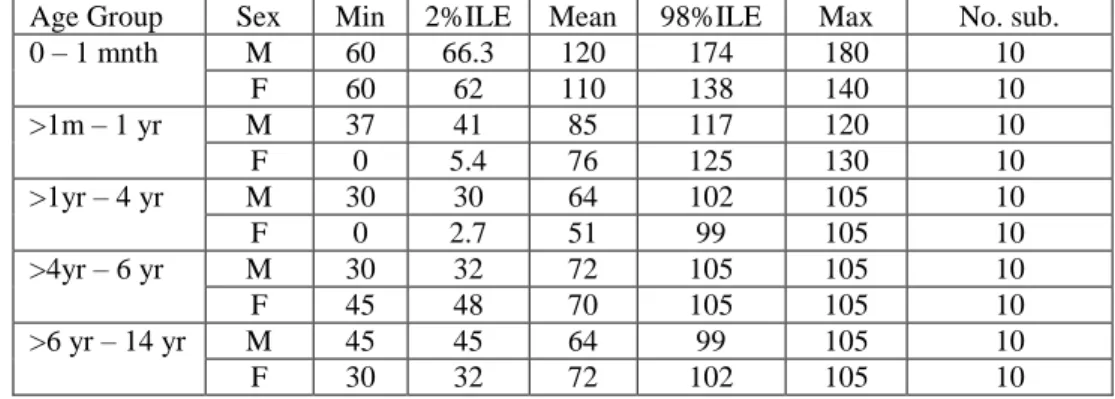
Table 3: QRS axis with age and degree
Age Group Sex Min 2%ILE Mean 98%ILE Max No. sub.
0 – 1 mnth M 60 66.3 120 174 180 10
F 60 62 110 138 140 10
>1m – 1 yr M 37 41 85 117 120 10
F 0 5.4 76 125 130 10
>1yr – 4 yr M 30 30 64 102 105 10
F 0 2.7 51 99 105 10
>4yr – 6 yr M 30 32 72 105 105 10
F 45 48 70 105 105 10
>6 yr – 14 yr M 45 45 64 99 105 10
F 30 32 72 102 105 10
Graph 1: Mean p wave amplitude with age and sex
Graph 2: Mean PR interval with age and sex 0
0.02 0.04 0.06 0.08 0.1 0.12 0.14 0.16 0.18 0.2
0-1mnth 1mnth- 1 yr 1 yr - 4 yr 4 yr - 6 yr 6 yr - 14 yr
P
w
av
e
Am
p
litd
e
Age group
Mean P wave Amplitude with age and sex
Male Female
0 0.02 0.04 0.06 0.08 0.1 0.12 0.14 0.16
0-1mnth 1mnth- 1 yr 1 yr - 4 yr 4 yr - 6 yr 6 yr - 14 yr
PR
In
terv
al
Age Group
Mean PR interval with Age and Sex
Dr Sonam Bansal et al JMSCR Volume 06 Issue 07 July 2018 Page 337
Graph 3 : QRS axis with age and degree
Conclusion
Congenital heart disease is 5/1 000 live births, may be still lower than the developed country. (8.8/1 000 live birth, Hoffman et al 1978). Significant sex differences could be demonstrated for amplitude measurements and QRS duration. These findings are clinically significant and suggest that diagnostic criteria for the paediatric ECG should be adjusted. Normal limits of many ECG measurements were shown to differ from those reported earlier. So we are, therefore, hopeful that these sex specific ECG parameters are useful for the interpretation of paediatric ECG, in circumstance of western Rajasthan.
References
1. Theodore C. Chan et al.
Electrocardiographic Manifestations: Pediatric ECG. Journal of Emergency Medicine 2008;35(4):421-30.
2. Tarek Ahmed et al. Equations of state and PVT analysis: Application for improved reservoir modeling. Gulf publishing Co., Houston, Texas.
3. Rijnbeek PR, Witsenburg M, Schrama E, Hess J, Kors JA. New normal limits for the paediatric electrocardiogram. Eur Heart J 2001; 22: 702-11.
4. Davignon A, Rataharju P, Bossdle E, et al, Normal ECG standards for infants and children. Pediatr Cardiol 1979: 123-31. 5. Strong, WB, Liebman, J, Downs, T.D. and
Liebowitz, R. The adolescent electrocardi-ogram. American Heart Journal Vol. 83, pp. 115–28.
6. Macfarlane PW, McLaughlin SC, Devine B, Yang TF. Effects of age, sex, and race on ECG interval measurements. J Electrocardiol. 1994;27 Suppl:14-9.
7. Pearl W. The Pearl Oyster. Elsevier. 8. Walker, C.H.M., Blackwell, L.,
Massengale, O. (1961) A new electronic blood level indicator. Journal of Applied Physiology, 16, 925–927.
9. Rautaharju PM et al. Sex differences in the evolution of the electrocardiographic QT interval with age. Can J Cardiol. 1992 Sep;8(7):690-5.
0 20 40 60 80 100 120 140
0-1mnth 1mnth- 1 yr 1 yr - 4 yr 4 yr - 6 yr 6 yr - 14 yr
QRS
Axis
Age group