MEASUREMENT OF HEAD IMPACT BIOMECHANICS: A COMPARISON OF THE HEAD IMPACT TELEMETRY SYSTEM AND X2 BIOSYSTEMS xPATCH
Alessa Rae Lennon
A thesis submitted to the faculty of the University of North Carolina at Chapel Hill in partial fulfillment of the requirements for the degree of Master of Arts in the Department of
Exercise and Sport Science (Athletic Training) in the College of Arts & Sciences.
Chapel Hill 2015
Approved by:
Jason P. Mihalik
Kevin M. Guskiewicz
Robert C. Lynall
Luke M. Ross
ABSTRACT
ALESSA RAE LENNON: Measurement of Head Impact Biomechanics: A Comparison of the Head Impact Telemetry System and X2 Biosystems xPatch
(Under the direction of Jason P. Mihalik)
The purpose of this study was to capture on-field head impact data from the HIT
System and xPatch concurrently in order to gain a broader understanding of their ability to
appropriately measure head impact biomechanics. Nine collegiate football players
participated in this study. We used video analysis to record head impacts during three game
sessions. Our findings reveal a moderate correlation between the HIT System and xPatch in
measuring linear acceleration and HITsp, and low correlation in measuring rotational
acceleration. Our findings also reveal poor agreement in impact location between the
recorded impact location of the HIT System and xPatch, and the actual impact location
verified by video analysis. Additional analyses revealed the number of false positive head
impacts recorded and allowed us to estimate total head impact exposure. Future research
should investigate head impact biomechanics in non-helmeted sports and test the xPatch in a
TABLE OF CONTENTS
LIST OF TABLES ... vi
LIST OF FIGURES ... vii
CHAPTER I: INTRODUCTION ... 1
Clinical Significance ... 3
Specific Aims & Hypothesis ... 3
CHAPTER II: REVIEW OF THE LITERATURE ... 4
Overview ... 4
Validation of the HIT System ... 5
Literature Involving the HIT System ... 6
Relation to Concussion ... 11
Limitations of the HIT System ... 13
New Methods ... 14
Rationale for Study ... 15
CHAPTER III: METHODOLOGY ... 16
Participants ... 16
Instrumentation ... 16
Head Impact Telemetry System ... 16
X2 Biosystems xPatch ... 17
Video Analysis ... 17
Data Reduction ... 19
Statistical Analysis ... 19
CHAPTER IV: MANUSCRIPT ... 22
Introduction ... 22
Methods ... 24
Participants ... 24
Instrumentation ... 24
Procedures ... 26
Data Reduction ... 27
Statistical Analysis ... 28
Results ... 28
Discussion ... 29
LIST OF TABLES
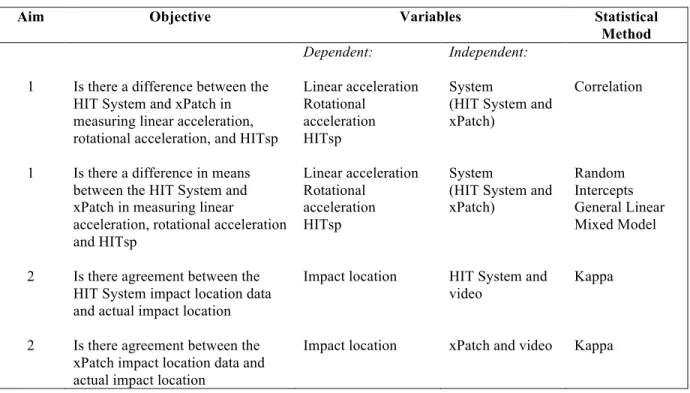
Table 3.1. Statistical Analysis Plan...21
Table 4.1. Descriptive Statistics and Means Comparison………...37
Table 4.2. Impacts Verified by Video……….38
Table 4.3. Capture-Recapture Analysis………..….39
LIST OF FIGURES
CHAPTER I INTRODUCTION
Approximately 3.8 million sport-related traumatic brain injuries (concussions) occur
each year in the United States, with football annually accounting for the most concussions.1 It is reported that each year 5-10 concussions occur per college football team,2 and that a single collegiate football athlete may sustain as many as 1,400 head impacts in a single season.3 Furthermore, athletes sustain a greater number of head impacts as well as impacts of a higher
severity on days of a diagnosed concussion.4 Concussion research is continually evolving and expanding, including injury management, and the study of long-term effects and deficits
believed to be associated with concussion. One supplementary tool to study and help develop
concussion injury risk curves includes head impact biomechanics.5
Early investigation of head impact biomechanics consisted of laboratory methods
utilizing the Hybrid III Headform to reconstruct on-field head impacts resulting in
concussions from National Football League (NFL) video footage.6 Since 2003, the Head Impact Telemetry (HIT) System has been used in numerous studies for objectively measuring
head impact biomechanics in youth, high school, and collegiate football and hockey players
in on-field settings.3,7,8 Research using the HIT System has reported head impact exposures,9 identified positional differences in exposure and impact magnitude,10 frequency and location of head impacts,3 and correlated head impact biomechanics with clinical outcomes.11
Additionally, using the HIT System has advanced our ability to track head impact trends over
biomechanical data on days of a diagnosed concussion.4,12,13Although extensive research has been conducted with the purpose of relating head impact biomechanics to concussion, a
biomechanical concussion injury threshold for magnitude of impact remains elusive to
clinical researchers.14-16
Although research with the HIT System has provided much insight into head impact
biomechanics, in-vivo analysis has been restricted by licensing agreements limiting the study
of football head impact biomechanics to those who wear Riddell helmets capable of
accepting the HIT System accelerometer units. More recently, non-helmet based technologies
capable of measuring head impact biomechanics have become an option to clinical
researchers. These technologies are not restricted to one particular helmet brand, and
introduce the potential for the widespread study of athletes in helmeted and non-helmeted
sports. One of these technologies includes the xPatch (X2 Biosystems, Seattle, WA). The
xPatch system is designed to measure head impact biomechanics and store the data for later
downloading and post-impact processing. The xPatch possesses many benefits including, but
not limited, to the following: 1) relative low cost, 2) use in helmeted and non-helmeted
sports, 3) a small form factor, and 4) a long battery life. However, how these two systems
compare during in-vivo data collection remains unstudied.
In exploring head impact biomechanics in-vivo, video footage has previously been
used in football and ice hockey events.17,18 However, on-field head impact location data from the HIT System have yet to be verified with video analysis and no published reports exist on
the xPatch. Therefore, the purpose of this study was to capture on-field head impact data
from the HIT System and xPatch concurrently in order to gain a broader understanding of
was to compare the HIT System and xPatch on measures of linear acceleration, rotational
acceleration, and HITsp in college football players. Our second aim was to verify
system-determined head impact locations based on video-observed head impact locations.
Clinical Significance
Historically, sport-related head impact research has focused mainly on a limited
group of football and ice hockey athletes due to the expensive nature and limitations of the
HIT System. Newer devices, such as the xPatch, developed to objectively measure head
impacts have not been extensively tested in-vivo. If the xPatch is valid for measuring linear
acceleration, rotational acceleration, frequency, and location of head impacts, then
researchers may be able to use these devises to gather more data from more sports, to better
prevent needless head injuries, and to support interventions designed to prevent further
injury. Knowledge gained from these additional data can also be used to improve future
concussion management protocols.
Specific Aims & Hypothesis
Specific Aim 1: To determine system differences in linear acceleration, rotational acceleration
and HITsp of head impacts in college football athletes.
Hypothesis: There will be a significant correlation between the HIT System and
xPatch on measures of linear acceleration, rotational acceleration, and HITsp in
college football players.
Specific Aim 2: To determine the agreement between system-determined head impact
location and location based on video observation.
Hypothesis: There will be an agreement between both systems’ impact location data
CHAPTER II
REVIEW OF THE LITERATURE Overview
The Head Impact Telemetry (HIT) System has been used to better understand head
impact biomechanics in American football players. Often the purpose of studies utilizing this
technology is to measure and analyze head accelerations.7 Dependent variables that have previously been measured include the magnitude of peak linear acceleration, peak rotational
acceleration, impact frequency and impact location of head impacts.3,14,18 Data collected with this technology have been used to investigate differences between head impacts sustained by
player position,3,19 session type (limited contact practice, full contact practice, game),3 helmet type,20 effect of play type,18 and various helmeted sports at different levels of play.14,19,21,22 Location of head impacts have often been characterized by whether the impact occurred in
the front of the helmet, back of the helmet, side of the helmet or top of the helmet.14,21 The first series of studies to analyze head impact biomechanics in NFL games used
video analysis of plays that resulted in concussion, aimed at determining the speed and
direction of head impacts.6,23 The reconstruction of the head impacts were conducted in a laboratory using the Hybrid III Headform.24 Without the use of video analysis, there is no way to re-create head impacts in the laboratory using the Hybrid III Headform. Subsequent
research using the same data from the NFL assessed the accuracy of the linear and rotational
estimated difference between the video reconstruction and actual linear acceleration was 17%
and up to 25% for rotational acceleration. Initial studies aimed at addressing head impact
biomechanics demonstrated the need for additional research and technology that could be
utilized in-vivo.
Validation of the HIT System
The HIT System has been studied in both the laboratory and on the field during
athletics.7,26-29 Video analysis has been used in conjunction with the Head Impact Telemetry (HIT) System in order to link impact data collected through time synchronization, allowing
researchers to ensure that the data collected is a result of an impact that occurred during
play.18 In a laboratory, the Hybrid III Headform is the gold standard for measuring linear and angular acceleration of head impacts.30 Laboratory testing has compared impacts measured by the HIT System to those measured by the Hybrid III Headform, using data from the NFL
that describe head impact locations that most frequently result in concussion.24,31 The four primary impact sites tested were to the front of the facemask, side of the face mask, side of
the helmet, and back of the helmet.24 Impact location is defined by azimuth and elevation, measured in degrees. The angle of elevation is defined as the impact directional vector
through the head center of gravity and a horizontal plane through the head center of
gravity.5,24 The azimuth angles are based on the midsagittal and coronal planes, and are used to measure impacts to the front, side and back of the head. Each site was impacted three to
five times at four target speeds including 4.4, 7.4, 9.3 and 11.2 m/s based on data showing
the average impact velocity for head impacts associated with and without a concussion.24,31 Results show a high correlation for peak linear acceleration between the HIT System and
tested (r2 = 0.710–0.981), with the exception of impacts to the facemask (r2 = 0.415). Impacts to the facemask resulted in a large difference, with 31.2 ± 46.3° noted when
considering all impact locations tested, but only a 13.2 ± 6.3° difference when excluding
impacts to the facemask.24 Overall there is a high correlation between the HIT System and Hybrid III Headform, and impact location was deemed within practical reason for on-field
use.7,24
Limitations of studies validating the HIT System is that the data have been collected
in a laboratory with precision equipment that is unable to be used in-vivo, technical expertise
required to use the technology, high cost, and reports that the medium helmet used in testing
does not accurately depict how most football players wear their helmet.24,30 Therefore, assumptions must also be made that the human surrogate models would act like a live
participant.24 Furthermore, as compared to the Hybrid III Headform, the HIT System in its current commercially available design is only capable of linear acceleration measures as it
utilizes 3 degrees of freedom (DOF) to reduce the cost and computation time required for
processing head acceleration measurements.24 As a result, a mathematical algorithm for estimating the magnitude of rotational acceleration and impact location using single-axis
accelerometers was developed and validated in the literature as an accurate estimation of
rotational acceleration.24,27,32
Literature Involving the HIT System
Research utilizing the HIT System has focused on many variables including the
1400 impacts in a single season, with player position having a role in the head impact
exposure, impact location, and impact magnitudes.3,9,21 In a study of college football players with a total of 286,636 impacts analyzed, the median number of impacts for one season
ranged from quarterbacks with 149 impacts to defensive linemen sustaining 718 impacts.9 Results from high school and college football players indicated that defensive linemen,
linebackers, and offensive linemen sustained a higher frequency of impacts per season, while
quarterbacks and wide receivers had the lowest impact frequency.9,14 However, many discrepancies also exist in the literature with the degree of correlation between head impacts
and player position when considering head impact magnitude. When accounting for impact
magnitude in college football players, offensive backs were more likely to sustain an impact
greater than 80 g than defensive linemen, defensive backs, linebackers, wide receivers and
offensive linemen.9,10 This is consistent with data from both high school and college levels that report skill position players receive a higher percentage of increased magnitude of
impacts, and that linemen sustained an overall greater number of impacts, but at a lower
magnitude.21,22
Although similar when comparing player positions, differences between youth, high
school, and college athletes have been noted in the literature. College football players sustain
a higher frequency of high magnitude impacts greater than 98 g, and a lower frequency of
head impacts greater than 60 g compared to high school athletes.22 In high school athletes the mean linear acceleration for both games and practices was larger than reported in college
athletes with a mean linear acceleration for impacts across all session types of 24.98 g, as
Although the mean linear acceleration is slightly greater, the clinical significance of the
difference is unclear.14
Head impact exposure also varies between levels of play, with far fewer head impacts
in younger athletes. In youth football players aged 7-8 years old, an average of 107 head
impacts are sustained over the course of a season. As youth football players become older,
the number of head impacts increases. It is reported that youth football players aged 11-13
years old sustain a median of 252 head impacts over the course of a season, with a median of
9 impacts occurring during each practice session and 12 impacts per game.33 One explanation for the differences in head impact exposure in varying levels of play is the increase in the
total hours of contact exposure, with longer seasons and an increase in practice and games
sessions as the level of play becomes more competitive.
Differences in practice and game sessions as well as play type have been investigated
in high school and college football players. At both levels of play, a greater number of head
impacts occur during games as compared to practices.3,14 In college football players, the average number of impacts per game was nearly three times greater than the number of
impacts per practice.3 Although differences in impact frequency between game and practice sessions are consistent among studies, there are inconsistencies between studies when
considering impact magnitudes and session type. One study has reported that game impacts
have higher linear acceleration and rotational acceleration than practice impacts, while
another has reported no increase in magnitude between sessions except for impacts in the 95th percentile, which increased significantly during games.14,21 Head impacts during college football game sessions have been broken down even further to include differences between
Although the interaction effect between play type and closing distance is not statistically
significant for linear acceleration (P = 0.084) or rotational acceleration (P = 0.096), head
impacts with a greater closing distance are statistically significant for linear acceleration ( P =
0.001) and rotational acceleration (P < 0.001). The most severe head impacts, as measured by
linear acceleration and rotational acceleration, occurred during special teams plays with a
greater closing distance defined as greater than 10 yards.
In addition to investigating differences between player position, level of competition
and session type, literature involving the HIT System has included differences in impact
location and the magnitude of head impacts. Of 3312 valid head impacts in college football
players, the average peak head acceleration was 32g, with 89% of all impacts less than 60 g
across all player positions and impact locations.7 In both high school and college football players, the front of the helmet had the greatest frequency of head impacts, but impacts to the
top of the helmet were shorter in duration and had greater linear acceleration measures.10,14,21 When impact location was correlated with player position in college football players, wide
receivers sustained more impacts in the sagittal plane and fewer lateral impacts, while
fullbacks exhibited a lateral band of impacts around the equator of the helmet, and
linebackers and defensive linemen had more frequent impacts to the rear of the helmet.7 More recently, research using the HIT System has aimed at assessing if helmet design
plays a role in head impacts. Using a total of 1,281,444 head impact data collected across 8
college football teams, differences were noted in head impacts dependent upon the type of
Riddell football helmet worn.20 Players wearing Riddell VSR4 helmets sustained
significantly fewer head impacts per season, but had a greater frequency of high-magnitude
but unknowingly accurate—assumption is that all accelerometer units behave the same way
regardless of the helmet model they were designed for. Of all players wearing Revolution
helmets, 2.28% sustained a concussion, as compared to 4.47% of players who wore VSR4
helmets.20 When controlling for player exposure, a lower percentage of players wearing Revolution helmets sustained a concussion than players wearing VSR4 helmets (P = 0.03).20 A number of factors may explain these findings. It is very possible that newer Revolution
helmets possess better protection than their older VSR4 counterparts. Additionally, better
players (starters), particularly at the high school level, are more likely to have access to
newer equipment. It is possible that Revolution-wearing players were more skillful and apt to
protect themselves from injury than those less experienced VSR4-wearing players. We can
only speculate as to the validity of these factors in the context of the study design, but raise
them to highlight the complexities that exist in on-field head impact biomechanics research.
Video analysis has previously been used both in the laboratory for re-creating head
impacts and in-vivo for assessing the effect of play type and closing distance on head impact
biomechanics.6,18,34 To match head impact biomechanical data to video, video footage was time-synchronized to the HIT system sideline controller, and two angles of footage were
analyzed.18 A single investigator analyzed the video, with strong intra-rater agreement (k = 0.88) for closing distances.18 Video analysis has also been used to investigate head impact severity in youth ice hockey players.35 Head impacts that did not occur in the view of the video footage were excluded from the analysis, and both intra-rater and inter-rater agreement
Relation to Concussion
Research conducted with the HIT System has been used to investigate a possible
correlation between head impact biomechanics and concussion using receiver operating
characteristic (ROC) curves to determine the likelihood of sustaining a concussion for a
given head impact. With previous literature published using HIT System data including
62,974 sub-concussive impacts and 37 diagnosed concussive impacts; ROC curves were
generated for linear acceleration, rotational acceleration and the combined probability of
concussion.11 As impact acceleration magnitude increases, injury risk also increases. No statistically significant differences were found in the area under the curve associated with the
combined probability of a concussion and linear acceleration, meaning that linear
acceleration magnitude is able to predict a concussion as well as the combined probability of
a concussion. Linear acceleration has consistently been reported as the best measurement for
predicting a concussion, with the ability to correctly predict a concussion above 70% of the
time.5,11 However, a composite variable including aspects of linear acceleration, rotational acceleration, impact duration and impact location is even more sensitive to incidence of
concussion as compared to just using linear acceleration values.
In college and high school football athletes the frequency and magnitude of head
impacts sustained on days with a diagnosed concussion are reported to be higher than on
days without a diagnosed concussion.12 Head impacts associated with diagnosed concussion occurred most frequently to the front of the head, followed by the top of the head, side of the
the linear acceleration for the concussive impacts was in the top 3% of all impacts sustained
by each individual player.22
In an effort to find a “concussion threshold,” Pellman et al.6 attempted to establish a correlation between head impact magnitude and incidence of concussion. The study found
that concussions in padded helmets are more likely to occur between 70-75 g of linear
acceleration. However, since published, the notion of a 70-75 g threshold has been refuted
through additional in-vivo research.5,8,10,12,22 Research has since found that there are greater odds of sustaining a concussion with a head impact greater than 84.9 g, and the risk of
sustaining a concussion at impacts greater than 98.9 g is 0.3%.5,12 These findings are more consistent with an additional study reporting that less than 0.35% of impacts greater than 80
g result in concussion based on athlete self-reporting symptoms.10 Discrepancies between studies may be contributed to the different levels of play, the differences in sample size, and
the different technologies for collecting data on head impacts used. For example, the study by
Pellman et al.6 used the Hybrid III Headform and video analysis, while the study by Beckwith et al.12 used head impact data collected with the HIT System.
Although extensive research has been done utilizing the HIT System, there remains
no accepted threshold for magnitude of impact which causes concussion.15 Using data from 43 college football players, clinical outcome measures from the NeuroCom Sensory
Organization Test and the Graded Symptom Checklist were compared following high and
low magnitude impacts.16 Although differences were noted following high magnitude impacts of greater than 90 g for math processing, procedural reaction time and the total
number of symptoms reported as compared to baseline scores, the finding do not support a
Furthermore, the total number of impacts to the top of the helmet and the total number of
head impacts greater than 90 g predicted an increase in the number of concussion-like
symptoms reported from pre-season to post-season.13
Aims to find a “concussion threshold” using high-magnitude head impacts, are further
hindered with the overall distribution of head impacts sustained is highly skewed toward the
low end of the severity spectrum.8 Therefore, additional areas of interest include assessing if there is a correlation between sub-concussive head impacts and neurocognitive changes. It
has been reported that over the course of one season, college football players sustain and
averaged 1177 sub-concussive head impacts.13 A subgroup of athletes demonstrated temporary learning and memory deficits from repetitive head impacts, although it is also
noted that a single season of head impacts is not known to cause widespread short-term
detrimental effects.36
Limitations of the HIT System
Limitations for studies utilizing the HIT System include the inconsistencies in criteria
for defining a head impact and the threshold to be used in the data.8 Many studies have utilized a 10 g threshold,7,10,28,37,38 while others only counted head impacts greater than 15 g.3,14 Head impact location data has often been misclassified for impacts to the facemask, and head impact location has not been verified during on field competition.24 Due to the high cost and logistical problems, a limited number of institutions have access to the HIT System.
The initial cost of the HIT System is substantial, and additional encoders costing
approximately $1,500 each.39 This results in a relatively low number of football players equipped with the technology, and when broken down by player position, even fewer
difficult to control for, possibly causing some discrepancies between studies. Some argue that
accelerometers placed in helmets do not accurately measure head acceleration because of
helmet fit issues and greater force dispersion.40 Furthermore, the HIT System utilizes 3 DOF for linear acceleration, and a mathematical equation in order to measure rotational
acceleration.2 As it relates to concussion, limitations in attempting to establish a correlation between head impacts and concussion may be exacerbated by the under-reporting of
concussion by athletes.20 New Methods
Due to limitations with the HIT System, alternative technologies for measuring head
impact biomechanics have been established and validated in the literature.40 This includes the development of accelerometers attached to a mouthpiece. Research conducted in a laboratory
using a mouthpiece accelerometer (DVT3, X2Impact, Inc., Seattle, WA) to assess linear
acceleration, angular acceleration and angular velocity of head impacts found that on
average, the mouthpiece under-predicted the peak angular acceleration by 10%, especially at
higher impact velocities, and that face mask impacts measured 12-44% greater.2 Furthermore, on average the mouthpiece was found to be most accurate for measuring
impacts to the front and rear of the helmet, and less accurate in measuring impacts to the face
mask. When using the National Operative Committee on Standards for Athletic Equipment
(NOCSAE) test regulations of standard heights and impact sites, there was no statistical
difference between the modified NOCSAE headform and the instrumented mouthpiece.40 Limitations in studies using mouthpice accelerometers are that they are conducted under
helmet testing standards consistent with linear—not rotational—mechanisms, which may not
be realistic for in-vivo use.
Additional technology for measuring head impact biomechanics including linear
acceleration, rotational acceleration, impact frequency and impact location is the xPatch (X2
Biosystems, Seattle, WA), which uses 6 DOF. No literature to date has validated the use of
the xPatch, although the product uses similar technology as the previously described
instrumented mouthpiece made by the same company, which has been validated in the
literature.2 No peer-reviewed literature to date has tested the xPatch encoder in-vivo. The xPatch is less expensive as the HIT System, and may be used by any athlete for any sport.
The xPatch has software to analyze head impact data that may be interpreted for clinical use.
Rationale for Study
The HIT System is currently the gold standard for measuring head impacts in-vivo
and has previously been validated in the literature. Although extensive research has been
conducted utilizing the HIT System, few institutions have access to the technology in
addition to being limited in the sports it is compatible with. The purpose of this study is to
compare the xPatch to the HIT System in measuring linear acceleration, rotational
acceleration, frequency, and impact location of head impacts in college football players. If
the xPatch accurately assess linear acceleration, rotational acceleration, frequency and impact
location then it may be more widely used for a variety of sports and researchers. Furthermore
it may be a more cost effective way to gain knowledge of head impact biomechanics and
CHAPTER III METHODOLOGY Participants
Nine NCAA Division I college football players were recruited (age = 20.8±0.3 years;
height = 188.2±5.4 cm; mass = 109.6±20.9 kg) during the Fall 2014 season. Participants
were selected to represent a variety of player positions including 1 running back, 2 offensive
linemen, 1 wide receiver, 1 defensive lineman, 2 linebackers, and 2 defensive backs. Each
participant signed an informed consent approved by the university’s Institutional Review
Board. Inclusion criteria required that each participant be a Division I college football player
during the Fall 2014 season who wore a helmet equipped with the HIT System.
Instrumentation
Head Impact Telemetry System
The HIT System (Riddell Corp., Elyria, OH) was used to collect linear acceleration,
rotational acceleration, Head Impact Technology severity profile (HITsp), impact frequency,
and impact location during all practice and game sessions. Use of the HIT System has been
widely used in the literature to measure our variables of interest.7,26-29 It is comprised of six single-axis accelerometers and a Sideline Response System (Riddell Corp., Elyria, OH). The
Sideline Response System includes a laptop with the Head Impact Telemetry Impact
Analyzer software, allowing the user to access the head impact data. The model-specific
encoders are compatible with Riddell Revolution (M, L, or XL), or Revolution Speed (M, L,
recorded pre-threshold, and 32 ms after the impact). The data are time-stamped and
processed through a proprietary algorithm to determine impact location and magnitude.
X2 Biosystems xPatch
The xPatch is a six degree-of-freedom system, and measures linear acceleration,
rotational velocity, HITsp, impact location, and impact frequency of head impacts. Rotational
acceleration is computed through a proprietary post-processing procedure. The xPatch device
has yet to be widely used in the literature owing to its recent commercial available, although
similar mouthpiece-instrumented technology has been documented.2,40 To remain consistent with the HIT System, the impact threshold was set at 10 g. The xPatch stores data for up to
1600 head impacts, which were manually transferred via computer using the xPatch software
to a cloud database. X2 Biosystems uses a proprietary algorithm to determine if data
recorded by the xPatch were actual head impacts or not. This algorithm is based on the
waveform parameters associated with known head impacts measured in laboratory
conditions. Although the exact matching criteria are unknown, the algorithm uses
characteristics from the recorded waveform such as area under the curve, points above
threshold, and ratio of filtered to unfiltered resultant linear acceleration to determine real
head impacts. Data were manually transferred to the cloud database after each game session
and the battery charged after each use. The xPatch has a six-hour battery life, and must be
activated prior to each use.
Video Analysis
A standard high-definition digital video camera (Model: PV-GS35; Panasonic
Corporation of North America; Secaucus, NJ) was time-synchronized to the sideline
was necessary to synchronize head impact location data captured by the HIT System and
xPatch with video observations of these collisions during regular play. To verify head impact
location data from games, video footage from an end zone angle using two Panasonic P2
cameras at 60 frames per second were used and recorded onto 16 GB P2 cards.
Procedures
A professional equipment manager fit all participants with a Riddell helmet, which
our research team then instrumented with the model-specific accelerometer (encoder) prior to
the Fall 2014 season. The xPatch encoder was activated and affixed using Omnifix tape
superficial to the right mastoid process prior to each event. Head impact data were collected
during three games of the regular 2014 football season. Prior to each game session, a single
investigator was responsible for time synchronization across the data collection devices to
ensure that video footage could be accurately linked to head impact biomechanical data.
Video personnel filmed each game session from two positions on the field: sideline view of
the entire field and view from the end zone. Video analyses were conducted to link actual
head impact location to the recorded head impact location of the HIT System and the xPatch.
Based on the observed impact utilizing the video, impacts were assigned a location (back,
front, side, or top), or as one of the following: no impact visible on video; impact location
unclear based on video; or multiple impacts concurrently sustained and unable to assign a
specific location. A single investigator determined head impact location on video and was
blinded to what system recorded each impact and the biomechanical data. Every impact
recorded by either system was analyzed a minimum of two times, once from each camera
angle. If impact location was unclear after the initial angles were observed, the investigator
a subset of head impacts (n = 50) to re-evaluate head impact location no less than 30 days
following the initial evaluation. There was a strong intrarater agreement for impact location
(𝜅 = 0.91).
Data Reduction
Only data captured by both the HIT System and xPatch were retained for our data
analyses. Reasons for exclusion included if one of the systems did not capture the impact
event, had a battery failure, or was otherwise not functioning properly. In order to
appropriately address our study aims, we identified impact events where each system
recorded head impact information. Figure 4.1 details the number and reason for excluding
impacts associated with each study aim.
Head impact data from three game sessions in the Fall 2014 season were exported
from the Sideline Response System using the Riddell Export Utility and the X2Net wireless
Windows Azure cloud database, and subsequently reduced in SAS (SAS Institute, Inc., Cary,
NC). Linear acceleration (g), rotational acceleration (rad/s2), HITsp, and impact location were the outcome measures of interest. Because raw impact data for linear acceleration,
rotational acceleration, and HITsp are heavily skewed to low-magnitude head impacts,
logarithmic base 10 transformations were employed to normalize the impact data and to
allow for parametric statistical analyses.
Statistical Analysis
All data were analyzed using SAS 9.3 statistical software. An a priori alpha level of
0.05 was used. All statistical analyses were performed on the log base 10 transformed values.
HITsp. Pearson correlations defined as high (r > 0.6), moderate (r = 0.3 – 0.6) or low (r <
0.3). Random intercepts general linear mixed models were performed to compare means
between systems. A weighted Kappa analysis was used to analyze frequency differences
between the recorded impact location for each system and the actual impact location verified
on video. Weighted Kappa allowed us to apply a greater level of disagreement to situations
where the video location was front and the data location was back, or vice versa. To further
explore the ability of each head impact system to properly record real on-field impacts, we
performed a capture-recapture analysis as previously described. This allowed us to estimate
the number of real on-field head impacts not recorded by each system based on the data we
Table 3.1. Data Analysis Plan
Aim Objective Variables Statistical
Method
1
1
2
2
Is there a difference between the HIT System and xPatch in measuring linear acceleration, rotational acceleration, and HITsp
Is there a difference in means between the HIT System and xPatch in measuring linear
acceleration, rotational acceleration and HITsp
Is there agreement between the HIT System impact location data and actual impact location
Is there agreement between the xPatch impact location data and actual impact location
Dependent: Linear acceleration Rotational acceleration HITsp Linear acceleration Rotational acceleration HITsp Impact location Impact location Independent: System
(HIT System and xPatch)
System
(HIT System and xPatch)
HIT System and video
xPatch and video
CHAPTER IV MANUSCRIPT Introduction
Approximately 3.8 million sport-related traumatic brain injuries (concussions) occur
each year in the United States, with football annually accounting for the most concussions.1 It is reported that each year 5-10 concussions occur per college football team,2 and that a single collegiate football athlete may sustain as many as 1,400 head impacts in a single season.3 Furthermore, athletes sustain a greater number of head impacts as well as impacts of a higher
severity on days of a diagnosed concussion.4 Concussion research is continually evolving and expanding, including injury management and the study of long-term effects and deficits
believed to be associated with concussion. The study of head impact biomechanics can aid in
the development of concussion injury risk curves.5
Early investigation of head impact biomechanics consisted of laboratory methods
utilizing the Hybrid III Headform to reconstruct on-field head impacts resulting in
concussions from National Football League (NFL) video footage.6 Since 2003, the Head Impact Telemetry (HIT) System has been used in numerous studies for objectively measuring
impact trends over the course of a season, and begin to study the patterns observed in head
impact biomechanical data on days of a diagnosed concussion.4,12,13Although extensive research has been conducted with the purpose of relating head impact biomechanics to
concussion, a biomechanical concussion injury threshold for magnitude of impact remains
elusive to clinical researchers.14-16
Although research with the HIT System has provided much insight into head impact
biomechanics, in-vivo analysis has been restricted by licensing agreements limiting the study
of football head impact biomechanics to those who wear Riddell helmets capable of
accepting the HIT System accelerometer units. More recently, non-helmet based technologies
capable of measuring head impact biomechanics have become an option to clinical
researchers. These technologies are not restricted to one particular helmet brand, and
introduce the potential for the widespread study of athletes in helmeted and non-helmeted
sports. One of these technologies includes the xPatch (X2 Biosystems, Seattle, WA). The
xPatch system is designed to measure head impact biomechanics and store the data for later
downloading and post-impact processing. The xPatch possesses many benefits including, but
not limited, to the following: 1) relative low cost, 2) use in helmeted and non-helmeted
sports, 3) a small form factor, and 4) a long battery life. However, how the HIT System and
xPatch compare during in-vivo data collection remains unstudied.
In exploring head impact biomechanics in-vivo, video footage has previously been
used in football and ice hockey events.17,18 However, on-field head impact location data from the HIT System have yet to be verified with video analysis and no published reports exist on
the xPatch. Therefore, the purpose of this study was to capture on-field head impact data
their ability to appropriately measure head impact biomechanics. Specifically, our first aim
was to compare the HIT System and xPatch on measures of linear acceleration, rotational
acceleration, and Head Impact Technology severity profile (HITsp) in college football
players. Our second aim was to verify system-determined head impact locations based on
video-observed head impact locations.
Methods Participants
Nine NCAA Division I college football players were recruited (age = 20.8 ± 0.3 yrs;
height = 188.2 ± 5.4 cm; mass = 109.6 ± 20.9 kg) during the Fall 2014 season. Participants
were selected to represent a variety of player positions including 1 running back, 2 offensive
linemen, 1 wide receiver, 1 defensive lineman, 2 linebackers, and 2 defensive backs. Each
participant signed an informed consent approved by the university’s Institutional Review
Board. Inclusion criteria required that each participant be a Division I college football player
during the Fall 2014 season who wore a helmet equipped with the HIT System.
Instrumentation
Head Impact Telemetry System
The HIT System (Riddell Corp., Elyria, OH) was used to collect linear acceleration,
rotational acceleration, HITsp, impact frequency, and impact location during all practice and
game sessions. Use of the HIT System has been widely used in the literature to measure our
variables of interest.7,26-29 It is comprised of six single-axis accelerometers and a Sideline Response System (Riddell Corp., Elyria, OH). The Sideline Response System includes a
laptop computer with the Head Impact Telemetry Impact Analyzer software, allowing the
Revolution (M, L, or XL), or Revolution Speed (M, L, or XL) helmet types. The HIT System
collected data at 1 kHz for a period of 40 ms (8 ms recorded pre-threshold, and 32 ms after
the impact). The data are time-stamped and processed through a proprietary algorithm to
determine impact location and magnitude.
X2 Biosystems xPatch
The xPatch is a six degree-of-freedom system, and measures linear acceleration,
rotational velocity, HITsp, impact location, and impact frequency of head impacts. Rotational
acceleration is computed through a proprietary post-processing procedure. The xPatch device
has yet to be widely used in the literature owing to its recent commercial availability,
although similar mouthpiece-instrumented technology has been documented.2,40 To remain consistent with the HIT System, the impact threshold was set at 10 g. The xPatch stores data
for up to 1600 head impacts, which were manually transferred via computer using the xPatch
software to a cloud database. X2 Biosystems uses a proprietary algorithm to determine if data
recorded by the xPatch were actual head impacts or not. This algorithm is based on the
waveform parameters associated with known head impacts measured in laboratory
conditions. Although the exact matching criteria are unknown, the algorithm uses
characteristics from the recorded waveform such as area under the curve, points above
threshold, and ratio of filtered to unfiltered resultant linear acceleration to determine real
head impacts. Data were manually transferred to the cloud database after each game session
and the battery charged after each use. The xPatch has a six-hour battery life, and must be
Video Analysis
A standard high-definition digital video camera (Model: PV-GS35; Panasonic
Corporation of North America; Secaucus, NJ) was time-synchronized to the sideline
controller and was used to record the game clock and time of day during competition. This
was necessary to synchronize head impact location data captured by the HIT System and
xPatch with video observations of collisions during regular play. To verify head impact
location data from games, video footage from an end zone angle and wide angle of the field,
using two Panasonic P2 cameras at 60 frames per second, were used and recorded onto 16
GB P2 cards.
Procedures
A certified equipment manager fit all participants with a Riddell helmet, which our
research team then instrumented with the model-specific accelerometer (encoder) prior to the
Fall 2014 season. The xPatch encoder was activated and affixed using Omnifix tape
superficial to the right mastoid process prior to each event. Head impact data were collected
during three games of the regular 2014 football season. Prior to each game session, a single
investigator was responsible for time synchronization across the data collection devices to
ensure that video footage could be accurately linked to head impact biomechanical data. This
time synchronization occurred within 4 hours of game time. Video personnel filmed each
game session from two positions on the field: sideline view of the entire field and view from
the end zone. Video analyses were conducted to link actual head impact location to the
recorded head impact location of the HIT System and the xPatch. Based on the observed
impact utilizing the video, impacts were assigned a location (back, front, side, or top), or as
multiple impacts concurrently sustained and unable to assign a specific location. A single
investigator determined head impact location on video and was blinded to which system
recorded each impact. Every impact recorded by either system was analyzed a minimum of
two times, once from each camera angle. If impact location was unclear after the initial
angles were observed, the investigator watched the impact until an appropriate location could
be determined. We randomly selected a subset of head impacts (n = 50) to re-evaluate head
impact location no less than 30 days following the initial evaluation. There was a strong
intrarater agreement for impact location (𝜅 = 0.91).
Data Reduction
Only data captured by both the HIT System and xPatch were retained for our data
analyses. Reasons for exclusion included if one of the systems did not capture the impact
event, had a battery failure, or were otherwise not functioning properly. In order to
appropriately address our study aims, we identified impact events where each system
recorded head impact information. Figure 4.1 details the number and reason for excluding
impacts associated with each study aim.
Head impact data from three game sessions in the Fall 2014 season were exported
from the Sideline Response System using the Riddell Export Utility and the X2Net wireless
Windows Azure cloud database, and subsequently reduced in SAS (SAS Institute, Inc., Cary,
NC). Linear acceleration (g), rotational acceleration (rad/s2), HITsp, and impact location were the outcome measures of interest. Because raw impact data for linear acceleration,
rotational acceleration, and HITsp are heavily skewed to low-magnitude head impacts,
logarithmic base 10 transformations were employed to normalize the impact data and to
Statistical Analysis
All data were analyzed using SAS 9.3 statistical software. An a priori alpha level of
0.05 was used. All statistical analyses were performed on the log base 10 transformed values.
Pearson correlations ® and the coefficient of determination (r2) were calculated for each of the following variables between systems; rotational acceleration, linear acceleration, and
HITsp. Pearson correlations were defined as high (r > 0.6), moderate (r = 0.3 – 0.6) or low (r
< 0.3). Random intercepts general linear mixed models were performed to compare means
between systems. A weighted Kappa analysis was used to analyze frequency differences
between the recorded impact location for each system and the actual impact location verified
on video. Weighted Kappa allowed us to apply a greater level of disagreement to situations
where the video location was front and the data location was back, or vice versa. To further
explore the ability of each head impact system to properly record real on-field impacts, we
performed a capture-recapture analysis as previously described.43 This allowed us to estimate the number of real on-field head impacts not recorded by each system based on the data we
collected.
Results
We captured 1251 total head impacts with both systems (HIT System n= 554; xPatch
n= 697). We observed statistically significant correlations between the HIT System and
xPatch for linear acceleration (r = 0.44; r2 = 0.19; P <0.001), rotational acceleration (r = 0.15; r2 = 0.02; P = 0.017), and HITsp (r = 0.34; r2 = 0.12; P <0.001) (Figure 4.2). We observed significant differences in mean rotational acceleration (F1,8 = 832.19; P <.001) and HITsp
(F1,8 = 8.95; P = 0.017) between systems, but no difference in linear acceleration (F1,8 = 0.10;
and: 1) HIT System impact location (weighted 𝜅 = 0.17); 2) xPatch impact location (weighed
𝜅 = 0.12). Likewise, a low agreement was observed between xPatch impact location and HIT
System impact location (weight 𝜅 = 0.04). Additionally, Table 4.2 details the number of
impacts recorded by each system that were verified using video analysis, and Table 4.3
presents the capture-recapture analysis.
Discussion
From our study it appears data from the HIT System and xPatch should not be used in
conjunction in order to draw conclusions about head impact biomechanics. The HIT System
and xPatch do not appear to be measuring similarly for rotational acceleration and head
impact location. Video analysis revealed poor agreement in recorded impact location and
observed impact location for both systems, in addition to providing insight into estimated
head impact exposure and the number of head impacts recorded that did not occur during
competition.
Although our hypothesis was confirmed, and we had significant correlations, our
results show a moderate correlation between the HIT System and xPatch in measuring linear
acceleration and HITsp, and a low correlation in measuring rotational acceleration. While a
moderate correlation between the two systems in measuring linear acceleration was found,
there was not a significant difference in the means. In addition to having a low correlation,
the mean rotational acceleration of the xPatch was significantly greater than the HIT System.
The mean HITsp for the xPatch was also significantly greater than the mean for the HIT
System. A possible explanation for this difference is that HITsp is a derivative of linear
Criterion. Therefore, significantly greater rotational acceleration values for the xPatch may
also have an effect on the HITsp.
One potential explanation for the difference in rotational acceleration of head impacts
between the HIT System and xPatch is that both systems must estimate the rotational
acceleration. Because the HIT System only measures linear acceleration, a mathematical
algorithm for estimating the magnitude of rotational acceleration was developed and has been
previously reported in the literature.24,27 It is important to note the HIT System is unable to estimate rotational acceleration about the transverse plane. This may cause an
underestimation of rotational acceleration measurements. In contrast, the xPatch is able to
measure rotational velocity, but not rotational acceleration directly. This may cause an
overestimation of rotational acceleration values, but we are unable say this for certain from
our data. Our findings do not demonstrate that rotational acceleration measurements should
be excluded in head impact biomechanics, but that the data are relative to the measurement
device. Further investigation is needed to ascertain the reliability of each system’s reported
rotational acceleration values. Beyond reliability, laboratory study is needed to continue to
develop methods to properly measure, derive, and report rotational acceleration.
Additionally, our data only included 264 matched head impacts. A larger data set may be
able to account for some of the variability in rotational acceleration between the HIT System
and xPatch. While this may be possible, we believe it is unlikely due to the very large mean
difference we noted between systems. The results of our data are consistent with other
studies reporting linear acceleration measurements may be more consistent between
Head impact location has previously been reported in both football and ice hockey
players.3,19 However, no study to date has verified head impact location with video analysis in-vivo. Impact location for both the HIT System and xPatch was not as accurate as we
hypothesized. A Kappa of 1.0 means that the impact location recorded by the system and the
actual impact location verified by video analysis is in complete agreement whereas a Kappa
of 0 indicates purely chance agreement. Our data found poor agreement for both the HIT
System (𝜅 = 0.17) and xPatch (𝜅 = 0.12). One initial explanation was investigator error;
however, after further video analysis of 50 randomly selected impacts, our intra-rater
reliability was 𝜅 = 0.91. Furthermore, we found poor agreement in impact location for the
same impact event between the HIT System and the xPatch. A possible explanation for the
poor agreement is that the HIT System and the xPatch use different conventions to determine
impact location. Regardless of the conventions used, we analyzed the output reported by each
system. Unless researchers redefine impact location using given azimuth and elevation
values, the system generated impact location values would be analyzed. Therefore, we feel
justified in analyzing the system generated impact location values. Future research needs to
identify inter-tester reliability and investigate head impact location agreement for each head
impact location (back, front, side, top). Further, researchers should determine the most
appropriate conventions to use when defining head impact location. In our study we did not
differentiate between right side and left side head impacts, future research should
differentiate between side impacts. Furthermore, in our study the xPatch was only placed
behind each subject’s right ear. It is unclear if this had an effect on impact location, and
future research should investigate differences in head impact location based on which side of
Although not one of our research aims, one important finding of our study is the
number of head impacts recorded that were not visible on video analysis. We did not exclude
head impacts in our analysis because they did not occur, but rather because they were not
visible on video. On-field head impact biomechanics has previously been studied using head
impact monitoring systems and documented in the literature.3,4,9,10,12,14,18,44,45 In data sets with large numbers of head impacts, it is unlikely that each impact recorded was verified on video.
By analyzing video from two angles we were able to determine if an impact recorded by
either system actually occurred during competition. In our data set, approximately 23% of the
total number of head impacts recorded by either system were false positives and did not
occur during competition. It is interesting to note that in approximately 2% of recorded HIT
System impacts and 14% of xPatch impacts, the player was clearly visible on the field, and
did not sustain a head impact. A possible explanation for the xPatch recording false positives
is that the device is too sensitive, recording impacts when the head is moving or rotating
quickly, or movement of the arm or shoulder pads in close proximity to the placement of the
xPatch. Although the HIT System had a lower rate of false positives when the player was on
the field, it had a greater rate of false positives when the player was not on the field
compared to the xPatch. Approximately 21% of HIT System impacts and 9% of xPatch
impacts were recorded when the player was not on the field. A possible explanation for the
increased number of head impacts recorded by the HIT System when the player was not on
the field include celebratory head slaps, and taking the helmet on or off. It would take a
tremendous effort for a researcher to take into account every time a player is off the field, as
well as requiring additional camera angles to view the sideline. Thus, it is likely many
substantial number of off-field head impacts. Whether or not these off-field impacts were
head slaps or head butts or where a result of the player removing, replacing, or slamming
down his helmet is unknown. This is an important finding and researchers should continue to
investigate the most appropriate data collecting and cleaning procedures in order to ensure
appropriate impact data are analyzed.
Previous studies have reported head impact frequencies during game and practice
sessions.3,9,33,36,45 This is important as quantifying total head impact exposure may be a key component in understanding potential late life cognitive and behavioral challenges faced by
former athletes. Because neither the HIT System nor the xPatch are considered the gold
standard for measuring head impact biomechanics, we used the capture-recapture method to
estimate the total number of head impacts that may have actually occurred but not have been
recorded. This method has previously been used to estimate the number of missing recorded
injuries when investigating two injury surveillance systems.43 The capture-recapture method demonstrates that many head impacts may have occurred and not been recorded. An
estimated number of 146 total head impacts were missed by both systems. The capture rate of
the HIT System and xPatch for the total number of head impacts is 62.71% and 73.36%,
respectively. This means that the HIT system is failing to capture approximately 35% of
actual head impacts, and the xPatch is failing to capture approximately 25% of head impacts.
This is concerning as researchers continue to understand a potential relationship between
head impact exposure and long-term pathologies and consequences.39
The findings of our study reveal that both the HIT System and xPatch have poor
agreement with actual head impact location, and that we are unable to accurately compare
false positive data that are often included in head impact biomechanics analyses when every
impact is not verified by video analysis. Our study also suggests that head impact monitoring
devices may not be capturing every actual head impact. Limitations of this study include the
use of a single football team and low number of subjects that may not represent a larger
population of football athletes and non-helmeted sports. Other limitations include the
relatively low number of competitions and head impacts analyzed. Future research should
include laboratory testing for measuring and comparing rotational acceleration of the xPatch
and HIT System in a controlled environment, and exploring differences between the systems
when broken down by head impact location and head impact severity. Future research should
also investigate head impact biomechanical data in non-helmeted sports as well as head
35
Figure 4.1.
Impact selection flow chart, broken down by Aim 1 (System Comparison) and Aim 2 (Impact Location).
36 F igu re 4. 2. S ca tt er pl ot s re pr es ent ing the c or re la ti on be tw ee n the H IT S ys te m a nd xP at ch in m ea sur ing li ne ar a cc el er at ion (A ) and rot at iona l a cc el er at ion (B ). 10 20 30 40 50 60 70 80 90 100 110 120 130 10 20 30 40 50 60 70 80 90 100 110 120 130 xPatch (g) HIT System (g) 0 2000 4000 6000 8000 10000 12000 14000 16000 18000 20000 0 1000 2000 3000 4000 5000 6000 7000 8000 xPatch (rad/s 2 ) HIT System (rad/s
2 )
37
Descriptive statistics and means comparisons between systems
Linear Acceleration (g)
Rotational Acceleration (Rad/s
38
Table 4.2.
Impacts recorded by each system and verified by video analysis Vi
d
eo
Impact V
erification
HIT System (%
)
xPatch (%
)
Total (%
)
Impact clearly visible on video
425 (76.7)
540 (77.4)
965 (77.1)
Player visible on field, did not sustain head impact
11 (1.9)
96 (13.7)
286 (22.9)
Player was not on the field
118 (21.2)
61 (8.7)
Total
554 (44.3)
697 (55.7)
1251 (100)
HI
T
–
He
ad
I
m
pa
ct
T
el
em
et
Table 4.3. Capture-Recapture analysis for total number of head
impacts
Captured by HIT System
Yes No
Captured by xPatch
Yes 639 (a) 380 (b)
No 232 (c) 138 (x)
x = estimated number of head impacts not captured by either system x = bc/a
N = estimated number of total head impacts N = a + b + c +x
N = 1389
Estimated capture rate of HIT System = (a+c)/N = 62.71% Estimated capture rate of xPatch: (a+b)/N = 73.36% Estimated capture rate of HITS and xPatch: a/N = 46.01%
REFERENCES
1. Langlois JA, Rutland-Brown W, Wald MM. The epidemiology and impact of
traumatic brain injury: a brief overview. J Head Trauma Rehabil. Sep-Oct
2006;21(5):375-378.
2. Camarillo DB, Shull PB, Mattson J, Shultz R, Garza D. An instrumented mouthguard
for measuring linear and angular head impact kinematics in American football. Ann
Biomed Eng. Sep 2013;41(9):1939-1949.
3. Crisco JJ, Fiore R, Beckwith JG, et al. Frequency and location of head impact
exposures in individual collegiate football players. J Athl Train. Nov-Dec
2010;45(6):549-559.
4. Beckwith JG, Greenwald RM, Chu JJ, et al. Timing of concussion diagnosis is related
to head impact exposure prior to injury. Medicine and science in sports and exercise.
Apr 2013;45(4):747-754.
5. Greenwald RM, Gwin JT, Chu JJ, Crisco JJ. Head impact severity measures for
evaluating mild traumatic brain injury risk exposure. Neurosurgery. Apr
2008;62(4):789-798; discussion 798.
6. Pellman EJ, Viano DC, Tucker AM, Casson IR, Waeckerle JF. Concussion in
professional football: reconstruction of game impacts and injuries. Neurosurgery. Oct
2003;53(4):799-812; discussion 812-794.
7. Duma SM, Manoogian SJ, Bussone WR, et al. Analysis of real-time head
accelerations in collegiate football players. Clinical journal of sport medicine :
official journal of the Canadian Academy of Sport Medicine. Jan 2005;15(1):3-8.
8. Funk JR, Rowson S, Daniel RW, Duma SM. Validation of concussion risk curves for
collegiate football players derived from HITS data. Ann Biomed Eng. Jan
2012;40(1):79-89.
9. Crisco JJ, Wilcox BJ, Beckwith JG, et al. Head impact exposure in collegiate football
players. J Biomech. Oct 13 2011;44(15):2673-2678.
10. Mihalik JP, Bell DR, Marshall SW, Guskiewicz KM. Measurement of head impacts
11. Rowson S, Duma SM. Brain injury prediction: assessing the combined probability of
concussion using linear and rotational head acceleration. Ann Biomed Eng. May
2013;41(5):873-882.
12. Beckwith JG, Greenwald RM, Chu JJ, et al. Head impact exposure sustained by
football players on days of diagnosed concussion. Medicine and science in sports and
exercise. Apr 2013;45(4):737-746.
13. Gysland SM, Mihalik JP, Register-Mihalik JK, Trulock SC, Shields EW, Guskiewicz
KM. The relationship between subconcussive impacts and concussion history on
clinical measures of neurologic function in collegiate football players. Ann Biomed
Eng. Jan 2012;40(1):14-22.
14. Broglio SP, Sosnoff JJ, Shin S, He X, Alcaraz C, Zimmerman J. Head impacts during
high school football: a biomechanical assessment. J Athl Train. Jul-Aug
2009;44(4):342-349.
15. Guskiewicz KM, Mihalik JP. Biomechanics of sport concussion: quest for the elusive
injury threshold. Exerc Sport Sci Rev. Jan 2011;39(1):4-11.
16. McCaffrey MA, Mihalik JP, Crowell DH, Shields EW, Guskiewicz KM.
Measurement of head impacts in collegiate football players: clinical measures of
concussion after high- and low-magnitude impacts. Neurosurgery. Dec
2007;61(6):1236-1243; discussion 1243.
17. Mihalik JP, Blackburn JT, Greenwald RM, Cantu RC, Marshall SW, Guskiewicz
KM. Collision type and player anticipation affect head impact severity among youth
ice hockey players. Pediatrics. Jun 2010;125(6):e1394-1401.
18. Ocwieja KE, Mihalik JP, Marshall SW, Schmidt JD, Trulock SC, Guskiewicz KM.
The effect of play type and collision closing distance on head impact biomechanics.
Ann Biomed Eng. Jan 2012;40(1):90-96.
19. Mihalik JP, Guskiewicz KM, Marshall SW, Blackburn JT, Cantu RC, Greenwald
RM. Head impact biomechanics in youth hockey: comparisons across playing
position, event types, and impact locations. Ann Biomed Eng. Jan
2012;40(1):141-149.
21. Crisco JJ, Wilcox BJ, Machan JT, et al. Magnitude of head impact exposures in
individual collegiate football players. J Appl Biomech. May 2012;28(2):174-183.
22. Schnebel B, Gwin JT, Anderson S, Gatlin R. In vivo study of head impacts in
football: a comparison of National Collegiate Athletic Association Division I versus
high school impacts. Neurosurgery. Mar 2007;60(3):490-495; discussion 495-496.
23. Pellman EJ, Viano DC, Withnall C, Shewchenko N, Bir CA, Halstead PD.
Concussion in professional football: helmet testing to assess impact
performance--part 11. Neurosurgery. Jan 2006;58(1):78-96; discussion 78-96.
24. Beckwith JG, Greenwald RM, Chu JJ. Measuring head kinematics in football:
correlation between the head impact telemetry system and Hybrid III headform. Ann
Biomed Eng. Jan 2012;40(1):237-248.
25. Newman JA, Beusenberg MC, Shewchenko N, Withnall C, Fournier E. Verification
of biomechanical methods employed in a comprehensive study of mild traumatic
brain injury and the effectiveness of American football helmets. J Biomech. Jul
2005;38(7):1469-1481.
26. Brolinson PG, Manoogian S, McNeely D, Goforth M, Greenwald R, Duma S.
Analysis of linear head accelerations from collegiate football impacts. Curr Sports
Med Rep. Feb 2006;5(1):23-28.
27. Crisco JJ, Chu JJ, Greenwald RM. An algorithm for estimating acceleration
magnitude and impact location using multiple nonorthogonal single-axis
accelerometers. J Biomech Eng. Dec 2004;126(6):849-854.
28. Funk JR, Duma SM, Manoogian SJ, Rowson S. Biomechanical risk estimates for
mild traumatic brain injury. Annu Proc Assoc Adv Automot Med. 2007;51:343-361.
29. Manoogian S, McNeely D, Duma S, Brolinson G, Greenwald R. Head acceleration is
less than 10 percent of helmet acceleration in football impacts. Biomed Sci Instrum.
2006;42:383-388.
30. Jadischke R, Viano DC, Dau N, King AI, McCarthy J. On the accuracy of the Head
Impact Telemetry (HIT) System used in football helmets. J Biomech. Sep 3