AUSTRALIAN JOURNAL OF BASIC AND
APPLIED SCIENCES
ISSN:1991-8178 EISSN: 2309-8414 Journal home page: www.ajbasweb.com
Open Access Journal
Published BY AENSI Publication
© 2016 AENSI Publisher All rights reserved
This work is licensed under the Creative Commons Attribution International License (CC BY).
http://creativecommons.org/licenses/by/4.0/
To Cite This Article:
T. Christy Bobby., Sub Region Analysis of Human Femur Trabecular Bone Strength Using Radiographic Images and
Multidirectional Multiscale Transform. Aust. J. Basic & Appl. Sci., 10(5): 46-53, 2016Sub Region Analysis of Human Femur Trabecular Bone Strength Using
Radiographic Images and Multidirectional Multiscale Transform
T. Christy Bobby
Department of Electronics and Communication Engineering,East Point College of Engineering and Technology, Bangalore, 560 049, India
Address For Correspondence:
T.Christy Bobby, Department of Electronics and Communication Engineering, East Point College of Engineering and Technology, Bangalore-560 049; E-mail: [email protected]
A R T I C L E I N F O A B S T R A C T Article history:
Received 12 January 2016 Accepted 22 February 2016 Available online 1 March 2016
Keywords:
Trabecular bone, Human femur, Contourlet, ELM, E-ELM.
Background: Human femur trabecular bone is a dynamic and highly vascularised tissue which is able to repair and regenerate continuously throughout the life time of an individual. The sub-regions of the trabecular bone are structurally different and heterogeneous in nature. They have different bone strengths as they are subjected to different loading conditions. The variations in trabecular bone density and structure are directly related to bone strength. Thus in addition to bone mineral density, trabecular microarchitecture is considered as an important determinant of bone strength. In radiographic images the trabecular microarchitecture is projected as curves and straight lines oriented at various directions. In this work, femur trabecular microarchitecture variations in two strength regions such as compressive and tensile regions, delineated from the radiographic images of normal and abnormal subjects, are analyzed using multidirectional and multiscale contourlet transform. The contourlet coefficients are derived based on each scale and orientation for trabecular images. The mean and energy of the derived contourlet coefficients associated with each subband are computed. These values are used as the texture feature vector elements to evaluate changes taking place in the trabecular architecture. To automate the analysis, three most significant feature vectors are found using principal component analysis and these values are used as an input to the Evolutionary Extreme Learning Machine (E-ELM) classifier. The results show that it is possible to differentiate normal and abnormal femur trabecular images using contourlet features. Also the architectural variations are more in the tensile region when compared to compressive region. Thus E-ELM classifier performs better in terms of accuracy (98%) for the chosen parameters form tensile region when compared to compressive.
INTRODUCTION
different loading conditions. Also the trabecular pattern change occurring in these sub-regions classifies the bones as normal, osteoporotic and severely osteoporotic bones. In the conventional planar radiographic images, these changes are clearly visible. (Singh et al., 1970)
Imaging techniques such as micro-computed tomography and high resolution magnetic resonance imaging, produce three-dimensional (3D) images of trabecular bone, but their usage may be limited by their cost and availability. Digital radiography is a commonly available imaging modality that has the ability to reflect trabecular microarchitecture information that is available in three dimensional images. Thus, there has been considerable interest in using digital radiography combined with texture analysis techniques for assessing trabecular structure (Podsiadlo et al., 2008) (Corroller et al., 2012). The texture features are mainly derived using spatial and spectral methods. Spectral methods have an advantage of being insensitive to noise. Therefore, transforms have been widely used to characterize image textures. Wavelet transforms are very effective in representing images with point singularities. But most of the medical images and trabecular bone images often contain both curves and straight lines oriented at various directions (Ascenzi et al., 2011). Hence multiscale transform called contourlet transform, which can capture the curve and line discontinuity present in the images is used for feature extraction (Do and Vetterli, 2005) (Moayedi et al., 2010).
Principal Component Analysis (PCA) is a standard feature selection tool in data analysis. It identifies patterns in data, and to highlight their similarities and differences. In the analysis of multivariate datasets, PCA is used to select the most significant parameters and the parameters are ranked based on their highest magnitudes in the principal components obtained. It has been widely employed in various signal and image processing problems (Samonwoy et al., 2008).
Identification of tools for automated classification of medical images is an important step towards clinical decision making. Artificial Neural Networks (ANN) has seen a rapid growth and it has been applied widely in many biomedical applications. The Extreme Learning Machine (ELM) is a neural network algorithm for Single-hidden Layer feed Forward Neural network (SLFN) (Rong et al., 2008). However, ELM uses higher number of hidden neurons due to the random determination of the input weights and hidden biases (Liu and Wang, 2010). To remove redundancy among hidden nodes and to achieve satisfactory performance, a hybrid approach called E-ELM has been proposed by taking advantages of both ELM and Differential Evolution (DE) with more compact networks (Qin-Yu et al., 2005).
In this work, radiographic human femur bone images are processed using image processing techniques and the strength regions such as compressive and tensile are delineated from the processed images. The mean feature vectors are calculated from the contourlet coefficients of different sub-bands for the delineated regions of interest. From the derived feature vectors, three most significant feature vectors are chosen using PCA and are used as inputs to the classifier. E-ELM classifier is employed for the classification of normal and abnormal femur bone images. The performances of the classifier are estimated and compared for the two strength regions.
Methods:
original variables. The extracted latent variables are orthogonal and are sorted according to their eigenvalues. The high dimensional space described by matrix X is modeled using PCA as
T
X =TP +E (1)
where T is the score matrix composed by the principal components, P is the loadings composed by the eigenvectors of the covariance matrix and E is the residual matrix (Samonwoy et al., 2008). The first three most significant parameters derived using PCA are used as an input to the E-ELM classifiers. EELM using Differential evolution (DE) and Moore–Penrose (MP) generalized inverse parameters are used to classify the normal and abnormal bone images. In E-ELM the population is randomly generated. The population is composed of a set of input weights and hidden biases.
11
,
12, ...,
1k,
21,
22, ...
2k,... ,
n1,
n2,...
nk,...
1,
2,...,
kw
w
w
w
w
w
w
w
w
b b
b
θ
=
(2)
All wij and bj are randomly initialized within the range of [−1, 1]. For each individual the corresponding output weights are analytically computed by using the MP generalized inverse. The fitness of each individual is evaluated using cost function (E) and Root Mean Squared Error (RMSE).
2
1 1 ( . ) 2
N K
i i j i j
j i g W X b t
m N
E
=
∑ ∑
= =β + − (3)After the fitness, all individuals in the population are calculated using DE mutation, crossover and selection. During selection, the mutated vectors are compared with the original vectors, and the vectors with better fitness values are retained to the next generation. Further, to improve the generalization performance, one more criteria
is added into the selection, the norm of output weights
β
. In this selection strategy, if the difference of thefitness between different individuals is small, smaller
β
is selected. The determination of newpopulation
θ
i,
G+1, is obtained from, ,
, , ,
, , , ,
1
,
, ( ) ( ) ( ),
, ( ) ( ) ( ) ( )
,
,
,
i G i G
i i G i G i G
i i G i G i G i G
i G
i G
G if f f f
G if f f f f and
else
µ θ
µ θ µ ε θ
µ θ µ ε θ ε θ
θ
β β
θ
+
− >
− > <
=
<
(4)
Where, f (·) is the fitness function and ε is a preset tolerance rate. Once the new population is generated, the DE process is repeated until the goal is met or when a preset maximum learning epochs is completed (Liu and Wang, 2010). The accuracy of classification models with different type of activation functions such as sigmoidal, sine, hardlim, triangular basis and radial basis functions for varying number of epochs from 10 to100 is estimated and analyzed. Accuracy is ratio of addition of True Positives (TP) and True Negatives (TN) to total number. The TP and TN are the cases where the abnormal is classified as abnormal and normal classified as normal, respectively.
RESULTS AND DISCUSSION
(a) (b)
Fig. 1: Typical (a) normal (b) abnormal
Analysis of Compressive Region using Contourlet Transform:
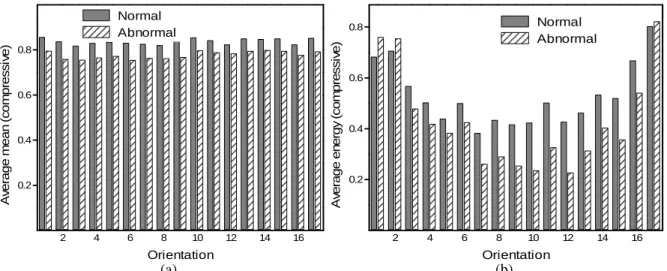
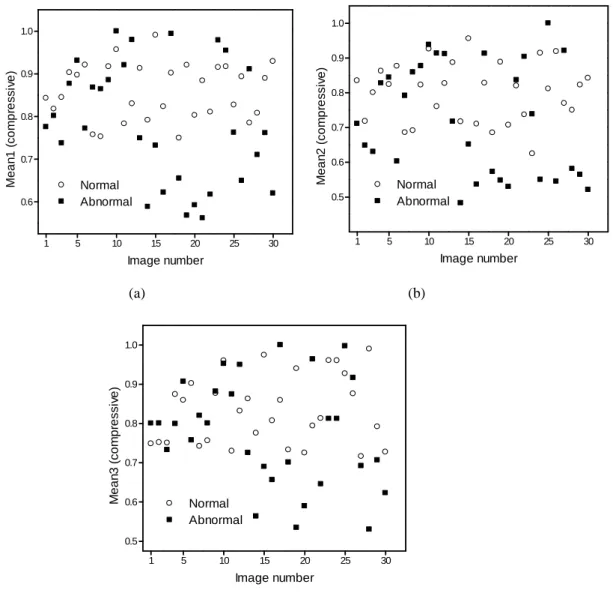
Figure 2(a) shows the average mean values for compressive region of normal and abnormal images derived at different orientations and scales using contourlet transform co-efficient. In all orientations and scales, the mean values are slightly high for normal images. Figure 2(b) shows the average energy values for compressive region of normal and abnormal images derived at different orientations and scales using contourlet transform. It shows a discernible difference between normal and abnormal images at all orientations. In normal images, the energy values are high for orientations 3 to 16. These energy values are found to be high for lower and higher orientations of abnormal images. Figures 3 (a), (b) and (c) shows the scattergrams of normalized mean values of compressive region of the individual images for the first three significant orientations(mean1, mean2, mean3) respectively. It is observed that significant variations are not observed between normal and abnormal images. The mean of few abnormal images are found to fall in the same range for all three significant orientations. Hence this feature could be useful in distinguishing a few abnormal images.
2 4 6 8 10 12 14 16
0.2 0.4 0.6 0.8
A
ve
ra
g
e
m
e
a
n
(
c
o
m
p
re
s
s
iv
e
)
Orientation Normal
Abnormal
2 4 6 8 10 12 14 16
0.2 0.4 0.6 0.8
A
ve
ra
g
e
e
n
e
rg
y
(c
o
m
p
re
s
s
iv
e
)
Orientation Normal Abnormal
(a) (b)
Fig. 2: Average mean and energy values for compressive region of normal and abnormal images at different
Orientations.
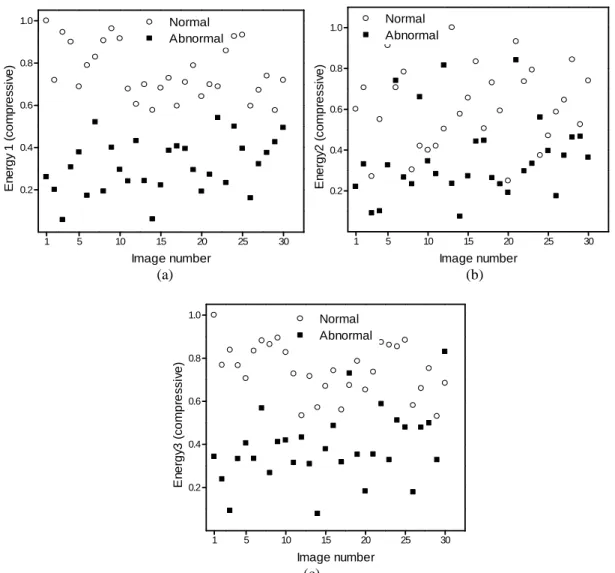
The energy values of the first three significant orientations (energy1, energy2, energy3), obtained for the compressive region of normal and abnormal images are shown in Figure 4(a), (b) and (c). It is seen that the energy values show better differentiation between normal and abnormal images when compared to the mean feature. Further, the energy1 and energy3 show clear demarcation between normal and abnormal images. This shows that contourlet is able to extract trabecular changes that occur in the compressive region.
1 5 10 15 20 25 30 0.6
0.7 0.8 0.9 1.0
Normal Abnormal
M
e
a
n
1
(
c
o
m
p
re
s
s
iv
e
)
Image number
1 5 10 15 20 25 30
0.5 0.6 0.7 0.8 0.9 1.0
Normal Abnormal
M
e
a
n
2
(
c
o
m
p
re
s
s
iv
e
)
Image number
(a) (b)
(c)
Fig. 3: Scattergram of mean values of (a) first (b) second and (c) third significant orientations compressive
region
Analysis of Tensile Region using Contourlet Transform:
Figure 5(a) shows the average values of mean for the tensile regions of normal and abnormal images derived at different orientations and scales using contourlet transform. This feature is found to have distinct separation between normal and abnormal images at all orientations. Also, the mean values are found to be high in all orientations and scales for normal images and low for abnormal images with varying magnitudes. Also in some orientations, the magnitude of the average mean value is very high. This explains the varying anisotropic nature of trabecular architecture and also demonstrates that the homogeneity of the trabecular structure is orientation dependent. Figure 5(b) shows the average values of energy in the tensile region for different orientations. It is noticed that in the lower and higher scale the energy values are found to be high for normal images whereas they have lower magnitude in other orientations. This again proves the fact that trabecular variation is orientation dependent.
1 5 10 15 20 25 30
0.5 0.6 0.7 0.8 0.9 1.0
Normal Abnormal
M
e
a
n
3
(
c
o
m
p
re
s
s
iv
e
)
1 5 10 15 20 25 30 0.2
0.4 0.6 0.8
1.0 Normal
Abnormal
En
e
rg
y
1
(
c
o
m
p
re
s
s
iv
e
)
Image number
1 5 10 15 20 25 30
0.2 0.4 0.6 0.8
1.0 Normal Abnormal
E
n
e
rg
y2
(
c
o
m
p
re
s
s
iv
e
)
Image number (a) (b)
1 5 10 15 20 25 30
0.2 0.4 0.6 0.8
1.0 Normal
Abnormal
E
n
e
rg
y3
(
c
o
m
p
re
s
s
iv
e
)
Image number (c)
Fig. 4: Scattergram of energy values (a) first (b) second and (c) third significant orientations in compressive
region
2 4 6 8 10 12 14 16 0.2
0.4 0.6 0.8
A
ve
ra
g
e
m
e
a
n
(
te
n
s
ile
)
Orientation Normal
Abnormal
2 4 6 8 10 12 14 16
0.2 0.4 0.6
A
ve
ra
g
e
e
n
e
rg
y
(t
e
n
s
ile
)
Orientation
Normal Abnormal
(a) (b)
Fig. 5: Average mean and energy values for tensile region of normal and abnormal images at different
orientations
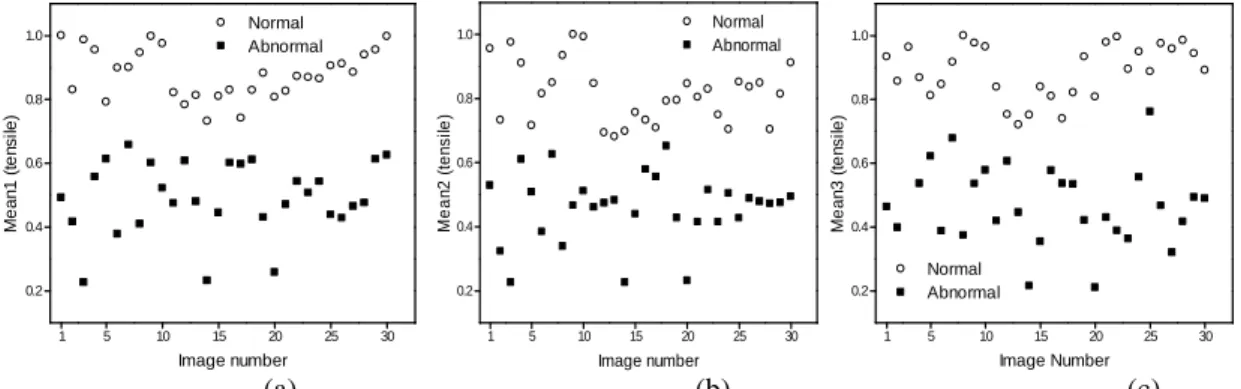
alteration is present in different degree for all the orientations in tensile region of the abnormal region. The scattergram of energy values of the tensile region of normal and abnormal images for first three significant orientations are shown in Figure 7(a), (b) and (c) respectively. Energy values of all the three orientations are found to show better demarcation between normal and abnormal images. This also exhibits that trabecular alteration is present with different magnitude for the orientations of tensile region of the abnormal image. When compared to compressive region, tensile region shows better demarcation between normal and abnormal images in all the three orientations.
1 5 10 15 20 25 30
0.2 0.4 0.6 0.8
1.0 Normal
Abnormal M e a n 1 ( te n s ile ) Image number
1 5 10 15 20 25 30 0.2
0.4 0.6 0.8
1.0 Normal
Abnormal M e a n 2 ( te n s ile ) Image number
1 5 10 15 20 25 30 0.2 0.4 0.6 0.8 1.0 Normal Abnormal M e a n 3 ( te n s ile ) Image Number
(a) (b) (c)
Fig. 6: Scattergram of mean values (a) first (b) second and (c) third significant orientations in tensile region
1 5 10 15 20 25 30
0.2 0.4 0.6 0.8
1.0 Normal
Abnormal E n e rg y1 ( te n s il e ) Image number
1 5 10 15 20 25 30
0.2 0.4 0.6 0.8
1.0 Normal
Abnormal E n e rg y2 ( te n s ile ) Image number
1 5 10 15 20 25 30
0.2 0.4 0.6 0.8 1.0 Normal Abnormal E n e rg y3 ( te n s ile ) Image number
(a) (b) (c)
Fig. 7: Scattergram of energy values of (a) first (b) second and (c) third significant orientations in tensile region
20 40 60 80
75 80 85 90 95
Compressive region (sigmoidal) Tensile region (sigmoidal)
A c c u ra c y ( % )
Number of epochs
Fig. 8: Classification using EELM (a) compressive and (b) tensile region
achieving the accuracy in classification at higher epochs. EELM uses less number of epochs for classification in tensile region compared to compressive region. This is due to distinct separation between normal and abnormal images exhibited by features derived from tensile region. Hence the accuracy of classifiers for tensile region is high when compared with compressive region. Also EELM has high accuracy and is found to be the optimal classifier in distinguishing normal and abnormal human femur bone images using features obtained from analysis.
Conclusions:
Analyses of medical images using transform based methods are shown to be effective for various clinical inferences. Especially, they are used to extract variations manifested in images in the form of discontinuities and irregular patterns. In this work, contourlet transform is employed to analyze regional strength variations in trabecular bone structure using radiographic femur images. The results reveal that it is possible to differentiate normal and abnormal images using contourlet transform features derived from tensile and compressive regions. The architectural variations are more in the tensile when compared to compressive trabecular region. The observed changes are attributed to varying degree of trabecular bone loss, homogeneity and discontinuity. Thus it appears that contourlet transform based feature extraction together with EELM classification seems to be useful for regional strength and trabecular architectural analysis.
REFERENCES
Ascenzi, M.G., N. Hetzer and A. Lomovtsev et al., 2011.Variation of trabecular architecture in proximal femur of postmenopausal women. J.Biomech, 44: 248-256.
Corroller, T.L., J. Halgrin and M. Pithioux, 2011. Combination of texture analysis and bone mineral density improves the prediction of fracture load in human femurs. Osteoporosis Int, 23: 163-169.
Do, M.N and M. Vetterli, 2005. The contourlet transform: an efficient directional multiresolution image representation. IEEE T. Image Process, 14(12): 2091-2106.
Donnelly, E., 2011. Methods for assessing bone quality: A review. Clin. Orthop. Relat. Res, 469: 2128-2138.
Elisabeta, E.H., 2011. Adaptive histogram equalization in GIS. Annals of the University of Craiova,Mathematics and Computer Science Series, 38(1): 100-104.
Jaclynn, M.K and A.G. Steven, 2009. Trabecular bone mechanical properties in patients with fragility fractures. Clinical Orthopaedics and Related Research, 467: 1955-1963.
Kastner, M., A. Sawka and K. Thorpe et al, 2011. Evaluation of a clinical decision support tool for osteoporosis disease management: protocol for an interrupted time series design. Implement Sci [Online], 6: 77, Available: http://www.ncbi.nlm.nih.gov/pubmed/21781318.
Lespessailles., E.C., Chappard and N. Bonnet, 2006. Imaging techniques for evaluating bone microarchitecture. Joint Bone Spine, 73(3): 254-261.
Liu, N and H. Wang, 2010. Ensemble based extreme learning machine, IEEE Signal Proc.Let, 17(8):754-757.
Malhotra, N and A. Mithal, 2006. Osteoporosis in Indians Indian. J.Med.Res, 127: 263-268.
Moayedi, F., Z. Azimifar, R. Boostani and S. Katebi, 2010. Contourlet-based mammography mass classification using the SVM family . Computers in Biology and Medicine, 40: 373-383.
Podsiadlo, P., L. Dahl, M. Englund, L.S. Lohmander and G.W. Stachowiak., 2008. Differences in trabecular bone texture between knees with and without radiographic osteoarthritis detected by fractal methods. Osteoarthr. Cartilage, 16: 323-329.
Qin-Yu, Z., A. K. Qin, P.N. Suganthan and H. Guang-Bin, 2005. Evolutionary extreme learning machine. Pattern Recogn, 38: 1759-1763.
Rong, H.J., H. Guang-Bin and O. Yew-Soon, 2008. Extreme learning machine for multi-categories classification applications. In Proc. of IEEE International Joint Conference on Neural Networks, Hong Kong, pp: 1709-1713.
Samonwoy, G.D., H. Adeli and N. Dadmehr, 2008. Principal component analysis-enhanced cosine radial basis function neural network for robust epilepsy and seizure detection. IEEE T. Biomed. Eng, 55(2): 512-518.
Singh, M., A.R. Nagarath and P.S. Maini, 1970. Changes in trabecular pattern of the upper end of the femur as an index of osteoporosis. J. Bone Joint Surg. Am, 52: 457-467.
Valero, M., J.C.F. Garcia and J.C. Catala, 2010. Implant treatment in patients with osteoporosis. Medicina Oral Patologia Oral Cirugia Bucal, 1: 52-57.