O R I G I N A L R E S E A R C H
Open Access
An enhanced cascading failure model
integrating data mining technique
Qiming Sun
1, Libao Shi
1*, Yixin Ni
1, Dajun Si
2and Jizhong Zhu
3Abstract
An enhanced cascading failure model integrating data mining technique is proposed in this paper. In order to better simulate the process of cascading failure propagation and further analyze the relationship between failure chains, in view of a basic framework of cascading failure described in this paper, some significant improvements in emerging prevention and control measures, the subsequent failure search strategy as well as the statistical analysis for the failure chains are made elaborately. Especially, a sequential pattern mining model is employed to find out the association pertinent to the obtained failure chains. In addition, a cluster analysis model is applied to evaluate the relationship between the intermediate data and the consequence of obtained failure chain, which can provide the prediction in potential propagation path of cascading failure to reduce the risk of catastrophic events. Finally, the case studies are conducted on the IEEE 10-machine-39-bus test system as benchmark to demonstrate the validity and effectiveness of the proposed enhanced cascading failure model. Some preliminary concluding remarks and comments are drawn.
Keywords:Cascading failure, Emerging prevention and control measures, Subsequent search strategy, Sequential pattern mining, Cluster analysis
Introduction
In recent years, many blackouts occurred around the world due to the increasing complexity and immensity of modern power systems. So far, there have been over 10 large-scale blackout events, such as the US-Canadian blackout of August 14th, 2003 [1], the UCTE blackout of November 4th, 2006 [2], the blackout in Brazil power grid on November 10th, 2009 [3], the India blackouts of July 30 and July 31, 2012 [4] etc., occurred since 2000. It has been generally acknowledged that the cascading fail-ure is one of the main root causes which leads to the se-vere blackout events.
Several kinds of theories and methods have been pro-posed to investigate cascading failure: some of them are based on self-organized critically (SOC) theory, includ-ing the OPA model [5], which considers the SOC of the growth of load demand and power supply, the CAS-CADE model [6, 7], which simulates cascading failure from initial disturbance and load growth, and the
branching process model [8] etc.; some theories based on network topology analysis [9–12], which analyze cas-cading failure through distinguishing the topological fea-ture of power system, like small-world network, scale-free network and so on; pattern search strategy [13–19], which aims to reveal cascading failure directly through searching failure chains in accordance with previously given strategy, etc. Among these pattern search strat-egies, the traditional ways can already simulate the process of cascading failure to a certain extent. However, some problems disclosed from important procedures make them hard to fully reflect the actual process and reaction of cascading failure. Firstly, the emerging pre-vention and control measures applied in traditional models only consider one means commonly, and the op-erability of measures taken is usually poor. Besides, the restriction of subsequent failure search is quite strict as well as some key factors are not considered, like the dur-ation time of overload state and the distance to previous failures. What’s more, the obtained data from the statis-tical methods can only describe some basic characteris-tics of cascading failure to some extent. However, some key information such as the correlation between the * Correspondence:[email protected]
1National Key Laboratory of Power Systems in Shenzhen, Graduate School at
Shenzhen, Tsinghua University, Shenzhen 518055, People’s Republic of China Full list of author information is available at the end of the article
former event chain and the subsequent one is difficult to be revealed. At the same time, data from intermediate process in cascading has not been used at all. Therefore, it is imperative for the inherently existed and generated data during cascading failure analysis to be explored and exploited elaborately further.
In this paper, an enhanced cascading failure model is proposed. In this model, a new kind of emerging preven-tion and control measures considering both effect and operation are proposed to make sure these actions close to practical situation as could as possible. Additionally, an improved subsequent search strategy including over-load failure and hidden failure is introduced to search failure more realistically. Especially, a kind of sequence pattern mining model is employed to analyze the obtained failure chains comprehensively, from which the association of failure lines can be obtained. Besides, a kind of cluster analysis model is employed to analyze the relationship between the intermediate data and the result data. These relationships obtained are beneficial to cascading failure predictions. Finally based on IEEE 10-machine-39-bus test system, the simulations are conducted to demonstrate the effect-iveness of the proposed model. The relevance of cas-cading failure is also analyzed as well as some useful information is drawn.
The rest of the paper is organized as follows: In Section 2, the basic framework of cascading failure search is introduced. The detailed enhanced cascading failure model, including emerging prevention and con-trol measures, subsequent failure search strategy and data mining technique (including sequential pattern mining model and cluster mining model) is discussed in Section 3. The case studies with different simulation sce-narios are carried out in Section 4. Finally, conclusions can be found in Section 5.
Basic framework of cascading failure
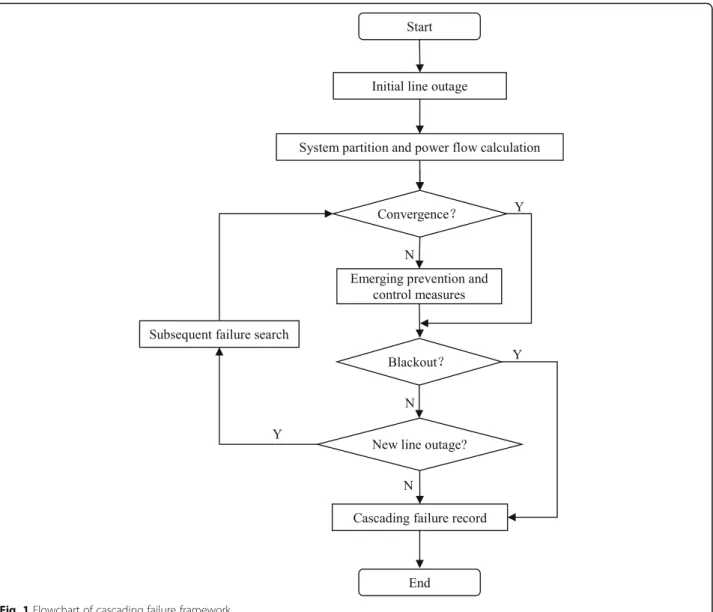
In order to simulate the specific processes of cascad-ing failure, a basic model of cascadcascad-ing failure [13–18] is introduced in this paper. The basic model mainly includes 3 parts, which are initial line outage, emer-ging prevention and control measures and subsequent failure search, respectively. The flowchart of this model is shown in Fig. 1, and the detailed procedures are described as follows:
1) Initial line outage: Set a line as an initial failure chain under normal operating condition. The initial outage line can be generated randomly or set specifically.
2) System partition and power flow calculation: Divide the system into several sub-regions based on current network topology and choose these regions which
can operate independently. Calculate power flow in each region.
3) Emerging prevention and control measures: If the power flow calculated in any sub-regions diverged, the stability measures are activated, the most com-mon of which is load shedding. Currently, the widely used load shedding methods mainly involve overall load shedding strategy [14] and under specific volt-age load shedding strategy [15].
4) Blackout judgement: Calculate load losses of the whole test system. If all loads are lost, the search is stopped. That means a blackout event occurred. 5) Subsequent failure search: Identify and determine
whether there exist the subsequent failures,
including overload failure and hidden failure. If there are no failures, stop searching.
a) Overload failure: Choose part of the overload lines as failure lines in the next layer.
b) Hidden Failure: A kind of failures existed in protection system, commonly these lines near failures in the previous layer are more likely to be selected [18,19].
6) Cascading failure record: Record this search process when it has been finished. Conduct the statistical analysis pertinent to the simulation results.
Discussion and Methods
Based on the aforementioned basic framework of cas-cading failure, an enhanced model is proposed in this section. Compared with the basic model, the corre-sponding improvements mainly focus on emerging pre-vention and control measures, subsequent failure search strategy and results analysis.
Emerging prevention and control measures
In this paper, both load shedding and generator tripping are considered during analysis. For the situation of power flow diverged, the generator tripping or load shedding strategy will be activated, and the correspond-ing strategy selection is due to the total generation out-puts and loads. These two strategies are both based on a kind of power flow tracing technique [20]. Given that the applied stability and control measures for the two strategies are similar, here only the load shedding strat-egy is taken as the example to illustrate the implementa-tion details.
Power flow tracing technique is an effective method to obtain the relationship between power sources and loads. Through this method, the source generations and destination loads of failure lines can be distinguished and the specific influence degree can be calculated, which is significant to specify the influenced nodes.
influenced by the failures positioned in previous layer, and an index named “Degree of Failure Impact (DFI)”is defined to evaluate the degree of influence:
DFI¼ω1PP
lþω2 P
Pf ð1Þ
where P and Pl are the influenced load power and the current load power of studied node respectively;
Pf is the total load power of the previous failure line; ω1 and ω2 are coefficient values related to power
system. They can be determined by using variation coefficient method. It can be seen that the physical meanings of Eq.(1) denotes the proportion of the in-fluenced load power accounted for by the total amount of load power and all influenced load powers of the studied node, respectively.
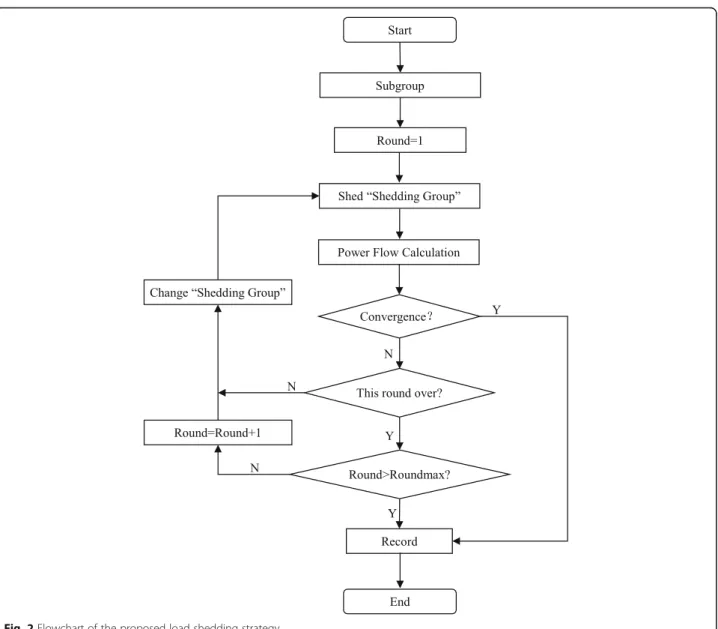
In this strategy, if the DFI index of a node reaches a given threshold, the “influenced node” will perform load shedding firstly. All nodes will be divided into several groups according to the DFI level, and such group with lager value of DFI will perform load shed-ding firstly. After performing load shedshed-ding for all in-fluenced nodes, the under specific voltage load shedding strategy will be applied for remaining nodes. In addition, considering the reactions of actual power system, the action of load shedding should be divided into several rounds instead of shedding all loads once. Operations in each round have exactly the same form, and the detailed procedures shown in Fig. 2 can be de-scribed as follows:
1) Subgroup: Divide load nodes into groups according to DFI value from large to small at
regular intervals, the first of which is defined as the current “Shedding Group”.
2) Shedding load: For nodes in the current
“Shedding Group”, perform the load shedding strategy as a preset proportion and calculate power flow. If the power flow is still diverged, go to 3), else go to 4).
3) Change Shedding Group: Check whether all groups in this round have finished the load shedding, if so, go to the next round and set the first group as the current “Shedding Group”, if all rounds are over but the system is still diverged, that means this sub-region collapses, go to 4); if not, change the next group as the current
“Shedding Group”, continue to 2).
4) Record: Save load shedding record, stop process.
In our work, total 3 rounds are set, proportion of which are 50, 30 and 20%, respectively, and the load shedding has a 5% minimum restriction at each time period. In each round, the load shedding will be per-formed according to the order mentioned above until the power system returns to the normal operating condition.
The corresponding simulation results can prove the ef-fectiveness of this proposed strategy. For example, re-garding the obtained failure chain l1, l14, l44, l26, l6, l7 and l8 in IEEE-39 test system, if using under specific voltage load shedding strategy, the load losses will be 1138.2 MW, while when using the proposed load shed-ding strategy, the load losses are only 446.5 MW. Besides, the stability of power system is also improved. For the previous example, the voltage variance after
shedding load is used to evaluate the system stability, and the value when using the proposed strategy is only 10% of the value when using under specific voltage load shedding strategy.
Subsequent failure search strategy
In most conventional cascading failure models, the num-ber of failure lines in the same layer is mainly restricted to 1 or 2. However the number of failures occurred at the same time is uncertain. Considering the actual black-out events, the number of failures occurred at the same time is still limited. Hence in this section only the prob-ability of failure lines is discussed. The number of fail-ures in the same layer can be restricted to an appropriate number according to the needs of the stud-ied power system.
In this model, if the number of failures in the same layer is restricted, the failure lines can be se-lected according to the probability sorted in de-scending order. When the number of selected lines reaches the restriction or all possible lines are de-cided whether they are selected, the procedure of failure line selection is stopped.
For the overload failure, an index named “Line Load Ratio (LLR)” is defined to evaluate the degree of overload:
LLR¼Tlo=Tlr ð2Þ
whereTloandTlrare the normal and rated transmission power of studied line respectively.
In the conventional models, only the degree of over-load in the current layer is considered during analysis. In fact, the possibility of overloading for line is closely re-lated to both the overload degree and the duration time of overload. In this case the following piecewise function is proposed to describe the overload probability:
Pn¼
Pn−1 þ0:2 L0≤LLR≤L1
Pn−1þ0:4 LLR≥L1
0 LLR≤L0 8
<
: ð3Þ
where Pn is the overload probability of the n-th layer
(The initialP0is 0, and ifPnis greater than 1, the failure
occurs certainly), and L0and L1 are LLR thresholds re-lated to the system. In such way it can be seen that the overload possibility increases with the increase of over-load time.
For hidden failure, in the enhanced model, the power transfer will be taken into account to extend the possible line selection.
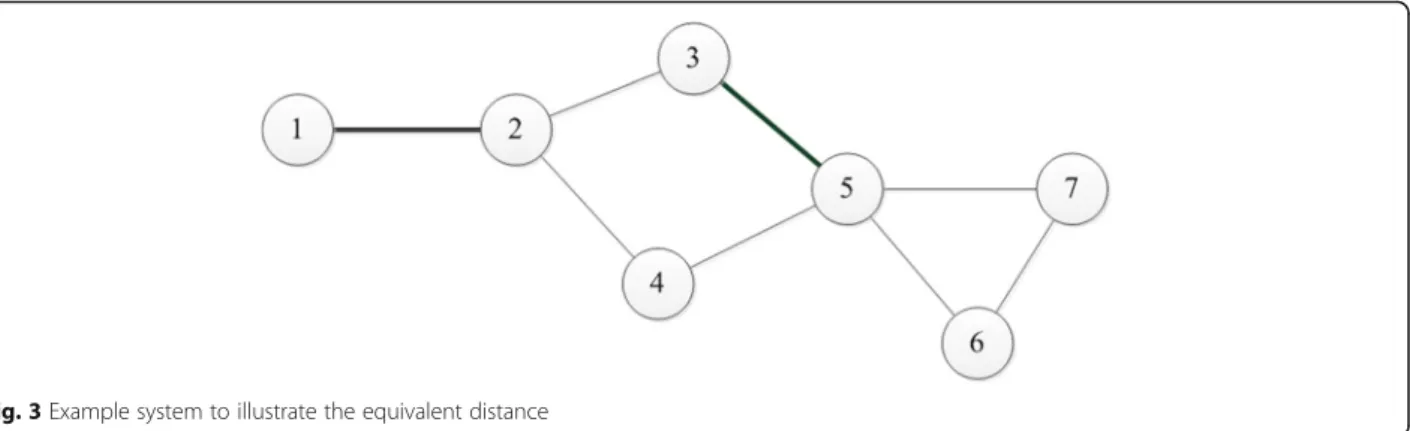
In regard to the distance, considering a line which may be near several previous failures, an index named “Equivalent Distance (ED)”is defined as:
ED¼ 1 1
D1þ
1
D2þ⋯
ð4Þ
whereD1and D2are the distances between the line and failures nearby (only such distance which is less than 3 is considered).
Here an example as shown in Fig. 3 is given to explain the equivalent distance. Suppose that the previous line is line 3–5 and line 1–2 (which is marked with thick line in Fig. 3). Accordingly the equivalent distance of line 2– 3 is 1/2 and the equivalent distance of line 4–5 is 2/3.
The shift amount of power flow is used to evaluate the degree of power transfer as given in following:
S¼jPP−Pnormj
norm X ð5Þ
where P and Pnorm are the power flows of the current
and previous layer. Considering the power system (espe-cially for the studied line) will be affected much more when the power flow increases. The coefficient of power flow change X is introduced. In this model, it will be 2 when the power flow increases and 1 when the power flow decreases.
The final probability is defined as the ratio of shift amount of power flow to the equivalent distance. It is also be restricted to an upper limit Phm considering hid-den failures.
Ph ¼ S
ED ð6Þ
Sequential pattern mining model
As mentioned above, the conventional statistical methods for the simulation results are hard to reveal some key information. In this paper, the sequential pat-tern mining technique [21] will be employed to analyze the failure chains.
Sequential mining technique is a kind of association analysis, which is mainly used to find sequential pat-terns. By sorting all the events associated with an object in increasing order of their timestamps, a sequence for the object is obtained.
Actually, the failures have time sequence. Therefore in this model, the failure chains are thought to be se-quences so that the sequence pattern mining technique can be introduced.
confidence value will be mainly employed to measure, while the support value will be used to make sure that the number of studied subsequence will not be less.
The traditional confidence value can be defined like following:
Cij¼Nij=Ni ð7Þ
whereCij is the confidence value of subsequencei-j, Nij
and Ni are the appearance number of this subsequence
and linei.
Considering the propagation process of cascading fail-ure, this subsequence cannot happen in some cases of which line j has already in failure chains before failure line i occurs. After removing this situation, the associ-ation probability of a subsequence is proposed to evalu-ate the correlation of lines:
Pij¼Nij=Ni0 ð8Þ
whereNi’ is the appearance number of lineiafter
remov-ing this situation.
In order to evaluate the losses of related lines, an index named “Sequence Load Loss (SLL)” is defined as the average load loss of failure chains which include the studied sequence. This proposed index can help to iden-tify some key sequences.
In addition to the conventional sequence pattern search, the relation between subsequences and results is also be researched. Here, a kind of result relation search strategy is proposed. After classification, the load loss will be added to the sequence as the last sub-item so that the relation can be revealed directly.
Cluster analysis model
In data analysis of cascading failure, a large part of data is ignored actually, which mainly involves the intermedi-ate data. In this paper, the cluster analysis technique [21] will be employed to analyze the relationship between the intermediate data and result data.
Cluster analysis groups data objects based only on information found in the data that describes the objects and their relationships. This technique can group and evaluate data without knowing possible re-lationship in advance.
For data of cascading failure, the relationship be-tween the intermediate data and result data cannot be obtained in advance. Through using cluster analysis technique, this kind of relationship can be found and evaluated.
Firstly, all studied data should be determined. For the result data, the load loss amount can be determined ab-solutely. For the intermediate amount, in this paper the indices which are related to a single failure layer are considered. Here, the load loss, the offset of low voltage and the shift amount of power flow of a single layer are introduced to evaluate its state.
The load loss of a single layer is the difference of remaining load between the previous layer and the stud-ied layer:
PLi¼Pi−1−Pi ð9Þ
wherePiis the remaining load of thei-th layer (The ini-tialP0is the load of the initial state).
The offset of low voltage is used to measure the degree of low voltage in the studied power system:
UOi¼ Xn
i¼1
ΔUi ð10Þ
wherenis the number of nodes operated currently, and ΔUiis the offset of low voltage to a single node, which is
defined as: (expressed in p.u. value)
ΔUi¼ 00:95−U Ui≥0:95 i Ui<0:95
ð11Þ
The shift amount of power flow in a single layer is the sum of shift amount in all operated lines which are positive.
Secondly, the method of cluster analysis should be de-termined. In this model, the agglomerative hierarchical clustering method will first be used to determine the number of clusters and initial centroids, and K-means al-gorithm will be used to implement the classification in detail. Consider that the result of K-means algorithm is related to initial centroids, the program will be run re-peatedly and the optimal solution will be chosen from multiple initial centroids.
Finally, the clusters obtained need to be evaluated. Commonly the silhouette coefficient, which combines both cohesion, and the separation is used. The silhouette coefficient can evaluate an individual point in terms of its closeness to its cluster. In this model, the average value of silhouette coefficients of all nodes is used to evaluate cluster results, and the number of larger silhou-ette coefficients is also a good reference.
Case studies
In this paper, the simulations are carried out on IEEE 39-bus test system, which contains 10 generators, 46 lines and 19 loads of 6150.1 MW, to illustrate the effectiveness and validity of the proposed enhanced model. The corresponding simulation parameters are listed in Table 1.
In order to reveal the effects of layer failure restric-tion, 2 similar simulation scenarios named S1 and S2 are designed. In S1, only one overload failure and one hidden failure are studied in failure chains, while in S2 the number is set to be 3. Considering the actual propagation of cascading failure, in S1 and S2, the upper limit of failure layer is limited to 6 and 5, respectively.
Total 10,000 trials are conducted in these 2 simulation scenarios and some meaningful conclusions can be drawn with following analysis results.
Results
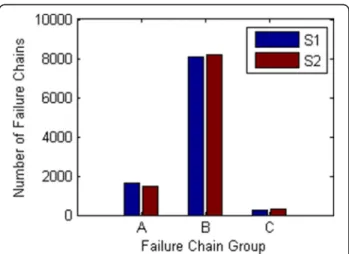
Total 20,000 failure chains are searched based on simulation scenarios S1 and S2. In this paper, there are 3 groups divided according to load losses: failure chains with no load losses are called as A-chain; fail-ure chains leading to load losses (except for black-outs) are called as B-chain; while failure chains leading to blackouts are called as C-chain. The overall statistical results are shown in Fig. 4. (groups marked with blue color are results from S1, while marked with read color are results from S2, hereinafter the same).
From Fig. 4, it can be found that the results from S1 and S2 are similar, which indicate that the failure chain group is not related to layer failure number. Additionally, most chains belong to B-chain while a few chains belong to C-chain. Such results are
consistent with the actual situation as the blackout events are hard to occur.
Statistical analysis
In order to analyze the failure chains in detail, the statis-tical analysis is used to obtain the basic information of failure chains. From this section, only failure chains be-longing to B-chain and C-chain are considered for the statistical results.
Firstly, the load losses caused by failure chains are counted in Fig. 5. From Fig. 5, it can be seen that the results from S1 and S2 are different: the load loss proportions in S1 are mainly from 10 to 30%; while in S2, the corresponding proportions are mainly from 30 to 50% and even excess over 50%. This kind of re-sults show that the layer failure number has a certain impart on load losses.
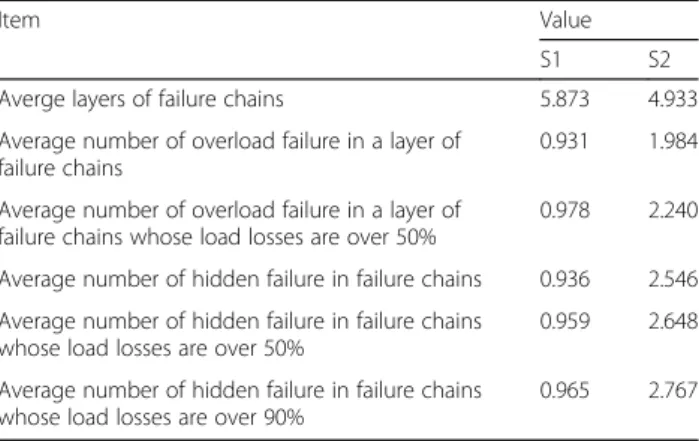
Besides, the statistical analysis results pertinent to failure type are listed in Table 2. From the table, it can be seen that the layer numbers of most failure chains reach the restriction. What’s more, the severe accidents are likely to cause more failures in a layer, especially for the hidden failures. This is consistent with the actual situation.
Sequence pattern mining analysis
In this section, the association probability and index SLL as mentioned above are used to identify the related lines and evaluate the corresponding losses respectively. Only
Table 1Simulation parameters
Parameter L0 L1 Phm
Value(p.u.) 1.3 1.6 0.3
when association probability is greater than 0.5, the sub-sequence can be thought as related lines.
Here two cases involving the hidden failure as a kind of failure and the normal failure are studied dur-ing analysis. For the first case, the association prob-ability is set to 0.4. Some simulation results are given in Tables 3 and 4, respectively (“I” denotes the initial failure, “O” denotes the overload failure, “H” denotes the hidden failure).
From Tables 3 and 4, it can be seen that various kinds of related lines can be found, including the fail-ures in different layers, even in multiple layers, and all types of failures including initial failure, overload failure and hidden failure can be found in Case 1. In addition, the related failures from S1 and S2 show up some differences, however they are generally consist-ent. Besides, the association probability and the se-quence load loss obtained from related failures can help to identify the importance of sequences. For ex-ample, the failure chain 44(I)-22(O) in S1 should be handled most carefully from Table 3.
On the other hand, the sequence pattern mining method can also be performed according to special needs. For example, suppose that the hidden failure of line 10 is very important in failure chains. In order to get more information of this failure, the chains containing this failure can be analyzed specially. It can be found that the sequences 3(I)-9(H), 10(H)-5(O), 37(H) appear frequently when the failure 10(H) happens. This kind of conclusion has a certain guid-ance in making counter-measures to the blackout events.
Finally, the simulation parameters given in Table 1 are changed to further verify this sequence pattern mining model. Parameters L0, L1 and Phm are changed to 1.4, 1.8 and 0.2 so that the failures are hard to occur. The se-quence pattern mining analysis results show that the most related lines whose relevancy is high are still kept, like sequence 46–6, 1–14, etc. The association
probability of some disappeared lines, like 20(H)-26(O), is not high originally. We can conclude that the related failure lines which have strong correlation are not af-fected by the simulation parameters.
Cluster mining analysis
In this section, the layer whose load losses are the high-est is chosen to conduct the analysis.
Firstly, the layer number of the chosen layer is ana-lyzed, and it can be found from results that the higher of the layer number, the more the selected times. This re-sult shows that the cascading failures are more likely to evolve the serious condition.
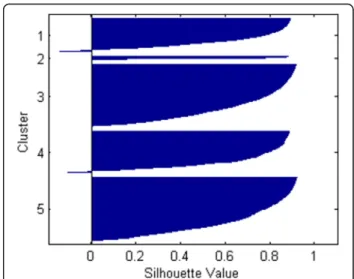
Before starting clustering analysis, the data obtained should be pretreated. In our work, the normalized method is used. For the convenience of subsequent analysis and emphasizing the importance of final chain results, the final load loss results are divided by 1000 directly. In this paper, the silhouette plot is used to describe the simulation results. The cluster analysis results from S1 and S2 are given in Figs. 6 and 7 respectively.
Fig. 5Statistics of load loss in failure chains
Table 3Partial results of related lines (Case 1)
Related Failures P SLL/MW Source
1(O)-14(O) 0.678 1535 S1
44(I)-22(O) 0.995 2202 S1
44(I)-16(O)-22(O) 0.833 2017 S1
44(I)-22(O) 0.982 3789 S2
20(H)-26(O) 0.434 1704 S1
20(H)-26(O) 0.432 3034 S2
1(O)-30(O) 0.459 2792 S2
6(O),5(H)-14(O) (compared with 6(O), 5(H) in same layer)
0.561 1744 S1
Table 2Statistical data pertinent to failure type
Item Value
S1 S2
Averge layers of failure chains 5.873 4.933
Average number of overload failure in a layer of failure chains
0.931 1.984
Average number of overload failure in a layer of failure chains whose load losses are over 50%
0.978 2.240
Average number of hidden failure in failure chains 0.936 2.546
Average number of hidden failure in failure chains whose load losses are over 50%
0.959 2.648
Average number of hidden failure in failure chains whose load losses are over 90%
From Figs. 6 and 7, it can be found that most points studied are suited to their clusters. In fact, the silhouette values of nearly half of points reach 0.8, and over 75% points reach 0.6. These results show that there exists a strong relationship between the layer of the highest load losses and the whole failure chain. The cluster results from S1and S2 are similar, which show that this relation-ship is not related to simulation sets.
Besides, the cluster centers should also be paid atten-tion. In this paper, taken S2 as an example, The coordi-nates of 5 centers are shown in Table 5.
From Table 5, it can be found that the higher of the final load losses, the higher of intermediate amount of the studied layer.
The sequence pattern mining analysis and the cluster mining analysis show that the interiors of cascading fail-ures have some relevance. This kind of relevance can provide some useful suggestions and guidance for the prevention and cure of cascading failure.
Conclusion
An enhanced cascading failure model integrating data mining technique is proposed in this paper. Some
significant improvements including the emerging pre-vention and control measures and the subsequent fail-ure search strategy are proposed to try to simulate the actual situation. Furthermore, a sequence pattern mining model and a cluster mining model are applied to make the anatomy of the failure chains deeply and comprehensively. By performing simulations on IEEE 39-bus test system, some related failure lines are ob-tained based on the proposed model and method. The relationship between the layer of the highest load losses and the whole chains is studied and analyzed. Additionally, some useful conclusions are drawn, in-cluding that the proposed emerging prevention and control measures can decrease load losses and im-prove system stability, and the severe failure chains are more likely to involve much more hidden failures. Comparative analysis shows that the related failure lines and the cluster relationships are not influenced by simulation parameters. Future work is under way to further improve the proposed enhanced model.
Table 4Partial results of related lines (Case 2)
Related failures P SLL/MW Source
46–6 0.848 1644 S1
46–6 0.809 3034 S2
9–19 0.551 1706 S1
9–19 0.649 2778 S2
1–14 0.657 1368 S1
1–14 0.608 2867 S2
42-19-14(compared with 42–19) 0.702 3958 S2
Fig. 6Cluster analysis results from S1
Fig. 7Cluster analysis results from S2
Table 5Coordinates of cluster centers (S2)
Number Layer load loss
Voltage offset
Shift amount of power flow
Final load loss
1 0.2841 0.0041 0.0086 4.2552
2 0.7150 0.2389 0.0191 5.8845
3 0.2344 0.0037 0.0131 3.2814
4 0.1344 0.0029 0.0058 1.5841
Acknowledgment
This work was supported by the National Basic Research Program of China, 973 program (2013CB228203).
Authors’contributions
QS wrote the manuscript and performed the experiments; LS conceived and designed the framework; YN reviewed and edited this manuscript; DS instructed the load shedding strategy; JZ reviewed and edited this manuscript. All authors read and approved the final manuscript.
Competing interests
The authors declare that they have no competing interests.
Author details
1National Key Laboratory of Power Systems in Shenzhen, Graduate School at
Shenzhen, Tsinghua University, Shenzhen 518055, People’s Republic of China. 2Research Centre of Power Grid Planning, Yunnan Power Grid Company,
Yunnan, China.3Electric Power Research Institute, CSG, Guangzhou, China.
Received: 15 December 2016 Accepted: 24 January 2017
References
1. U.S.-Canada Power system outage task force (2004). Final report. [Online]. Available: http://www.epa.gov/region1/npdes/merrimackstation/pdfs/ar/AR-1165.pdf.
2. Final report system Disturbance on 4 November 2006. [Online]. Available: http://www.ucte.org/_library/otherreports/Final-Report-20070130.pdf. 2007. 3. ANEEL Report on Nov 10, 2009 Brazil Blackout. [Online]. Available: http://
www.aneel.gov.br/aplicacoes/noticias_area/dsp_detalheNoticia. cfm?idNoticia=3338&idAreaNoticia=347. 2010.
4. Report on the Grid Disturbance on 30th July 2012 and Grid Disturbance on 31st July 2012. [Online]. Available: http://www.cercind.gov.in/2012/orders/ Final_Report_Grid_Disturbance.pdf. 2012.
5. Mei, S., He, F., Zhang, X., et al. (2009). An improved OPA model and blackout risk assessment.IEEE Transactions on Power Systems, 24(2), 814–823. 6. Dobson, I., Carreras, B. A., & Newman, D. E. (2005). A loading-dependent
model of probabilistic cascading failure.Probability in the Engineering and Informational Sciences, 19(1), 15–32.
7. Wu, H., & Dobson, I. (2013). Analysis of induction motor cascading stall in a simple system based on the cascade model.IEEE Transactions on Power Systems, 28(3), 3184–3193.
8. Kim, J., & Dobson, I. (2010). Approximating a loading-dependent cascading failure model with a branching process.IEEE Transactions on Power Reliability, 59(4), 691–699.
9. Watts, D. J., & Strogatz, S. H. (1998). Collective dynamics of‘small-world’ networks.Nature, 3(6684), 440–442.
10. Bompard, E., Wu, D., & Xue, F. (2011). Structural vulnerability of power systems: a topological approach.Electric Power Systems Research, 81(7), 1334–1340.
11. Chang, L., & Wu, Z. (2011). Performance and reliability of electrical power grids under cascading failures.International Journal of Electrical Power & Energy Systems, 33(8), 1410–1419.
12. Dey, P., Mehra, R., Kazi, F., et al. (2016). Impact of topology on the propagation of cascading failure in power grid.IEEE Transactions on Power Systems, 7(4), 1970–1978.
13. Wang, A., Luo, Y., Tu, G., et al. (2011). Vulnerability assessment scheme for power system transmission networks based on the fault chain theory.IEEE Transactions on Power Systems, 26(1), 442–450.
14. Rahnamay-Naeini, M., & Hayat, M. (2016). Cascading failures in
interdependent infrastructures: an interdependent Markov-chain approach.
IEEE Transactions on Smart Grid, 7(4), 1997–2006.
15. Nedic, D. P., Dobson, I., Kirschen, D. S., et al. (2006). Criticality in a cascading failure blackout model.Electrical Power and Energy Systems, 28(9), 627–633. 16. Z. Shi, L. Shi, Y. Nin, et al. (2011)“Identifying Chains of Events During Power
System Cascading Failure,”In: Power and Energy Engineering Conference (APPEEC). New York: Institute of Electrical and Electronic Engineers (IEEE). 17. Song, J., Cotilla-Sanchez, E., Ghanavati, G., et al. (2016). Dynamic modeling of
cascading failure in power systems.IEEE Transactions on Power Systems, 31(3), 2085–2095.
18. Chen, J., Thorp, J. S., & Dobson, I. (2005). Cascading dynamics and mitigation assessment in power system disturbances via a hidden failure model.
Electrical Power and Energy System, 27(4), 318–326.
19. Zhang, L. Y., Ding, L. J., Xiao, X. Y., et al. (2012). Risk assessment of power system cascading failure considering hidden failures and violation of temperature.Advanced Materials Research, 354, 1083–1087.
20. Li, C., Wang, J., & Yang, J. (2013). Analytical algorithm for tracing power flow.
Proceedings of the CSU-EPSA, 25(3), 119–123.
21. Tan, P. N., Steinbach, M., & Kumar, V. (2006).Introduction to data mining. New Jersey: Addison Wesley.
Submit your manuscript to a
journal and benefi t from:
7Convenient online submission
7Rigorous peer review
7Immediate publication on acceptance
7Open access: articles freely available online
7High visibility within the fi eld
7Retaining the copyright to your article