BEHAVIOR OF TRADITIONAL
TIMBER FRAME STRUCTURES
Richard J. Schmidt
Robert G. Erikson
A report on research co-sponsored by:
Department of Civil and
Architectural Engineering
University of Wyoming
Laramie, WY 82071
August 2003
SUBJECTED TO LATERAL LOAD
Timber Frame Business Council
Hamilton, MT
USDA NRI/CGP
Washington, DC
Timber Framers Guild
Becket, MA
REPORT DOCUMENTATION PAGE
1. REPORT NO. 2. 3. Recipient’s Accession No.
4. Title and Subtitle 5. Report Date
6.
7. Author(s) 8. Performing Organization Report No.
9. Performing Organization Name and Address 10. Project/Task/Work Unit No.
11. Contract(C) or Grant(G) No.
12. Sponsoring Organization Name and Address 13. Type of Report & Period Covered
14.
15. Supplementary Notes 50272--- 101
16. Abstract (Limit: 200 words)
17. Document Analysis a. Descriptors
b. Identifiers/Open--- Ended Terms
c. COSATI Field/Group
18. Availability Statement 19. Security Class (This Report)
20. Security Class (This Page)
21. No. of Pages
22. Price August 2003 Behavior of Traditional Timber Frame Structures Subjected to Lateral Load
Robert G. Erikson & Richard J. Schmidt
Department of Civil and Architectural Engineering University of Wyoming
Laramie, Wyoming 82071
Timber Frame Business Council 217 Main Street
Hamilton, MT 59840
traditional timber framing, heavy timber construction, structural analysis, wood peg fasteners, mortise and tenon connections, dowel connections, lateral load response
Release Unlimited
unclassified unclassified
221 final
Timber framing is a method of construction in which heavy timber members are connected with carpenter-style joinery and wood pegs. Timber frames are commonly enclosed with structural insulated panels (SIPs). Current building codes do not provide guidelines for wood structures with wood pegged connections. The intent of this research was to provide a basis for implementing provisions for this type of structure in building codes. Specifically, this project investigated the effects of lateral load on the stiffness of full-scale timber frames. The frames were tested in both the unsheathed and sheathed condition and were modeled with a structural analysis program. Load-slip characteristics for single-fastener SIP-to-timber connections were developed.
Excessive displacements of the frames indicated unacceptable flexibility when subjected to reversible lateral loads. This lack of stiffness was due to the inefficiency of knee braces for resisting lateral load. However, the knee brace system provided exceptional strength characteristics due to the substantial available compressive action of the joints. The addition of SIP sheathing significantly improved frame stiffness.
In order to accurately model the displacement characteristics of a frame, the characteristics of the pegged connections must be included in the model. For sheathed frame models, the implementation of nonlinear SIP-to-timber connection elements produced accurate predictions of sheathed frame stiffness.
(C) (G)
USDA NRI/CGP CSREES
Wash., DC 20250
Timber Framers Guild PO Box 60
Becket, MA 01223 USDA NRI/CGP Contract No. 97---35103---5053
Acknowledgments
Primary funding for this research project was provided by the USDA---NRI/CGP. Additional support was provided by the Timber Frame Business Council and the Timber Framers Guild. Timber frames were donated by The Cascade Joinery, Benson Woodworking, Riverbend Timber Framing, and Earthwood Homes. Structural insulated panels were donated by Great Lakes Insulspan and Premier Building Systems.
1. Introduction...1
1.1.Background...1
1.1.1. Definition of Traditional Timber Frame ...1
1.1.2. Engineering Design Difficulties ...2
1.2.Objectives ...3
1.3.Scope of Work ...4
1.3.1. Full-scale Testing...4
1.3.2. SIP Connection Testing ...6
1.3.3. Modeling ...7
1.4.Literature Review ...8
1.4.1. Unsheathed Frames...8
1.4.2. SIP Sheathed Frames ...13
1.5.Results...14
2. 1S1B Unsheathed Frame Testing ...16
2.1.Overview...16
2.2.Test Assemblies ...16
2.2.1. Frame Dimensions ...16
2.2.2. Frame Manufacturer and Species...18
2.2.3. Mortise and Tenon Joinery ...19
2.2.4. Peg species and size ...21
2.2.5. Member Dimensions...22
2.2.6. Knee Brace Joint Details...23
2.2.7. Beam to Column Connection...25
2.3.Experimental Program ...28
2.3.1. Test Setup...28
2.3.2. Load Magnitude ...29
2.3.3. Gravity Load ...31
2.4.Moisture Content and Joint Numbering ...32
2.5.Overview of Test Results...33
2.5.1. Douglas Fir...35
2.5.2. Eastern White Pine...35
2.5.3. Ponderosa Pine...36
2.5.4. Port Orford Cedar ...37
2.5.5. White Oak ...39
2.6.Results...40
2.6.1. Service Level Load Results ...40
2.6.2. Effect of Gravity Load ...42
2.6.4. Direct Measurement of Knee Brace Force...45 2.6.5. Unbraced Stiffness ...47 2.6.6. Cyclic Effects...49 2.6.7. Peg Effects ...50 2.6.8. Maximum Load...51 2.7.Summary...52
3. 2S2B Unsheathed Frame Testing ...54
3.1.Overview...54
3.2.Test Assemblies ...55
3.2.1. Frame Dimensions ...55
3.2.2. Frame Manufacturer and Species...56
3.2.3. Mortise and Tenon Joinery ...57
3.2.4. Peg species and size ...57
3.2.5. Member Dimensions...58
3.2.6. Knee Brace Joint Details...59
3.2.7. Beam to Exterior Column Connection...60
3.2.8. Beam to Interior Column Connection...62
3.3. Experimental Program ...65
3.3.1. Test Setup...65
3.3.2. Load Magnitude ...66
3.3.3. Gravity Load ...67
3.4.Moisture Contents and Joint Numbering...68
3.5.Overview of Test Results...69
3.5.1. Douglas Fir...69
3.5.2. Eastern White Pine...70
3.5.3. Port Orford Cedar ...71
3.5.4. White Oak ...71
3.6.Results...72
3.6.1. Service Level Load Results ...72
3.6.2. Effect of Removing Knee Brace Pegs ...74
3.6.3. Cyclic Effects...76
3.6.4. Maximum Load...78
3.7.Summary...82
4. Unsheathed Frame Structural Analysis...84
4.1.Overview...84
4.2.Model Details...84
4.3.1. Linear SAP Model ...86
4.3.2. Classical Model...89
4.3.3. 1S1B White Oak Nonlinear SAP Models...89
4.4.1S1B Results...92
4.4.1. Linear Frame Stiffness...92
4.4.2. Alternative Linear Model Comparisons...93
4.4.3. Joint Stiffness Effects ...98
4.4.4. 1S1B White Oak Comparisons for Models With Rigid, Linear, or Nonlinear Joints...99
4.4.5. Effects of Joint Stiffness and Knee Brace Distance on Frame Stiffness ...100
4.5.2S2B Frame Analysis ...103
4.5.1. SAP Model...103
4.6.2S2B Results...109
4.6.1. Frame Stiffness ...109
4.6.2. Alternative Model Comparisons ...109
4.7.Summary...114
5. Sheathed Frame Testing...115
5.1.Overview...115
5.2.Test Assemblies ...116
5.2.1. Frame and Panel Dimensions...116
5.3.Experimental Program ...120
5.4.Overview of Test Results...120
5.4.1. 1S1B Sheathed Douglas Fir ... 121
5.4.2. 1S1B White Oak ...121
5.4.3. 2S2B Douglas Fir...122
5.4.4. 2S2B Eastern White Pine...122
5.5.Results...124
5.5.1. Comparison of Unsheathed and Sheathed Frame Stiffness ...124
5.5.2. Effect of Adding a Sill Timber ...126
5.5.3. Effects of Multiple Load Cycles ...127
5.5.4. Effects of Screw Spacing ...128
5.5.5. Maximum Load Cycles...130
5.5.6. Effect of Openings ...135
5.6.Summary...137
6. SIP Connection Tests...138
6.1.Overview...138
6.3.Experimental Program ...141 6.3.1. Phase 1 ...141 6.3.2. Phase 2 ...142 6.3.3. Phase 3 ...143 6.4.Experimental Groups ...144 6.4.1. Phase 1 ...144 6.4.2. Phase 2 ...145 6.4.3. Phase 3 ...146 6.5. Results...147 6.5.1. Method of Analysis...147
6.6. Regression Coefficients and Yield Load ...151
6.7.Statistical Comparisons ...152
6.7.1. Phase 1 t-test ...153
6.7.2. Phase 2 t-test ...154
6.7.3. Phase 3 t-test ...155
6.8.Summary...156
7. Sheathed Frame Structural Analysis ...158
7.1.Overview...158
7.2.Model Details...158
7.2.1. Fastener Model Verification ...159
7.2.2. 1S1B White Oak Model...160
7.2.3. 1S1B Douglas Fir Model ...160
7.2.4. 2S2B Eastern White Pine Model ...162
7.3.Results...163
7.3.1. 1S1B White Oak Model...163
7.3.2. 1S1B Douglas Fir Model ...165
7.3.3. 2S2B Eastern White Pine Model ...167
7.4.Summary...169 8. Conclusions...170 8.1.Summary Statement...170 8.2.Qualified Recommendations ...170 8.3.Future Research ...175 9. References...176 10.Appendices...179 A. 1S1B Moisture Content...179
C. 1S1B Service Level Loading Without Added Gravity Load ...187
D. 1S1B Service Level Loading With Added Gravity Load ...189
E. 1S1B Maximum Load...191
F. 2S2B Moisture Content...193
G. Summary of 2S2B Load Cycles...198
H. 2S2B Service Level Loading ...201
I. 2S2B Maximum Load...203
J. Phase 1 SIP Connection Summaries of Curve Fits and Yield Load ...205
K. Phase 2 SIP Connection Summaries of Curve Fits and Yield Load ...207
L. Phase 3 SIP Connection Summaries of Curve Fits and Yield Load ...210
M. Phase 1 SIP Connection Load-Slip Curves...212
N. Phase 2 SIP Connection Load-Slip Curves...214
O. Phase 3 SIP Connection Load-Slip Curves...217
1.
Introduction
1.1. Background
1.1.1. Definition of Traditional Timber Frame
Timber framing is a method of construction in which a system of relatively large wood columns and beams is connected with wood pegs. The most common joint in this type of structure is a mortise and tenon pinned with a wood dowel or “peg.” Timber framing should not be confused with “post and beam” construction, which also utilizes large wood members but has joints connected with metal plates and fasteners.
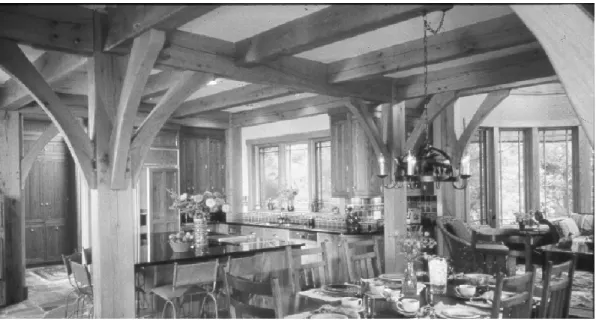
Timber frames are constructed as residences, public facilities, commercial and retail shops, and agricultural buildings. Historic covered timber frame bridges are common in the eastern United States. An example of the finished interior of a timber frame structure is shown in Figure 1-1. The photograph shows the large columns, beams, and knee braces typical of timber frame buildings along with traditional wood pegged, mortise and tenon joints.
Figure 1-1 Typical Timber Frame (courtesy of Riverbend Timber Framing) Timber frames may be enclosed in a variety of manners, but the most common enclosure system is the structural insulated panel (SIP). SIPs are constructed of oriented strand board (OSB) outer skins laminated to a foam core, thus creating a structural panel with excellent thermal properties.
The North American craft of traditional timber frame construction declined in the latter part of the 19th century and was replaced by the modern light-frame system.
However, beginning in the 1970’s, a renewed interest led to a revival of traditional timber framing methods.
1.1.2. Engineering Design Difficulties
Currently the engineered design of timber structures in the United States is based on the National Design Specification for Wood Construction (NDS) (AFPA 2001). The major building codes utilized by most jurisdictions in the United States are based on provisions specified in the NDS, which provides guidelines for design of structural
members as well as connections created with metal fasteners such as bolts, lag screws and nails. However, no such provisions exist for connections fastened with wood dowels.
At this juncture in the evolution of building design, timber frame structures are often designed based on the study of historic buildings. However, such a design method is not acceptable to either professional engineers or local building code officials. Also, no procedures exist to determine the load sharing between a timber frame and its enclosure system. To facilitate acceptance of wood-pegged structural connections and the use of SIPs on traditional timber frames, it is imperative that appropriate guidelines be developed and incorporated into the NDS. The research described herein is an important step towards acceptance of traditional timber frame structures.
1.2. Objectives
The goal of this study is to develop or identify behavior models that represent the full-scale response of two-dimensional timber frames subjected to lateral load. Frame performance will be modeled for both unsheathed and sheathed frames.
The objectives of this research are to:
1. Investigate the behavior of unsheathed two-dimensional timber frames subjected to lateral load.
2. Investigate the behavior of two-dimensional timber frames sheathed with structural insulated panels (SIPs) and subjected to lateral load.
3. Develop viable stiffness based methods of modeling the service-level behavior of stand-alone timber frames subjected to lateral load.
1.3. Scope of Work
1.3.1. Full-scale Testing
Two distinct frame types were examined. The first type consisted of one-story, one-bay (1S1B) frames, 12 feet wide by 8 feet high as shown in Figure 1-2. The second consisted of two-story, two-bay (2S2B) frames, 24 feet wide and 16 feet high frame as shown in Figure 1-3. Frame dimensions are measured from centerline to centerline of columns and from the base of the columns to the top of the beams. The frames were supplied by several manufacturers, and consequently, are of varying species and
construction details. Structural insulated panels (SIPs) were attached to selected frames with screws.
Figure 1-2 One-Story, One Bay Frame 12' 0"
Figure 1-3 Two-Story, Two-Bay Frame
The frames were tested by applying horizontal load to one side of the frame at the beam elevation(s). A single actuator was used for both frame types. Two equal point loads were applied to the 2S2B frame via a load splitting apparatus. The applied load was reversible, thus each frame was examined for performance in both directions. Each frame was typically displaced 3 inches in each horizontal direction, although additional lateral displacement was applied to selected frames. At a lateral displacement of 3 inches, a frame was assumed to be well beyond an acceptable level of serviceability.
Eight 1S1B frames and four 2S2B frames were tested. Dimensions and
descriptions of the individual structures are provided in Chapter 2 (1S1B) and Chapter 3 (2S2B). 12' 0" 12' 0" 8' 0" 8' 0" 16 ' 0 " 24' 0"
1.3.2. SIP Connection Testing
The individual SIP to frame connection was also considered in order to
characterize the performance of the sheathed frames. This was accomplished with the test setup schematically shown in Figure 1-4.
The connection tests examined several variables including timber species, grain orientation, fastener type, countersinking of the fastener, and the use of a shim between the panel and timber. Timber species included Douglas fir, eastern white pine and white oak. The panel was attached with either a 3/16-inch diameter screw or a 3/16-inch diameter ring shank nail. Load was applied with a universal testing machine.
Figure 1-4 SIP to Timber Connection Test Timber 7/16" OSB Steel Plate Fastener Foam
1.3.3. Modeling
Unsheathed frames were modeled with SAP 2000 version 8.16 (SAP 2003). All models were plane-frame structures with three degrees of freedom (DOF) per node. The structures were modeled in a relatively simple fashion with all knee braces pinned at each end, thus limiting their actions to axial force only. Beam-to-column connections were also modeled as pin connections.
Classical methods were also used to analyze the unsheathed 1S1B frames. Basic statics was used to predict frame actions, and frame stiffness was modeled using a work-energy method. For the classical models, the frame was assumed to have infinite material stiffness for frame elements such that all deformation occurred at the joints.
Behavior of single fastener SIP to timber connections was modeled from experimental load-slip relationships. Such relationships are of the form shown in
Equation 1.1 (Foschi, 1974) where P is the applied load, δ is the joint displacement, C is the initial slope of the curve, B is the final slope of the curve, and A is the point at which a line drawn tangent to the final slope intercepts the vertical axis.
1.4. Literature Review
1.4.1. Unsheathed Frames
There had been no published research on timber frames prior to the publication of a dissertation by Brungraber (1985). This extensive document describes exploratory research that included individual joint testing, full-scale frame testing, finite element analysis of joint behavior and a computer model that incorporated connection behavior. Brungraber’s computer simulation used finite element analysis to create a
two-dimensional frame model. A three-spring joint model was utilized to simulate connection behavior. The research by Brungraber raised many questions that have led to additional timber frame research at several institutions.
A limited amount of timber frame research has been completed in Germany by Kessel and Augustin. Kessel and Augustin first examined 12 wood-pegged connections and concluded that oak pegs have sufficient strength for use in modern wood construction (Kessel and Augustin 1995). Reconstruction of an eight-story timber frame in Germany (Kessel et al 1988) provided the impetus for Kessel and Augustin’s next investigation into wood-pegged connections (Kessel and Augustin 1996). Approximately 110 joint tests were conducted on oak and spruce samples joined with oak pegs.
Recommendations were proposed for short-duration allowable design loads based on peg diameter, minimum spacing of pegs, end and edge distance of pegs, and timber dimensions. The results of these tests are specific to the species and timber sizes used in the experiments, and extrapolation to other configurations was not recommended.
Several studies of timber frame behavior have been performed at Michigan Technological University. The first published work included the examination of 60 frame subassemblies including four different types of traditional joints (Sandberg et al 1996). The tests were conducted on partial frame assemblies including a column and beam section connected with or without knee braces. The results of these tests indicated a significant strength capacity of the joints but a weakness in the tensile capacity of knee brace connections. It is important to note, however, that the tests simulated gravity load, or uplift in the case of the tensile test, and the conclusions may not be representative of lateral load situations.
Researchers at Michigan Technological University published additional results in which individual joint tests were compared to the modified connection yield model (Sandburg et al 2000). These results provide strength predictions for joint configurations with white oak pegs and various geometric configurations. The load-displacement plots of this work are of particular interest. All of the plots exhibit low stiffness at initial loading of the specimen followed by increased stiffness as load increased. Although it was not discussed in their paper, the low initial stiffness may be a factor in full-scale frame behavior.
The characterization of dowel bearing strength in pegged connections was studied at the University of Idaho (Church and Tew 1997). The results of this research indicated that the effects of peg orientation and over-sizing of the peg hole by 1/8” or less had minimal effect on dowel bearing strength.
A significant number of timber frame research projects have been conducted at the University of Wyoming (UW). MacKay first conducted extensive tests on pegs and
base materials (Schmidt and MacKay 1997). These tests examined the bending and shear strength of pegs and the dowel bearing strength of wood pegs on base materials. Testing was also performed on a limited number of full-size mortise and tenon joints with two oak pegs. This study discovered additional dowel failure modes not described by the existing yield models for connection design.
Daniels continued the work at UW with additional material tests and full-scale joint tests (Schmidt and Daniels 1999). Daniels presented two main types of failure – ductile peg bearing and/or bending failures and brittle joint failures. As shown in Figure 1-5, Daniels presented two existing joint failure modes and proposed three new joint failure modes. Existing mode Im is a bearing failure of the tenon (main) member and
existing mode Is is a bearing failure of the mortise (side) member. Peg bearing failure
was proposed as mode Id. Peg bending failure with a single flexural hinge was proposed
as mode IIIm. The proposed mode Vd, is a shear failure with fractures due to bending near
ultimate loads.
Mode Im
Mode Is
Mode Id
Mode IIIm
Mode Vd
Typical failure of the tenon is shown in Figure 1-6. This type of failure is commonly called a relish failure and is characterized by a single split or a block shear failure behind the peg hole. Providing adequate end distance on the tenon can control this failure mode.
Split Block Shear
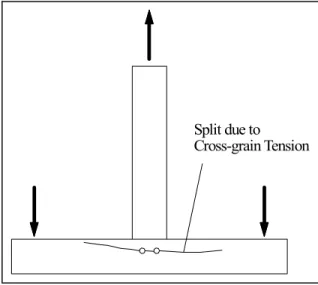
Figure 1-6 Tenon Relish Failure (Schmidt and Daniels 1999) As shown in Figure 1-7, failure of the mortise member is characterized by
splitting due to tension perpendicular to grain. This failure is a result of inadequate edge distance from the peg hole to the loaded edge of the mortise member.
Split due to Cross-grain Tension
Figure 1-7 Mortise Member Failure Due to Tension Perpendicular to Grain (Schmidt and Daniels 1999)
Daniels proposed minimum detailing requirements for end distance, edge
distance, and spacing such that joint failure will occur only after significant deformation of the peg.
In many of the load versus displacement curves of the work by Daniels, there is the aforementioned low stiffness at low load. That is to say, stiffness increases
significantly after the joint displaces a finite distance.
Scholl completed testing of individual joints at the UW by studying load-duration and seasoning effects (Schmidt and Scholl 2000). Scholl revised Daniel’s minimum detailing requirements and proposed that one peg diameter be added to the end distances when drawboring is used.
Scholl conducted long-term seasoning and load duration tests. He concluded that the yield values for the long-term tests were not significantly different from short-term tests. Scholl also concluded that seasoning effects were a concern in white oak joints, where differential shrinkage created tenon splitting.
The load-deflection plots of the work performed by Scholl also demonstrate the low stiffness near zero displacement with an increase in stiffness corresponding to increased joint displacement.
There are several books that discuss the history, architecture, and construction of timber frame structures (Benson and Gruber 1980, Sobon and Schroeder 1984, Sobon 1994, and Benson 1997). Unfortunately, they do not provide information about the strength and stiffness of wood pegged joints relative to the specifics of joint design. However, one author provides a brief statement that proved to be an apt insight to the results of the work to be described henceforth. Benson (1997) states that knee brace
joints in compression are likely to provide much more resistance to racking loads than are tension joints. The results of the experiments described herein have shown this statement to be quite sage.
1.4.2. SIP Sheathed Frames
Published work discussing the lateral load resistance of SIP enclosed timber frame is limited to a paper by Carradine (2002). The work by Carradine investigated the parallels between metal clad and SIP clad timber frames.
There is a significant quantity of published research on testing and analysis of individual laterally loaded nailed joints and on testing and analysis of full-scale light-frame walls subjected to lateral load. It is commonly accepted that the load-deflection behavior of shear walls is primarily a function of the individual connection
characteristics. Several researchers have investigated load-slip behavior of fasteners in light-frame construction. A small sample of the available literature is reviewed here. Based on work by Kuenzi (1955), Wilkinson (1971, 1972) developed a theoretical
solution for the lateral stiffness of nailed joints. Foschi (1974) developed a finite element solution for the lateral behavior and the finite element solution was expanded by many including Malhotra and Thomas (1982) and Hunt and Bryant (1990).
The connection research described above has focused on nailed or bolted joints. There are guidelines for nailed or screwed connections in the NDS (AFPA 2001) and the Wood Handbook (1999). However, there is no published research relating to the lateral load resistance of long screws with large thread pitch typical of SIP on timber
Schmidt and Moody (1989) developed a model called Rack3D for predicting deformations and load distribution of laterally loaded light-frame buildings. This model incorporates nonlinear load/slip curves for fasteners to predict nonlinear behavior of full-scale frames.
1.5. Results
The results of this study have led to several recommendations that are intended for use by those who design, engineer and build timber frames. These recommendations will also be of assistance to those who write code rules specific to the timber frame industry and to those who implement such codes. The following paragraphs provide a brief summary of these recommendations, and a complete discussion is provided in Chapter 8.
The most important result of this study is the demonstrated lack of stiffness of an unsheathed frame subjected to lateral load. Based on this finding, it is recommended that structural loads on timber frames be limited to gravity loads with lateral loads carried by SIP sheathing, conventional shear walls or a similar structural system. If a timber frame is designed such that it must carry lateral load, knee braces should be as long as possible, and the frame should be constructed of a relatively dense material such as white oak. Also, all joints should have at least two pegs, and detailing should follow
recommendations of previous research (Schmidt and Daniels 1999), (Schmidt and Scholl 2000).
The stiffness of a wood-pegged timber frame is highly dependent on the stiffness of the individual pegged connections. Therefore, structural timber frame models should include the stiffness characteristics of all connections. Inclusion of joint stiffness will
facilitate correct modeling of overall frame stiffness and internal actions. Accuracy of frame stiffness models can be improved through the use of nonlinear joint elements.
SIPs should be designed and installed within the following guidelines. Panels should be installed with fasteners located around the full perimeter of the panel. The use of shims between SIPs and frame members should be avoided. Panel joints should be located at frame members. SIPs should be fastened with screws rather than nails. Since the results of this study demonstrate reduced connection properties for 6-inch SIPs as compared to 4-inch SIPs, lateral load resisting frames should be designed with the thinnest possible panel. Computer models of sheathed frames should use nonlinear load-slip properties to simulate the behavior of laterally loaded SIP-to-timber connections.
2.
1S1B Unsheathed Frame Testing
2.1. Overview
The primary objective of this part of the research project was to characterize the full-scale response of two-dimensional one-story, one-bay (1S1B) timber frames
subjected to lateral load. In addition, these full-scale tests have presented the opportunity to closely observe the nuances of overall frame performance and individual joint
behavior. These timber frame characteristics have been noted and summarized as potential strengths or weaknesses of this type of construction.
The objective was accomplished by subjecting several frames to a single lateral point load. The applied load and global displacement were measured and recorded with a computerized data acquisition system.
2.2. Test Assemblies
2.2.1. Frame Dimensions
All frames had an 8-foot story height and 12-foot nominal bay width. Story height was measured to the top of the beam, and bay width was measured from center to center of the columns. A typical frame is shown in Figure 2-1.
Figure 2-1 1S1B Frame
A general schematic of typical frame geometry is shown in Figure 2-2. Knee brace dimension labeled kb was either 30 inches or 36 inches, depending on frame manufacturer.
Figure 2-2 Typical 1S1B Frame Geometry
Five frames were tested. Dimensions and descriptions of the individual structures follow.
2.2.2. Frame Manufacturer and Species
Frames were provided by various manufacturers and were milled from several species of wood. The timbers for the first structure to be tested were milled from locally grown ponderosa pine by 2 Dog Construction of Laramie, Wyoming. University of Wyoming civil engineering faculty and students constructed the frame.
Four companies each donated one unassembled frame. The Cascade Joinery, Everson, Washington provided a frame manufactured from Douglas fir; Benson
Woodworking, Walpole, New Hampshire furnished an eastern white pine structure; and
12’
8’
kb
Riverbend Timber Framing, Blissfield, Michigan supplied a white oak frame. Earthwood Homes, Sisters, Oregon donated a Port Orford cedar frame that was milled by
non-professionals at a timber-framing workshop.
2.2.3. Mortise and Tenon Joinery
All frames were constructed with traditional mortise and tenon connections fastened with wood pegs. Figure 2-3 depicts a portion of an unassembled frame showing typical parts. The unassembled frame of Figure 2-4 has a beam-to-column spline rather than a mortise and tenon joint. A photograph of a typical column mortise with beam housing is shown in Figure 2-5. The housing as shown is offset such that the outer face of the beam is flush with the column to facilitate sheathing installation. Use of a housing is a detail that was not utilized on all frames.
Figure 2-3 Typical Mortise and Tenon Joinery
Figure 2-4 Disassembled Ponderosa Pine Frame
Knee Brace Mortise Tenon Beam Column Peg Hole
Figure 2-5 Mortise and Housing, Douglas Fir Frame
2.2.4. Peg species and size
All frames utilized one-inch pegs at all joints with one exception. The eastern white pine frames had ¾-inch pegs at the knee brace joints. The ponderosa pine and white oak frames had white oak pegs, while the Douglas fir and Port Orford cedar frames incorporated red oak pegs.
2.2.5. Member Dimensions
As shown in Table 2-1 the timber cross-section dimensions and knee brace distances varied with each manufacturer.
Table 2-1 1S1B Frame Member Dimensions
Beam Column Knee Brace
Width (in) Depth (in) Width (in) Depth (in) Width (in) Depth (in) Knee Brace Distance, kb (in) Douglas Fir 5.25 9.25 7.25 7.25 3.25 5.25 30
Eastern White Pine 5.75 9.75 7.75 7.75 2.75 5.75 36
Ponderosa Pine 6.25 9 7 7 3 4.75 30
Port Orford Cedar 5.25 9.25 7.5 7.5 3.5 5.5 30
White Oak 6.75 8.75 6.75 10.75 4 6 36
The frames were typically shipped in the green moisture condition and all timbers were planed with the exception of the ponderosa pine frame. However, due to the
extended period of the testing schedule, significant drying and consequential shrinkage occurred in the timbers. Therefore, the dimensions listed are approximate and may vary as much as 0.25 inches for a given frame part.
2.2.6. Knee Brace Joint Details
Details of knee brace joint dimensions are listed in Table 2-2. As shown in Figure 2-6, there are two possible values of end distance for a single-peg knee brace joint: end distance a or end distance b. The recorded distance is the lesser of the two values. All frames, with the exception of the white oak assemblies, used a single peg at each knee brace joint. As shown in Figure 2-7, the white oak frame knee brace joint had two pegs spaced transversely at 2.75 inches. The recorded knee brace joint end distance for a given joint within the white oak frame is the minimum of the four possible values. The reported end distance is the average recorded value for a given frame.
Table 2-2 1S1B Knee Brace Joint Details
End Distance (in) Edge Distance (in) Tenon Width (in) Housing Depth (in) Number of Pegs Peg Diameter (in) Douglas Fir 2.25 2.5 2 .5 1 1
Eastern White Pine 1.5 1.75 1.5 0 1 .75
Ponderosa Pine 1.5 2 1.5 0 1 1
Port Orford Cedar 2.5 2 2 .5 1 1
White Oak 1.5 1.5 2 0 2 1
The knee brace peg holes in the beams and columns were typically drilled prior to shipment to the laboratory, but the tenon holes were drilled during frame assembly. Shrinkage and warping of the timbers prior to assembly caused difficulty with frame assembly. Consequently, tenon end distances within a given frame varied significantly.
Figure 2-6 Single Peg Knee Brace End Distance
Figure 2-7 Double Peg Knee Brace End Distance
end distance b end distance a end distance a end distance b end distance c end distance d
2.2.7. Beam-to-Column Connection
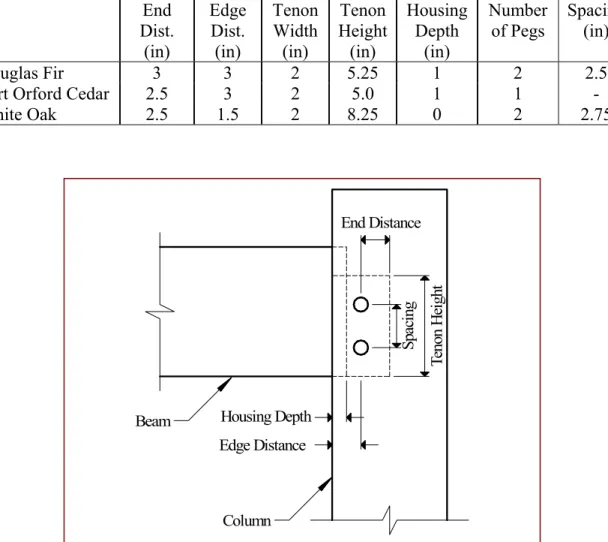
Details of the beam-to-column connection for three of the frames are listed in Table 2-3. Figure 2-8 illustrates typical mortise and tenon construction of the beam-to-column joint used on these three frames.
Table 2-3 1S1B Beam-to-Column Joint Details
End Dist. (in) Edge Dist. (in) Tenon Width (in) Tenon Height (in) Housing Depth (in) Number of Pegs Spacing (in) Douglas Fir 3 3 2 5.25 1 2 2.5
Port Orford Cedar 2.5 3 2 5.0 1 1 -
White Oak 2.5 1.5 2 8.25 0 2 2.75
Figure 2-8 Typical Beam-to-Column Joint Detail
T eno n H ei g ht Spa ci n g Housing Depth Edge Distance Beam Column End Distance
As shown in Figure 2-9, the ponderosa pine frame beam-to-column connection was formed with a 1.5-inch thick red oak through-spline pegged to the column and wedged to the outside column face. The eastern white pine frame also had splined beam-to-column connections, but as shown in Figure 2-10, the spline was pegged to both the beam and column.
Figure 2-9 Ponderosa Pine Beam-to-Column Joint Detail
Figure 2-10 Eastern White Pine Beam-to-Column Joint Detail
7.00" 4.00" 5.00" 12 .00" Beam Column 7.75" 9. 75" 4.75" 3.00" 1.00" 2.00" 2.00" 1.25" 1.50" 2.25" 1.50" Spline Stub Tenon 4.50" 3.50" 3.50" 3.00" 8.00" 1. 50" 1. 25 " 1.25" 4 .00" Beam Column Wedge Mortise Spline 7.00" 9. 00 "
2.3. Experimental Program
2.3.1. Test Setup
A schematic of frame loadings, reactions and global displacement is shown in Figure 2-11. The lateral load, P was applied by an MTS hydraulic actuator system with a load capacity of 55 kips and available displacement of 3 inches in each direction (6 inches total). Lateral load was applied to the beam of each assembly via steel plates lag screwed to each side of the beam. Application of the load to the beam most closely represented uniform lateral load transfer via diaphragm action. Applied force was measured with a load cell at the actuator. Global frame displacement, ∆top was measured with a linear potentiometer located at the top of the frame.
Figure 2-11 Load and Displacement Measurements
Displacement was imposed in both directions. As viewed from the north, load applied to the right is referred to as the “push” stroke and is plotted as a positive load on
∆
P
North Elevation
all charts. Load applied to the left is referred to as the “pull” stroke and is plotted as a negative load on all charts.
2.3.2. Load Magnitude
The approximate magnitudes of the lateral load applied to the experimental frames were determined based on assumed structure location and dimensions. The following calculations for design lateral wind load are based on ASCE 7-02, Minimum Design Loads for Buildings and Other Structures (ASCE 2002). Equation (2.1) provides the velocity pressure, qz in psf at any height. Kz is the velocity pressure exposure
coefficient; Kzt is the topographic factor; Kd is the wind directionality factor; V is the basic wind speed in miles per hour; and I is the importance factor.
qz = 0.00256KzKztKdV2I (2.1)
For heights less than 15 feet, Equation (2.2) provides the expression for velocity pressure coefficient, Kz where zg is the gradient height and α is the power law coefficient. These two coefficients are empirical values provided in Table 6-5 of ASCE 7-02.
Kz = 2.01(15/zg)2/α (2.2)
For calculating a design load, the structure was assumed to be located in exposure category C; therefore zg= 900, α = 9.5 and subsequently, Kz = 0.849. The structure was assumed to be in category II occupancy, therefore the importance factor is 1.0. Assuming a basic wind speed of 90 mph, a topographic factor of 1.0 and a wind directionality factor of 1.0, Equation 2.2 provides a velocity pressure qz = 17.6 pounds per square foot (psf). This value is constant for any height up to 15 feet.
Design wind pressure, pz is a function of building geometry and is calculated as shown in Equation (2.3), where qz is the velocity pressure in psf; G is the gust effect factor; and Cp is the external pressure coefficient.
pz = qzGCp (2.3)
The structure was assumed flat-roofed and square in plan dimensions. Given these assumptions, the windward wall pressure coefficient is 0.8 and the leeward wall coefficient is –0.5. The gust factor is 0.85. Therefore, the windward wall design pressure is 12.0 psf and the leeward wall pressure is –7.5 psf. Statical division of the load dictates half of the load will be transferred to the top of the frame and half will be transferred to the bottom of the frame at the foundation. Assuming even lateral force distribution through a horizontal diaphragm and a bent spacing of 12 feet, the design wind load on one frame is 930 pounds.
In practice, the design wind load would vary depending on the aforementioned variables. Within this paper, the design wind load is provided only as a means to compare an applied test load to an anticipated design load. The maximum lateral load applied during the first cycle of frame loading was approximately equal to the design wind load of 930 pounds.
2.3.3. Gravity Load
Selected frames were tested with additional gravity load applied. The load was created by hanging several 300-pound concrete cylinders from each side of the beam. The load was typically applied as three point loads on the top of the beam to give a total load of 1800 pounds. As with the wind load, assuming bents spaced 12 feet on center, a total load of 1800 pounds would be equivalent to a uniformly distributed load of 12.5 psf. A distributed load of 12.5 psf is a reasonable estimate of expected dead load along with some sustained live load.
2.4. Moisture Content and Joint Numbering
A Delmhorst J2000 meter with a probe length of 1.5 inches was used to measure moisture content at the joint locations of all frame members. Averages of moisture content for the 1S1B frames are listed in Table 2-4. Complete moisture content data are shown in Appendix A with the joints numbered as shown in Figure 2-12. Moisture content was not measured on the ponderosa pine frame.
Table 2-4 1S1B Frame Moisture Content (%)
Columns Beams Knee Braces
Eastern White Pine 15.7 9.7 8.8
White Oak 18.6 18.4 16.8
Douglas Fir 16.8 15.2 15.6
Port Orford Cedar 9.4 9.8 8.9
Figure 2-12 Joint Numbering for 1S1B Frames.
6 5 4 2 3 1 South Elevation
2.5. Overview of Test Results
The following sections provide a brief description of the load cycles for each of the five frames. Due to the need to investigate nuances of each frame, the number of load cycles applied to four of the five frames frame ranged from 3 cycles to 19 cycles. The Port Orford cedar frame was selected for the study of fatigue loading and therefore, was subjected to 912 reversible load cycles. Summary tables for the load cycles are provided in Appendix B.
Brief descriptions of observed joint damage and failure are also included in the following sections. In no instance was any frame loaded beyond its ultimate load. In other words, at the point of maximum load, the all frames were able to resist additional load.
Joint failure or damage was observed in many forms. The pegs commonly failed in two manners: a single hinged flexural failure labeled mode III as shown in Figure 2-13, and a double hinged shear and flexural failure labeled mode V as shown in Figure 2-14. Mode III and mode V failures are discussed in Chapter 1. Minor crushing of the peg material was also common in many of the joints.
Figure 2-14 Mode V Shear-Flexural Peg Failure
Failure of the tenon relish was common in many frames. An example of relish failure is shown in Figure 2-15. There were also some instances of a single tenon split from the peg hole to the tenon end. Crushing of the tenon material at the edges of the peg hole was evident in many joints, particulary those of relatively low material specific gravity, such as eastern white pine. Similar damage occurred at the edges of the mortise peg holes.
Figure 2-15 Tenon Relish Failure
Other forms of damage or failure occurred in isolated instances and are described individually in the appropriate section.
2.5.1. Douglas Fir
The Douglas fir frame was load cycled three times. The first cycle included no gravity load other than the frame’s self weight, but the second and third cycles included 1800 pounds of additional gravity load. Maximum lateral loads of 2640 pounds on the push stroke and 2560 pounds on the pull stroke were applied on the final cycle.
Disassembly after testing revealed that the pegs located at the beam-to-column joints had minimal damage. However, three of the four knee brace pegs failed in flexure mode III. The knee brace peg at joint 1 had some bearing damage but otherwise did not fail. There was minimal damage to the members.
2.5.2. Eastern White Pine
The eastern white pine frame was subject to a total of 10 load cycles. The frame was initially cycled with no additional gravity load. Prior to the second cycle 1800 pounds of additional gravity load was applied and remained in place for the duration of testing. On the third cycle the wood knee brace pegs were replaced with steel dowels. All knee brace pegs were removed entirely for the fourth cycle and new woods pegs were reinstalled prior to the fifth cycle.
Cycles 5 through 7 included increasing load for each cycle with the applied load reduced to service level for the eighth cycle. Spline pegs were removed for the ninth cycle. New spline pegs were reinstalled for the tenth and final cycle, while all knee brace and column to beam joint pegs were removed.
No indication of failure was exhibited during testing. Disassembly of the frame revealed crushing of the peg located at knee brace joint 1. All of the knee brace tenons (joints 1, 2, 4, and 5) had slight damage near the peg hole. The holes were slightly
elongated and a minimal amount of spalling was present at the surface of the tenon. No damage was visible at the column to beam joints.
2.5.3. Ponderosa Pine
The ponderosa pine frame was initially cycled 7 times on the push stroke and once on the pull stroke, but several of those cycles were at loads less than 500 pounds. Multidirectional loading began on the ninth cycle. Additional gravity load of 3000 pounds was added for cycle 11 and reduced to 1200 pounds for cycle 12. The additional gravity load of 1200 pounds remained for the duration of testing.
The frame was tested with knee brace pegs removed for cycle 16, and the new pegs were reinstalled for subsequent tests.
Initial failure, during cycle 17, was exhibited by a loud “pop” sound from joint 4 as the frame reached an applied load of 2200 pounds in the push direction. Joint 4 was in tension during the push stroke. Although there was a tensile failure in the knee brace joint, the frame was able to resist additional load due to the compressive capacity of the opposing knee brace.
Cycle 18 produced a maximum displacement of 2.46 inches at a load of 2660 pounds on the push stroke, and 2.25 inches at 2190 pounds on the pull stroke.
Disassembly of the frame revealed no significant damage to the pegs, but there were tenon relish failures in knee brace joints 1 and 4.
2.5.4. Port Orford Cedar
The Port Orford cedar frame was subjected to a total of 912 load cycles. Of these, data was collected for only 11 cycles. The remaining cycles were conducted at a
relatively rapid frequency of 12 cycles per minute with an imposed deflection of one inch in each direction.
Repair of joint 1, column to knee brace, was performed after 376 cycles. The knee brace mortise was originally mislocated and a patch or “Dutchman” had been installed with polyurethane glue. Although there is evidence to suggest that polyurethane glue is an acceptable structural adhesive (Vick 1998), it may not be appropriate for repairing timber frame joints. The original patch suffered significant delamination and was repaired prior to cycle 377 with a resorcinol adhesive. Testing immediately after repair indicated the patch had minimal effect on overall frame performance. The joint then performed as expected and no further repair was required.
Also, after 376 cycles, all pegs and both knee braces were replaced. Inspection of the original pegs revealed mode III failures in knee brace joints 1 and 4. A tenon relish failure also occurred at knee brace joint 4. The remaining pegs and tenons had minimal damage.
Replacement of the east knee brace included a load cell in-line with the member. As shown in Figure 2-16, this setup facilitated direct measurement of knee brace force.
Figure 2-16 Port Orford Cedar 1S1B Knee Brace Load Cell
Prior to the final test, after cycle 1312, all pegs were again replaced. The pegs that were installed during cycles 377 through 1312 had significant failures. All of the pegs with the exception of knee brace joint 3 had mode III failures. The peg from joint 3 had only minor bearing damage.
The final test cycle subjected the frame to a maximum load of 2512 pounds on the push stroke and 2687 pounds on the pull stroke. Upon frame disassembly the following damage was observed: all of the pegs incurred mode III failures, and there was no damage to any frame tenons.
2.5.5. White Oak
The white oak frame was cycled eight times; however, five of the cycles were with SIP sheathing installed. The frame was initially cycled without gravity load and then 1800 pounds of dead weight was added for the second cycle. SIPs were then installed and the frame was cycled five times. Performance of sheathed frames is
reported in Chapter 5. The panels were removed for the final cycle, but the data collected on the last cycle is of minimal value, because the frame appeared to be damaged during cycling with panels installed.
This frame had one of the few member failures observed throughout all of the testing. As the load approached the maximum of 2600 pounds on the push stroke, the west column began to split at the top. This was due to cross grain tension applied by the beam as it tended to withdraw from the column.
All of the pegs installed on this frame exhibited some bearing damage and several of the knee brace joint pegs failed. At the west knee brace, both pegs from joint 1
appeared to have the initial stage of mode V failure, as did one of the pegs at joint 3, and the other peg from joint 3 failed in a combination of mode III and mode V. Two of the pegs at the east knee brace failed in mode V, one of the pegs at joint 6 exhibited a combination of mode III and mode V failure, and one of the pegs at joint 4 showed only bearing damage. The white oak frame had significantly more peg damage compared to the other frames.
Relish failures were limited to the east knee brace. Joints 4 and 6 each had one relish failure.
2.6. Results
2.6.1. Service Level Load Results
Table 2-5 provides global stiffness results for the first load cycle that subjected each frame to the design lateral force of 930 pounds. The frames were subjected to lateral load and self weight only (no additional gravity load was applied). With an average stiffness of 3000 pounds per inch, the white oak frame had more than twice the stiffness of the other frames. The higher stiffness of the white oak frame is primarily due to the higher stiffness of oak joints and the additional peg at all knee brace connections.
Table 2-5 Service Level Performance With No Added Gravity Load
Push Stroke Pull Stroke Average
Frame Max Load (lb) Max Disp. (in) Stiffness at Max Load (lb/in) Max Load (lb) Max Disp. (in) Stiffness at Max Load (lb/in) Stiffness at Max Load (lb/in) Total Free Disp. (in) Douglas Fir 1010 1.13 1030 1010 1.14 990 1010 0.23
Eastern White Pine 1000 0.94 1340 1000 1.10 1130 1240 0.40 Ponderosa Pine 1200 1.05 1260 1200 1.28 1110 1190 0.30 Port Orford Cedar 990 0.85 1180 1000 0.83 1640 1410 0.25
As discussed in Chapter 1, previous joint testing by others has shown a reduced stiffness at low load. Such reduced low-load stiffness causes an interval of relatively low stiffness in the load-displacement curve of the full-scale frames. This deflection, termed free displacement ∆free, is shown in the typical chart of Figure 2-17. The chart
demonstrates the method of determining maximum global stiffness kG and free
displacement. Free displacement for all frames is shown in Table 2-5. The value ranges from a high of 0.40 inches for the eastern white pine frame to a low of 0.05 inches for the white oak frame. Again, the favorable value for the white oak frame is primarily a function of material properties and the added knee brace peg.
Service level load-displacement curves for all frames are shown in Appendix C.
Douglas Fir 1S1B cycle 1 -1500 -1000 -500 0 500 1000 1500 -1.5 -1.0 -0.5 0.0 0.5 1.0 1.5
Displacement, ∆top (in)
L oad , P (l b ) ∆free= 0.23" kG = 1030 lb/in kG = 990 lb/in
2.6.2. Effect of Gravity Load
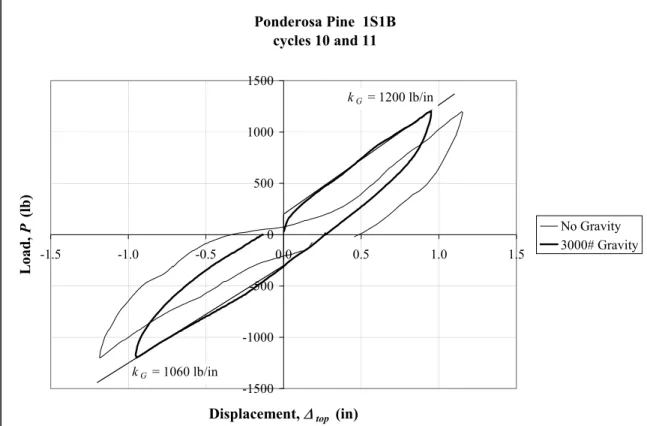
Four of the frames were tested with additional gravity load applied to the beam and the results are shown in Table 2-6. Three of the frames were tested with 1800 pounds of additional gravity load, while the ponderosa pine frame was tested with both 1200 pounds and 3000 pounds of additional gravity load. Three of the four frames exhibited zero free displacement with the additional gravity load (the ponderosa pine frame required the full 3000 pounds before free displacement was eliminated). Figure 2-18 shows a load versus displacement curves for a frame with gravity load overlaying the curve for the same frame with no gravity load, thus indicating the reduction in free displacement. Curves for all frames with added gravity load are shown in Appendix D.
Table 2-6 Service Level Performance with Added Gravity Load
Push Stroke Pull Stroke Average
Frame Gravity Load (lb) Max Load (lb) Max Disp. (in) Stiffness at Max Load (lb/in) Max Load (lb) Max Disp. (in) Stiffness at Max Load (lb/in) Stiffness at Max Load (lb/in) Total Free Disp. (in) Douglas Fir 1800 1000 1.07 1080 1030 1.10 1100 1090 0.30 Eastern White Pine 1800 1010 0.68 1490 1010 0.71 1430 1460 0
Ponderosa Pine 1200 1200 1.08 1440 1200 1.08 1120 1280 0.25 Ponderosa Pine 3000 1200 0.95 1200 1200 0.95 1060 1130 0
Figure 2-18 Reduction in Free Displacement Due to Gravity Load
The results for the Douglas fir frame are somewhat anomalous in that the frame exhibited increased free displacement when gravity load was added. As shown in Table 2-7 the addition of gravity load typically increased global frame stiffness and reduced total free displacement.
Table 2-7 Effect of Added Gravity Load
Frame Gravity Load (lb) Percent Increase in Stiffness Percent Decrease in Free Displacement Douglas Fir 1800 8% -30%
Eastern White Pine 1800 18% 100%
Ponderosa Pine 1200 8% 17% Ponderosa Pine 3000 -5% 100% White Oak 1800 25% 100% Ponderosa Pine 1S1B cycles 10 and 11 -1500 -1000 -500 0 500 1000 1500 -1.5 -1.0 -0.5 0.0 0.5 1.0 1.5
Displacement, ∆top (in)
Load, P (lb) No Gravity 3000# Gravity kG = 1200 lb/in kG = 1060 lb/in
2.6.3. Removal of Knee Brace Pegs
An investigation of the effectiveness of knee brace pegs was performed by removing such pegs from the eastern white pine frame and comparing results to a previous test. A gravity load of 1800 pounds was in place for both tests.
As shown in Figure 2-19, removal of the knee brace pegs resulted in increased free displacement; however, the frame stiffness of 1270 pounds per inch is not
significantly less than the fully pegged frame stiffness of 1460 pounds per inch. This indicates that a compressive knee brace attains increased stiffness as the knee brace shoulder bears on the column or beam surfaces. In this case, the stiffness of the single compressive knee brace was nearly as large as the combined stiffness of both a
compressive and tensile knee brace.
Figure 2-19 Effect of Removing Knee Brace Pegs Eastern White Pine 1S1B
cycles 2 and 4 -1500 -1000 -500 0 500 1000 1500 -1.50 -1.00 -0.50 0.00 0.50 1.00 1.50
Displacement, ∆top (in)
Load, P (lb) No Knee Brace Pegs Gravity kG = 1280 lb/in kG = 1260 lb/in ∆free= 0.2"
2.6.4. Direct Measurement of Knee Brace Force
As shown in Figure 2-16, a load cell was installed in one of the knee braces of the Port Orford cedar frame. Figure 2-20 shows both applied load and knee brace force plotted versus global frame displacement. This chart demonstrates the relatively higher proportion of lateral resistance provided by the knee brace when in compression
compared to when it was subjected to tensile loading. The knee brace carried a compressive force that was 75 percent greater than the tensile force, 2419 pounds compression versus 1386 pounds tension.
Figure 2-20 Knee Brace Force vs. Applied Load
In Figure 2-21, knee brace force is plotted against the sum of the corresponding knee brace displacements. The results can be interpreted two different ways for
characterizing knee brace behavior.
Port Orford Cedar 1S1B cycle 377 -3000 -2500 -2000 -1500 -1000 -500 0 500 1000 1500 2000 -1.50 -1.00 -0.50 0.00 0.50 1.00 1.50
Frame Displacement, ∆top (in)
Load,
P
(lb)
Knee Brace Force,
F (lb) P F Fmax=1386 Pmax=1011 Pmax=-1012 Fmax=-2419
Figure 2-21 Knee Brace Stiffness
One method of interpretation assumes constant stiffness across the full range of displacement, although allowing a distinction between compressive and tensile actions. Tensile knee brace stiffness, ktens = 14,200 pounds per inch, and compressive knee brace stiffness, kcomp = 24,800 pounds per inch with a free joint displacement ∆kbfree = 0.035 inches.
However, Figure 2-21 obviously indicates two distinct parts of compressive behavior: an initial stiffness kcomp and a secondary stiffness k’comp. The initial compressive stiffness kcomp = 16,000 pounds per inch is comparable to the tensile stiffness, and this behavior is assumed to be load transfer exclusively through the pegs. The significantly higher secondary stiffness k’comp is assumed to be due primarily to bearing action of the knee brace shoulder onto the beam and column surfaces.
Port Orford Cedar 1S1B cycle 377 -3000 -2500 -2000 -1500 -1000 -500 0 500 1000 1500 2000 -0.15 -0.10 -0.05 0.00 0.05 0.10 0.15
Total Knee Brace Joint Displacement (in)
Knee Brace Force (lb)
∆kbfree= 0.035"
ktens = 14,200 lb/in
kcomp= 16,000 lb/in
2.6.5. Unbraced Stiffness
In most modeling situations a wood-pegged mortise and tenon joint is assumed to act as a pinned connection. That is, the joint is expected to act as a hinge, thereby
allowing no moment transfer between adjoining members. If the beam-to-column joint actually has some moment capacity, an unbraced frame would retain some minimal global stiffness. In order to evaluate this assumption, the eastern white pine frame was examined with the knee braces removed.
Figure 2-22 compares the frame with knee braces removed to the initial load displacement cycle. Gravity load of 1800 pounds was applied in both cases. Removal of the knee braces reduced the stiffness from the original average of 1460 pounds per inch to 300 pounds per inch. Although the frame retains some residual stiffness due to friction and the rotational restraint of the beam-to-column joint, the magnitude of this stiffness is minimal compared to the stiffness of the braced frame. Also of importance is the
increase in free displacement to 0.5 inches, whereas the braced frame with gravity load had no free displacement.
Figure 2-22 Effect of Removing Knee Braces Eastern White Pine 1S1B
cycles 2 and 10 -1500 -1000 -500 0 500 1000 1500 -2.50 -2.00 -1.50 -1.00 -0.50 0.00 0.50 1.00 1.50 2.00 2.50
Displacement, ∆top (in)
Load, P (lb) No Knee Braces Gravity kG = 280 lb/in kG = 330 lb/in ∆free= 0.5"
2.6.6. Cyclic Effects
The Port Orford cedar frame was cycled 350 times. The effects of cyclic loading are compared in Figure 2-23. The average global stiffness increased slightly from an average stiffness of 1410 pounds per inch prior to 1640 pounds per inch after 350 cycles. The increase in frame stiffness is not readily explainable but may be due to densification of the pegs, causing increased dowel bearing stiffness. While frame stiffness increased slightly, the free displacement increased dramatically from 0.25 inches to 0.75 inches.
Figure 2-23 Cyclic Effects
Upon completion of the cyclic loading, both knee braces and all pegs were replaced. Additional testing then revealed that frame performance returned to the original level and free displacement was greatly diminished. Although the loads applied during cyclic loading were relatively low, the frame experienced displacements of 1 inch
Port Orford Cedar 1S1B cycles 2 and 355 -1500 -1000 -500 0 500 1000 1500 -1.5 -1.0 -0.5 0.0 0.5 1.0 1.5
Displacement, ∆top(in)
Load, P (lb) cycle 2 cycle 355 kG = 1400 lb/in kG = 1870 lb/in ∆free= 0.75"
in each direction. The high displacement was assumed to have caused peg and tenon damage resulting in consequential large free displacement.
2.6.7. Peg Effects
The significance of peg properties on frame performance was investigated by replacing the oak pegs with steel dowels in the knee brace joints of the eastern white pine frame. The global frame stiffness increased only slightly from 1460 pound per inch to 1510 pounds per inch and there was no free displacement. Gravity load was applied for both cases. As shown in Figure 2-24, there is little difference between the two curves.
Figure 2-24 Effect of Peg Material Eastern White Pine 1S1B
cycles 2 and 3 -1500 -1000 -500 0 500 1000 1500 -1.50 -1.00 -0.50 0.00 0.50 1.00 1.50
Displacement, ∆top (in)
Load, P (lb) steel dowels wood pegs kG = 1400 lb/in kG = 1610 lb/in
2.6.8. Maximum Load
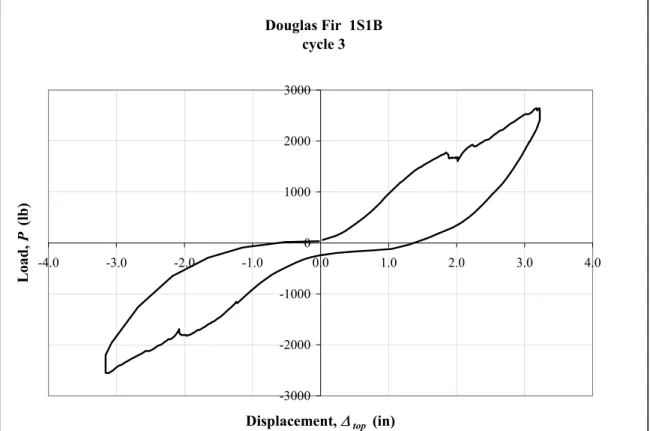
A typical chart of the maximum displacement cycle is shown in Figure 2-25. Although there are spikes in the curve due to local failures, the frame continued to carry increasing load up to the maximum available displacement of approximately 3 inches. At such a high level of displacement, the frame is assumed to be well beyond any
serviceability limit. Therefore, since this curve is typical of all frames examined, it can be concluded that stiffness, not strength, is likely to be the controlling design factor for unsheathed frames under lateral load.
Figure 2-25 Typical 1S1B Maximum Load Cycle
Maximum load cycles for all frames are shown in Appendix E. Douglas Fir 1S1B cycle 3 -3000 -2000 -1000 0 1000 2000 3000 -4.0 -3.0 -2.0 -1.0 0.0 1.0 2.0 3.0 4.0
Displacement, ∆top (in)
Load,
P
2.7. Summary
Using an allowable deflection of height/400, the allowable drift due to wind load on an eight-foot high frame would be approximately 0.25 inches. Given the design wind load of 930 pounds for a 1S1B frame, the minimum required frame stiffness would be 3720 pounds per inch. The stiffness of all frames was lower than this value. This indicates that traditional timber frames with knee braces as the primary lateral load support do not have adequate stiffness to resist typical wind loads. However, at displacements far beyond serviceable limits, all frames continued to carry increasing load. Therefore, these frames have sufficient strength to resist lateral load.
All frames exhibited displacement at low load levels. While this free-displacement may be an important design consideration, in all but one instance it was significantly reduced or eliminated with the application of additional gravity load. It is expected that most frames would be constructed and utilized such that additional gravity load due to floors, partition walls, finish materials and furnishings is always present.
Direct measurement of the knee brace force on the Port Orford cedar frame indicates that the knee brace in compression carries significantly more force than the tension brace. This is also supported by the test in which the knee brace pegs were removed from the eastern white pine frame. In this situation, the compression knee brace resisted all lateral load. Although the frame exhibited increased free-displacement, the magnitude of frame stiffness was nearly as large as the fully pegged frame.
Analysis of knee brace joint displacement versus force in the Port Orford cedar frame indicates that the compression component consists of two parts. The joint stiffness is initially relatively low at small displacement but increases as displacement increases.
A step increase in compression side stiffness is assumed to be due to the additional joint stiffness realized as the joint surfaces bear against one another.
The low stiffness of the unbraced eastern white pine frame indicates that the knee braces provide a majority of the frame stiffness. Thus, the assumption of a perfect hinge at the beam-to-column joint is acceptable.
Cyclic loading of the Port Orford cedar frame indicates that although there is minimal change in frame stiffness, the free-displacement increased significantly.
Substitution of the steel dowels in place of oak pegs in the eastern white pine frame revealed minimal change in frame behavior. Peg properties are therefore expected to have minimal effect on the behavior of frames constructed of low-density wood such as pine.
3.
2S2B Unsheathed Frame Testing
3.1. Overview
The primary objective of this part of the research project was to characterize the response of full-scale, two-dimensional, two-story two-bay (2S2B) timber frames subjected to lateral load. In addition, these full-scale tests presented the opportunity to closely observe the nuances of frame behavior and individual joint failure mechanisms.
The objective was accomplished by subjecting several frames to lateral load. The applied load and global displacement were measured and recorded with a computerized data acquisition system.
3.2. Test Assemblies
3.2.1. Frame Dimensions
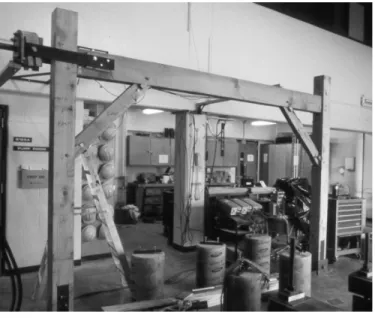
The frames had an 8-foot story height and 12-foot nominal bay width; thus these frames had a total height of 16 feet measured to the top of the upper beam and nominal width of 24 feet measured from center to center of the outer columns. A photograph of a typical 2S2B frame is shown in Figure 3-1.
Figure 3-1 2S2B Frame
A general schematic of typical frame geometry is shown in Figure 3-2. Knee brace dimension, kb was either 30 inches or 36 inches, depending on frame manufacturer. Four frames were tested. Dimensions and descriptions of the individual structures
Figure 3-2 Typical 2S2B Frame Geometry
3.2.2. Frame Manufacturer and Species
Frames were provided by various manufacturers and were milled from several species of wood. Four companies each donated one frame: Riverbend Timber Framing, Blissfield, Michigan supplied a northern white oak frame; Benson Woodworking, Walpole, New Hampshire furnished an eastern white pine structure; Earthwood Homes, Sisters, Oregon donated a Port Orford cedar frame that was cut by non-professionals at a timber-framing workshop; and The Cascade Joinery, Everson, Washington provided a frame manufactured from Douglas fir.
12' 0" 12' 0" 8' 0" 8' 0" 16' 0 " 24' 0" kb
3.2.3. Mortise and Tenon Joinery
The frames were constructed with traditional mortise and tenon connections fastened with wood pegs as described in Chapter 2.
3.2.4. Peg species and size
All joints utilized one-inch pegs with two exceptions. The white pine frames had ¾-inch pegs at the knee brace joints, and the white oak frame had 1¼-inch pegs at the beam-to-column splines.
The Port Orford cedar and eastern white pine frames had white oak pegs. The white oak frame also had white oak pegs with the exception of the spline pegs, which were red oak. The Douglas fir frame utilized red oak pegs.
3.2.5. Member Dimensions
As shown in Table 3-1 the timber cross-section dimensions and knee brace distance varied with each manufacturer.
Table 3-1 2S2B Frame Dimensions
Beam Column Knee Brace
Width (in) Depth (in) Width (in) Depth (in) Width (in) Depth (in) Knee Brace Distance, kb (in) Douglas Fir 5.25 9.25 7.25 7.25 3.25 5.25 30
Eastern White Pine 5.75 9.75 7.75 7.75 2.75 5.75 36
Port Orford Cedar 5.25 9.25 7.5 7.5 3.5 5.5 30
White Oak 6.75 8.75 6.75 10.75 4 6 36
The frames were typically shipped in the green moisture condition and all timbers were planed. However, due to the extended period of the testing schedule, significant drying and consequential shrinkage occurred in the timbers. Therefore, the dimensions listed are approximate and may vary as much as 0.25 inches for a given frame member.