Construct validity of the Herth Hope Index: A systematic
review
Introduction
Hope is a universal multidimensional psychological construct that relates to a person’s expectation that they will obtain desirable results based on realistic, future goals. Hope is a motivating factor for initiating or maintaining actions to achieve a goal and can be facilitated or sustained through an individual’s support networks and interpersonal relationships. Hope is positively associated with happiness, perseverance,
success, health, compatibility, and social support[1-3] and
can neutralize the effects of stress on mental, behavioral,
and physical health.[1] Furthermore, studies indicate that
hope is considered an inner source[4] that is crucial to
finding the meaning of ones’ life, solidarity, positive
self-assessment, and self-worth,[5] which can ultimately lead to
self-actualization.[6] Schrank et al. (2008) completed a systematic
review investigating hope in psychiatry and found that the concept is vital as both a process and outcome variable in the
recovery from severe mental illness.[7] Hope has gradually
received attention from both policymakers and practitioners Objective: The psychological construct of hope is an important determinant for mental health and well-being. The availability of valid and reliable instruments to measure hope is, therefore, critical. Despite a large number of psychometric studies on the Herth Hope Index (HHI), its construct validity has not yet been determined. Therefore, this paper aimed to conduct a systematic review of the psychometric properties of the HHI. Methods: Databases such as PubMed, Science Direct, Google Scholar, Magiran, SID, IranDoc, and IranMedex were evaluated systematically using the terms “HHI,” “psychometric,” “validity,” “reliability,” and related terms (with the use of OR and AND operators) and no restrictions on the year of publication. A total of 13 eligible studies were found published between 1992 and 2018 in the USA, Portugal, Switzerland, Iran, Germany, Petersburg, Japan, the Netherlands, Lima, Peru, and Norway. The methodology used in the available studies included principal component analysis
(n = 6), maximum likelihood estimation (n = 5), and principal axis factoring (n = 1).
One study did not point the methodology.
Results: Four studies reported the total extracted variances to be less than 50%, six studies reported variance between 50% and 60%, and three papers reported variance that exceeded 60%. Of the papers that examined the factor structure of the HHI, two studies reported a one-factor solution, seven reported two factors, and four reported a three-factor solution. Although the HHI is the most widely translated and psychometrically tested tool in languages other than English, psychometric variations in factor solutions remain inconsistent.
Conclusion: Findings highlight the need for future research that appraises the validity of the HHI in different countries, and how the measure relates to other scales that evaluate hope.
Keywords: Herth Hope Index, psychometric properties, reliability, systematic
review, validity
Nahid Dehghan Nayeri
1,2,
Amir Hossein Goudarzian
3,
Kaye Herth
4, Navaz Naghavi
5,
Hamid Sharif Nia
6,
Ameneh Yaghoobzadeh
7,
Saeed Pahlevan Sharif
8,
Kelly-Ann Allen
91Department of Critical Care Nursing and
Nursing Management, School of Nursing and Midwifery, Tehran University of Medical Sciences, Tehran, Iran, 2Nursing and Midwifery
Care Research Center, Tehran University of Medical Sciences, Tehran, Iran, 3Mazandaran
University of Medical Sciences, Sari, Iran,
4Minnesota State University, Mankato, Mankato,
MN, USA, 5Faculty of Business and Law,
Taylor’s Business School, Taylor`s University lakeside campus. Jalan Taylor’s, 47500 Subang Jaya, Selangor, Malaysia, 6School of Nursing
and Midwifery Amol, Mazandaran University of Medical Sciences, Sari, Iran, 7School of
Nursing and Midwifery, Tehran University of Medical Sciences, Tehran, Iran, 8Taylor’s
Business School, Taylor’s University, No. 1, Jalan Taylor’s, 47500 Subang Jaya, Selangor, Malaysia, 9Monash University, Clayton, Victoria,
Australia
Address for correspondence:
Ameneh Yaghoobzadeh, School of Nursing and Midwifery, Tehran University of Medical Sciences, Tehran, Iran. Phone: +98 9375651975. E-mail: [email protected]
ABSTRACT
WEBSITE: ijhs.org.sa
ISSN: 1658-3639
concerning its potential impact on well-being and quality of
life for individuals.[8]
The plethora of studies focusing on hope as a core construct for well-being is pervasive across different fields. Schrank et al. (2008) indicated that 32 instruments have been designed to measure hope. Some examples of these instruments include the Snyder Hope Scale (1991), State Hope Scale (1997), Miller
Hope Scale (1988), and the Herth Hope Scale (HHS) (1989).[7]
The creation of the Herth Hope Index (HHI) is based on Dufault and Martocchio’s (1985) multidimensional hope theory which takes into account philosophical, religious, sociological, and
psychological factors.[9,10] The purpose of this index was to
access multiple dimensions of hope, provide a clear expression of the unique dimensions of hope in clinical populations, and reduce both the complexity and number of items of the other available measures. The HHI was designed in 1991 to evaluate hope in young people with chronic illnesses. It consists of 12 items responded to on a four-point Likert-type scale, from one
(completely disagree) to four (completely agree).[11]
The original HHS and the abbreviated version, the HHI, are the most widely translated and psychometrically tested tools
in a language other than English.[9,12-14] Despite a large number
of psychometric studies on this index and its wide use in non-English speaking cultures, its validity as an appropriate tool has not yet been fully confirmed. Such research points to a need to better understand hope and further investigate
the HHI in varied cultural contexts.[14] It has been argued that
some items of the tool may be problematic for use in certain
cultures leading to invalid results.[9] As many studies have only
focused on conceptualizing the HHI rather than evaluating the measure, it is necessary to conduct a comprehensive review of the index to evaluate its potential usefulness. A search of previous literature indicates that no systematic review has been conducted on the evaluation of the index psychometrically. Therefore, the present study aims to present a systematic review of the psychometric properties of the HHI.
Methods
Study design and search strategy
A systematic review of the literature was conducted using PubMed, Scopus, Web of Science, Embase, Science Direct, and Google Scholar databases to assess articles with English-language abstracts. Persian-English-language articles from databases, including Magiran, SID, IranDoc, and IranMedex, were evaluated as well. Date of publication was not restricted and all past studies up until December 2018 were considered. The search terms “HHI,” “psychometric,” “validity,” “reliability,” and related terms (with the use of OR and AND operators) were used. Two researchers assessed the titles and abstracts of related articles independently. Articles were included into the study if they used only the HHI in the study, contained the search term keywords in the title or abstract, were in English or
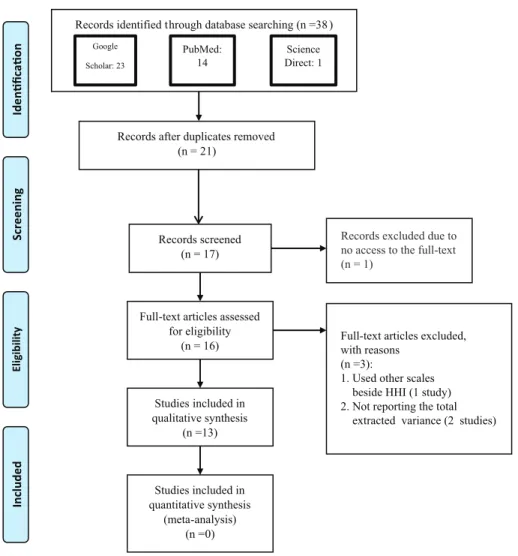
Persian with an English abstract, and conducted a cross-cultural psychometric assessment, including measures of reliability, validity, or diagnostic accuracy of the measure. Only studies that reported the construct validity using factor analysis were included in the study. Figure 1 displays the stages of article selection based on preferred reporting items for systematic reviews and meta-analyses guidelines.
Checking the quality of studies
The quality of the procedure was assessed by two independent investigators using two bias risk assessment tools, including the Quality Assessment of Diagnostic Accuracy Studies
(QUADAS-2)[15] and the checklist of Standards for Reporting of
Diagnostic Accuracy (STARD).[16] QUADAS-2 was designed
to carefully review the method of the studies reviewed. This tool evaluates the internal consistency of the study and contains 14 items with a three-option answer (i.e., yes, no, and
unknown).[15] The 25-item checklist of Standards for Reporting
Diagnostic accuracy studies (STARD) was used to check the study design quality (including the sample collection and data). In the current study, the revised version of these tools was used to assess the studies that analyzed the validity and reliability of the HHI. Inconsistencies between the scales were resolved by discussion among the two independent investigators. If an agreement was not reached about the validity and reliability of the assessed articles, a third researcher was invited to the study to assess the articles.
Data abstraction
After evaluating the quality and accuracy of the articles, the following data were extracted: Authors’ name(s), publication year, study-type, number of participants (and their mean age), number of extracted variables, and explained total variance and validity. The appraisal checklists were approved by ten faculty members (five assistant professors, three associated professors, and two full professors in nursing) before determining the quality of each study to ensure the validity aligned with the aim of the present study.
Ethical considerations
Ethical issues (including plagiarism, informed consent, misconduct, data fabrication and/or falsification, double publication and/or submission, and redundancy) were considered by authors.
Results
A total of 38 studies using the HHI were initially extracted. From these, 21 duplicated papers were excluded resulting in 16 papers with full-text access. Based on exclusion criteria, 13 articles were deemed eligible for a systematic review. Figure 1 indicates the process of selecting studies and their inclusion in the present systematic review.
Quality assessments
A total of 13 studies that focused on the validation of the HHI were evaluated using QUADAS-2 and STARD, described previously. In general, the quality of all studies was acceptable based on the risk assessment tools. The risk for bias that was noted included possible loss of important results, lack of descriptions of the study inclusion and exclusion criteria, and issues related to the acceptability and management of selected samples.
Studies description
Studies meeting criteria for final evaluation were published between 1992 and 2018 in the USA, Portugal, Switzerland, Iran, Germany, Russia (Petersburg), Japan, the Netherlands, Lima, Peru, and Norway. Most of the included studies utilized simple and convenience sampling, and sample sizes were reported to be between 45 and 500 participants. Four studies did not indicate the sampling method.
Six studies used a principal component analysis (PCA),[17-19]
one utilized principal axis factoring,[25] five used maximum
likelihood (ML) estimation,[20-23] and one study did not point the
methodology. Three studies used confirmatory factor analysis.
[5,18,22] Two studies reported a one-factor solution of the HHI,
[22-24] seven reported two factors,[5,18,20,23-25] and four reported a
three-factor solution.[17,21,23,26] Four studies reported the total
extracted variance to be less than 50%,[17-18,25] six reported the
variance to be between 50% and 60%,[19,20,22,24] and the total
variance reported for three studies was reported to be greater
than 60%.[21,23,26]
To examine the construct validity of the studies, weighted averages of the percentage of extracted variances were assessed. While there are variances in the techniques used to extract factors between PCA and exploratory factor analysis (EFA), many scientists use them interchangeably and PCA is frequently used when EFA would be more appropriate. EFA emphasizes the shared variance of the variables, whereas PCA focuses on the total variation among the variables; therefore, the percentage
of the extracted variance of PCA will be greater than EFA.[33]
Reliability of the HHI
Two papers performed test-retest using correlation coefficients
and reported this value as >0.7.[18,23] The other 11 studies used
Records identified through database searching (n =38)
Screenin
g
Included
Eligibilit
y
Idenficao
n
Records after duplicates removed (n = 21)
Records screened (n = 17)
Full-text articles assessed for eligibility
(n = 16)
Studies included in qualitative synthesis
(n =13)
Studies included in quantitative synthesis
(meta-analysis) (n =0) Google
Scholar: 23
PubMed:
14 Direct: 1Science
Full-text articles excluded, with reasons
(n =3):
1. Used other scales beside HHI (1 study) 2. Not reporting the total extracted variance (2 studies)
Records excluded due to no access to the full-text (n = 1)
Cronbach’s alpha to assess internal consistency, of which two
studies had an alpha of <0.7 for one of the extracted factors[21]
and the rest were above 0.7.[24] Moreover, one study reported
composite reliability for the two extracted factors, with values
of 0.88 and 0.69.[25]
Discussion
The present study provides a systematic evaluation of 13 studies that evaluated the HHI. It is crucial to use a valid and reliable instrument to measure hope, considering the
importance of its role in both morbidity and well-being.In
addition, psychometric assessment is very important for nursing researchers as a whole. Over the past two decades, researchers focusing on nurses have used the principles of psychometric assessment to design and test instruments for measuring important phenomena in the field of nursing. Therefore, it is vital to use instruments with established validity and reliability to conduct this research or design new instruments when
needed.[28]
The studies in this review were conducted across different disciplines, contexts, countries, and languages. The increasing interest in the HHI is evident by the growing number of publications over the years, with nine papers published after 2010. As the HHI takes into account philosophical, religious,
sociological, and psychological contexts,[14,29] the index can be
highly contextual based on where the measure is administered. Therefore, measuring the HHI using a one-fits-all approach does not seem appropriate and might limit the ability to generalize the findings. Thirteen studies incorporating the HHI by utilizing a standardized methodology.
Of the 13 studies that utilized the HHI, 30% of the selected studies did not report the sampling method, while the remainder utilized simple and convenience sampling methods. Although the convenience sampling method may be the only available option under some research circumstances, additional methods should be considered to generalize the study findings. Various analytical techniques (e.g., PCA, ML, and PAF) were applied in the selected studies, which resulted in different construct structures. However, none of the selected papers discussed the rationale for choosing their selected method. Average variance extracted (AVE) of 0.5 and above is one of
the criteria used to establish construct validity.[30] In eight of the
studies, the AVE was greater than 0.5, whereas the remainder showed less validity.
More than 80% of the articles (11 total) incorporated Cronbach’s alpha to assess internal consistency and reliability. Irrespective of the reported value of Cronbach’s alpha, to the best of the authors’ knowledge, no single reliability index can be considered a perfect assessment tool. Although alpha is always a lower bound of reliability, other formulae have been developed for estimating reliability; some are
more accurate than alpha, but none have gained as much
popularity.[31] It is encouraged that researchers use at least two
indices to ensure valid reliability. Reliability is the equality of the results over time and under the same condition which is measured by the repeatability and reproducibility of the
results.[32] Reliability consists of three different parts, including
stability, equivalence, and homogeneity. Researchers use different methods to measure each of the three parts (e.g.,
test-retest, Cronbach’s alpha, and split-half).[33] Cronbach’s alpha
determines the average internal consistency of questions. It is the most common measure of internal consistency when the questions have multiple Likert or Likert-type measures. However, test-retest measures test the consistency by giving the same test twice to the same people at different times to see if the scores are the same. It is supposed that the measured concept and the samples’ features have not been changed
during the two times.[34] As the concept of hope is a relatively
stable concept over time, some studies have used the test-retest
method to assess the reliability of the HHI.[18,23] However,
memory effect, fatigue effect, and genuine change effect can have an impact on test-retest reliability. For reliability, as discussed in the theory of reliability, it is not possible to calculate reliability exactly; instead, researchers intending to estimate reliability will find it always remains an imperfect endeavor. Two reliability estimates used in the selected 13 studies are test-retest and Cronbach alpha test. Cronbach alpha, which is the most familiar flavor under internal consistency strategy, has been applied in all the selected studies, while only two studies (15% of the sample) used test-retest as a complementary test. It is worth mentioning the amount of time that elapses between two tests among a sample
is critical in the test-retest estimate. The shorter the gap,
the higher the correlation. While comparing the correlation coefficients of different research outputs, one should bear in mind the test-retest method can present considerably different estimates depending on intervals. Although the time intervals were not the same in both studies (1 week and 2 weeks), the correlation coefficients remained relatively similar. Besides these methods, intraclass correlation coefficient is the more desirable measure of reliability that reflects both degrees of correlation and agreement between measurements. It has been widely used to evaluate inter-rater, test-retest, and intra-rater
reliability (Table 1).[35] The results of the present study indicate
that one study[25] assessed consistency using the average
inter-item correlation.[3]
All selected studies tested the psychometric properties of the HHI scale. Three factors of temporality and future, positive readiness and expectancy, and interconnectedness were first introduced by Herth (1999) as underlying factors to develop the HHI. Since then, the above-mentioned factorial structures of the HHI were examined in different countries to investigate if cross-cultural, demographic, and societal factors can influence the validity and reliability of Herth’s (1999) hypothesized factors. However, exploratory factor analyzes in the selected studies did not confirm the original
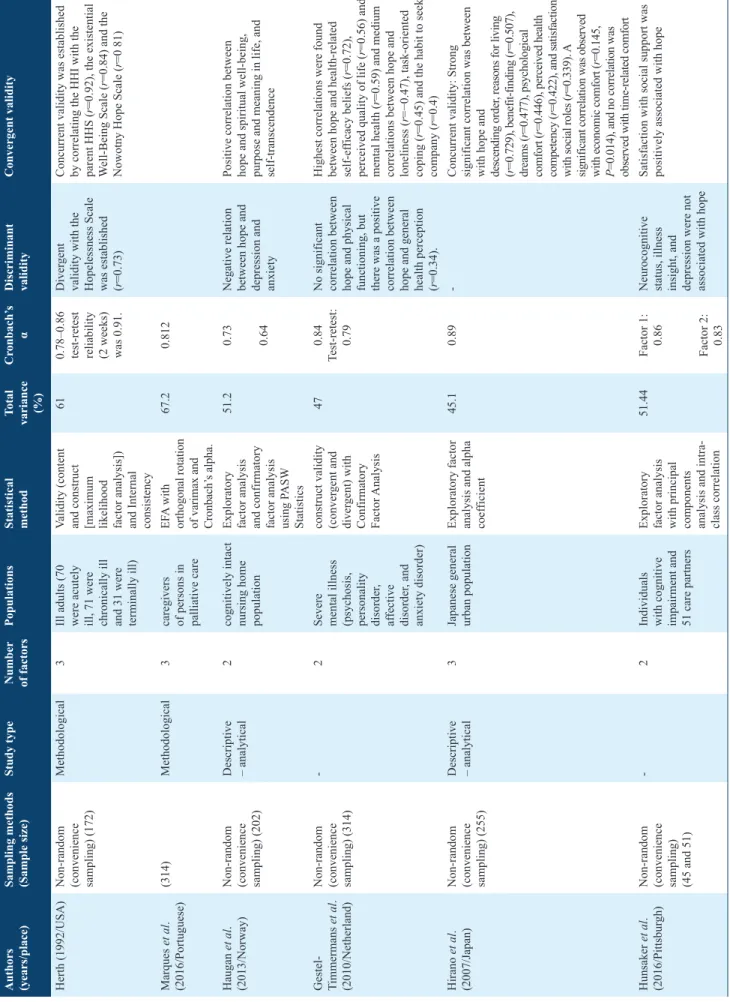
Table
1:
Extracted studies used HHI
Authors (years/place) Sampling methods (Sample size)
Study type
Number of factors
Populations
Statistical method Total variance (%)
Cr
onbach’
s
α
Discriminant validity
Convergent validity
Herth (1992/USA)
Non-random (convenience sampling) (172)
Methodological
3
Ill adults (70 were acutely ill, 71 were chronically ill and 31 were terminally ill) Validity (content and construct [maximum likelihood factor analysis]) and Internal consistency
61
0.78–0.86 test-retest reliability (2 weeks) was 0.91.
Diver
gent
validity with the Hopelessness Scale was established (r=0.73) Concurrent validity was established by correlating the HHI with the parent HHS (
r
=0.92), the existential
W
ell-Being Scale (
r
=0.84) and the
Nowotny Hope Scale (
r =0 81) Marques et al . (2016/Portuguese) (314) Methodological 3
caregivers of persons in palliative care
EF
A with
orthogonal rotation of varimax and Cronbach’
s alpha. 67.2 0.812 Haugan et al . (2013/Norway)
Non-random (convenience sampling) (202) Descriptive – analytical
2
cognitively intact nursing home population Exploratory factor analysis and confirmatory factor analysis using P
ASW
Statistics
51.2
0.73
Negative relation between hope and depression and anxiety Positive correlation between hope and spiritual well-being, purpose and meaning in life, and self-transcendence
0.64
Gestel- Timmermans
et al
.
(2010/Netherland)
Non-random (convenience sampling) (314)
-2
Severe mental illness (psychosis, personality disorder
, af fective disorder , and anxiety disorder)
construct validity (conver
gent and
diver
gent) with
Confirmatory Factor
Analysis
47
0.84
Test-retest: 0.79
No significant correlation between hope and physical functioning, but there was a positive correlation between hope and general health perception (r=0.34). Highest correlations were found between hope and health-related self-ef
ficacy beliefs (
r =0.72), perceived quality of life ( r =0.56) and
mental health (
r
=0.59) and medium
correlations between hope and loneliness (
r
=−0.47), task-oriented
coping (
r
=0.45) and the habit to seek
company ( r =0.4) Hirano et al . (2007/Japan)
Non-random (convenience sampling) (255) Descriptive – analytical
3
Japanese general urban population Exploratory factor analysis and alpha coef
ficient
45.1
0.89
-Concurrent validity: Strong significant correlation was between with hope and descending order
, reasons for living
(
r
=0.729), benefit-finding (
r =0.507), dreams ( r =0.477), psychological comfort ( r
=0.446), perceived health
competency (
r
=0.422), and satisfaction
with social roles (
r
=0.339). A
significant correlation was observed with economic comfort (
r
=0.145,
P
=0.014), and no correlation was observed with time-related comfort
Hunsaker
et al
.
(2016/Pittsbur
gh)
Non-random (convenience sampling) (45 and 51)
-2
Individuals with cognitive impairment and 51 care partners Exploratory factor analysis with principal components analysis and intra- class correlation
51.44
Factor 1: 0.86 Neurocognitive status, illness insight, and depression were not associated with hope Satisfaction with social support was positively associated with hope
Factor 2: 0.83
(
Contd
Castilla Cabello et al
. (2014/Lima,
Peru)
Non-random (convenience sampling) (210)
Methodological
2
Not clinical Peruvian Exploratory factor analysis and Internal consistency
54.5
0.85
-Balsanelli
et al
.
(2010/Portugal)
Non-random (convenience sampling) (131)
Methodological
3
Cancer patients type 2 diabetes patients and their relatives or care providers. Qui-Quadrado or Fischer test and maximum likelihood method for factor analysis
61
0.83
The higher the hope score, the lower the depression score Therefore, the higher the hope, the higher the self-esteem
Geiser
et al
.
(2015/Germany)
Non-random (convenience sampling) (over 8 months) (192)
Methodological
1
Cancer patients who were in chemotherapy or radiotherapy treatment Exploratory factor analysis with Confirmatory factor analysis, Cronbach’
s alpha
56.4
0.82
Correlations with coping styles were moderate Correlations were high with depression and anxiety as well as optimism and pessimism
W
ahl
et al
. (2004/
Norway)
Random sampling (1893)
Methodological
2
Entire
Norwegian
population from the National Register by Statistics Norway
Cronbach’
s alpha
and correlations (Pearson’
s
r
) for
scalability and Factor analysis ~maximum likelihood with varimax rotation!
38
0.81
Lower hope scores in those reporting long-term illness people with higher levels of hope also report higher levels of quality of life there is also an inverse correlation between hope and fatigue
-Benzein and Ber
g
(2003/Sweden)
(85)
Methodological
2
40 patients and 45 family members Varimax rotated principal component factor analysis and Cronbach’
s alpha
56
0.88
Discriminant validity was assessed by calculating the correlation of the HHI-S and Beck’
s
Hopelessness Scale (r=−0.69). Concurrent criterion-related validity was assessed by calculating the correlations of the HHI-S and the Miller Hope Scale (
r
=0.82).
Viana
et al
. (2010/
Portugal)
(1
17)
Methodological
1
Patients in Palliative Care Varimax rotated principal component factor analysis
50.3
0.87
-Yaghoobzadeh et al
. (2018/Iran)
Non-random (Convenience Sampling) (500) Descriptive – analytical
2
Elderlies
Validity (content and construct (maximum likelihood EF
A
with Promax rotation]) and Internal consistency with SPSS-AMOS24
49.22
0.87 0.66
Discriminant validity as the two constructs (2 subscales) had very low correlations and a negligible average and maximum shared variance Composite reliability of factor 1 was 0.877 which showed good conver
gent validity
Table
1
:
(
Continued
)
Authors (years/place) Sampling methods (Sample size)
Study type
Number of factors
Populations
Statistical method Total variance (%)
Cr
onbach’
s
α
Discriminant validity
three-factor structure by Herth (1999). Although in 30% of selected studies, the data could fit all three underlying factors introduced by Herth (1999), 54% of studies confirmed a two-factor structure. Moreover, in 15% of selected studies, the validity and reliability test approved a one-factor structure. These results demonstrated that using a scale in a culture other than the one it was originally designed for can generate a potential threat to the validity and reliability of an index. Furthermore, the variety of outcomes from using the same index in different cultures sheds light on the fact
that underlying factors of hope are not unambiguous.[20]
This may open new avenues for further research to develop a new instrument to measure hope in each specific culture. Moreover, all tools need to be culturally relevant and any translation of the HHI or any other tool needs to specifically and systematically address the cultural implications in the translation.
Conclusions
In summary, the HHI has been widely translated and psychometrically tested in many languages across numerous countries. Studies utilizing an EFA revealed that one to three factors were extracted from the HHI. The reliability of the HHI was reported as being acceptable in all of the studies. The review findings highlight the need for additional studies that appraise how the HHI is translated and interpreted in other countries and how it compares to other tools.
Authors’ Declaration Statements
Ethics approval and consent to participate
Not applicable.
Availability of data and material
The data used in this study are available and will be provided by the corresponding author on a reasonable request.
Competing Interests
The authors declare that there are no conflicts of interest.
Funding Statement
None.
Authors’ Contributions
All authors equally contributed.Acknowledgment
None.References
1. Phillips-Salimi CR, Haase JE, Kintner EK, Monahan PO, Azzouz F. Psychometric properties of the herth hope index in adolescents and young adults with cancer. J Nurs Meas 2007;15:3-23.
2. Carretta CM, Ridner SH, Dietrich MS. Hope, hopelessness, and anxiety: A pilot instrument comparison study. Arch Psychiatr Nurs 2014;28:230-4.
3. Yaghoobzadeh A, Gorgulu O, Yee BL, Wibisono AH, Sharif SP, Nia HS, et al. A model of aging perception in iranian elders with effects
of hope, life satisfaction, and socioeconomic status: A path analysis. J Am Psychiatr Nurs Assoc 2018;24:522-30.
4. Bright FA, Kayes NM, McCann CM, McPherson KM. Understanding hope after stroke: A systematic review of the literature using concept analysis. Top Stroke Rehabil 2011;18:490-508.
5. Haugan G, Utvær BK, Moksnes UK. The herth hope index-a psychometric study among cognitively intact nursing home patients. J Nurs Meas 2013;21:378-400.
6. Reed PG. Theory of self-transcendence. In: Middle Range Theory Nursing. 3rd ed. Berlin, Germany: Springer Publishing Company; 2014.
7. Schrank B, Stanghellini G, Slade M. Hope in psychiatry: A review of the literature. Acta Psychiatr Scand 2008;118:421-33.
8. Redlich-Amirav D, Ansell LJ, Harrison M, Norrena KL, Armijo-Olivo S. Psychometric properties of hope scales: A systematic review. Int J Clin Pract 2018;2018:e13213.
9. Chan KS, Li HC, Chan SW, Lopez V. Herth hope index: Psychometric testing of the Chinese version. J Adv Nurs 2012;68:2079-85. 10. Ai AL, Peterson C, Tice TN, Bolling SF, Koenig HG. Faith-based and
secular pathways to hope and optimism subconstructs in middle-aged and older cardiac patients. J Health Psychol 2004;9:435-50.
11. Herth K. Development and refinement of an instrument to measure
hope. Sch Inq Nurs Pract 1991;5:39-51.
12. Wahl AK, Rustøen T, Lerdal A, Hanestad BR, Knudsen JR, Moum T. The Norwegian version of the herth hope index (HHI-N): A psychometric study. Palliat Support Care 2004;2:255-63.
13. Benzein E, Berg A. The Swedish version of herth hope index-an instrument for palliative care. Scand J Caring Sci 2003;17:409-15. 14. Ripamonti CI, Buonaccorso L, Maruelli A, Bandieri E, Boldini S,
Pessi MA, et al. Hope herth index (HHI): A validation study in Italian patients with solid and hematological malignancies on active cancer treatment. Tumori 2012;98:385-92.
15. Whiting PF, Rutjes AW, Westwood ME, Mallett S, Deeks JJ, Reitsma JB, et al. QUADAS-2: A revised tool for the quality assessment of diagnostic accuracy studies. Ann Intern Med 2011;155:529-36. 16. Bossuyt PM, Reitsma JB, Bruns DE, Gatsonis CA, Glasziou PP,
Irwig LM, et al. The STARD statement for reporting studies of diagnostic accuracy: Explanation and elaboration. Ann Intern Med 2003;138:W1-12.
17. Hirano Y, Sakita M, Yamazaki Y, Kawai K, Sato M. The herth hope index (HHI) and related factors in the Japanese general urban population. Jpn J Health Hum Ecol 2007;73:31-43.
18. Van Gestel-Timmermans H, Van Den Bogaard J, Brouwers E, Herth K, Van Nieuwenhuizen C. Hope as a determinant of mental health recovery: A psychometric evaluation of the herth hope index Dutch version. Scand J Caring Sci 2010;24:67-74.
19. Cabello HC, Félix U, Margot C, Tello MS, Rodríguez TC. Psychometric analysis of the herth hope index in a not clinical peruvian sample. Psicol Desde Caribe 2014;31:187-206.
20. Hunsaker AE, Terhorst L, Gentry A, Lingler JH. Measuring hope among families impacted by cognitive impairment. Dementia 2016;15:596-608.
21. Balsanelli AC, Grossi SA, Herth K. Assessment of hope in patients with chronic illness and their family or caregivers. Acta Paulist Enferm 2011;24:354-8.
22. Geiser F, Zajackowski K, Conrad R, Imbierowicz K, Wegener I, Herth KA, et al. The German version of the herth hope index (hhi-d): Development and psychometric properties. Oncol Res Treat 2015;38:356-60.
23. Herth K. Abbreviated instrument to measure hope: Development and psychometric evaluation. J Adv Nurs 1992;17:1251-9.
24. Viana A, Querido AI, Dixe MA, Barbosa A. Avaliação da esperança em cuidados Paliativos: Tradução e Adaptação Transcultural do Herth Hope Index.Int J Dev Edu Psy 2010;4:607-16.
25. Yaghoobzadeh A, Sharif SP, Ong FS, Soundy A, Nia HS, Bagloee MM,
et al. Cross-cultural adaptation and psychometric evaluation of the
herth hope index within a sample of Iranian older peoples. Int J Aging Hum Dev 2018;89:356-371.
26. Marques RM, Dixe M, Querido AI, Sousa PP. Herth hope index for caregivers pf persons in palliative care-Portuguese version. CuidArte Enferm 2016;10:89-95.
27. Nia HS, Lehto RH, Sharif SP, Mashrouteh M, Goudarzian AH, Rahmatpour P, et al. A cross-cultural evaluation of the construct validity of templer’s death anxiety scale: A systematic review. OMEGA J Death Dying 2019;30222819865407.
28. LoBiondo-Wood G, Haber J. Nursing Research: Methods and Critical Appraisal for Evidence-based Practice. Netherlands: Elsevier Health Sciences; 2017.
29. Sartorius N, Kuyken W. Translation of health status instruments. In: Quality of Life Assessment: International Perspectives. Berlin, Heidelberg: Springer-Verlag; 1994. p. 3-18.
30. Sharif SP, Mostafiz I, Guptan V. A systematic review of structural
equation modelling in nursing research. Nurse Res 2018;26:28-31. 31. Bravo G, Potvin L. Estimating the reliability of continuous measures
with Cronbach’s alpha or the intraclass correlation coefficient: Toward
the integration of two traditions. J Clin Epidemiol 1991;44:381-90. 32. Drost EA. Validity and reliability in social science research. Educ Res
Perspect 2011;38:105.
33. Holbert RL, Lee J, Esralew S, Walther WO, Hmielowski JD,
Landreville KD. Affinity for political humor: An assessment of internal
factor structure, reliability, and validity. Humor 2013;26:551-72. 34. Mohammadbeigi A, Mohammadsalehi N, Aligol M. Validity and
reliability of the instruments and types of measurments in health applied researches. J Rafsanjan Univ Med Sci 2015;13:1153-70. 35. Koo TK, Li MY. A guideline of selecting and reporting intraclass
correlation coefficients for reliability research. J Chiropract Med